3148
Imaging the effect of high-protein diet on the brain Glutaryl-CoA dehydrogenase deficient mice using GluCEST MRI1Department of Radiology, University of Pennsylvania, Philadelphia, PA, United States, 2Department of Neurology, University of Pennsylvania, Philadelphia, PA, United States
Synopsis
Autosomal recessive inheritance of Glutaryl-CoA dehydrogenase (GCDH) deficiency or Glutaric Acidemia-1 is one of the common inherited metabolic disorders affecting many children worldwide. We applied GluCEST MRI to image the metabolic changes in the brain of GCDH-/- mice following the exposure to
Introduction
Glutaryl-CoA dehydrogenase (GCDH) enzyme catalyzes the complete oxidation of lysine and tryptophan. Autosomal recessive inheritance of GCDH deficiency, glutaric acidemia type I (GA-I), is one of the common inherited metabolic disorders affecting 1 out of 30,000–100,000 children worldwide1. The GA-I presents neuropathologic features similar to Huntington disease, consisting of specific striatal degeneration involving loss of medium spiny neurons and astrogliosis2,3. Following the high dietary protein and lysine exposure, cerebral Glx, GABA and NAA have been shown to be reduced in mice models of GCDH deficiency4. Glutamate Chemical Exchange Saturation Transfer (GluCEST) MRI is a recently developed technique for imaging glutamate. GluCEST provides indirect detection of glutamate in vivo by measuring the exchange of glutamate amine protons with bulk water and provides greater sensitivity and spatial resolution than conventional 1H magnetic resonance spectroscopy (1H MRS) techniques5. GluCEST MRI has been used to study tau pathology induced synapse loss6, epilepsy7, Huntington’s disease8, schizophrenia9 and parkinsonism10. In the present study, we applied GluCEST MRI to image the metabolic changes in the brain of GCDH-/- mice following high protein diet exposure.Methods
Homozygous GCDH knockout (GCDH-/-) mice were procured from Mutant Mouse Resource and Research Centers (MMRRC, NC) and bred at the University of Pennsylvania. One-month-old GCDH-/- were scanned twice for the study. The baseline scan was performed before feeding the mice with high-protein diet (HP, 70% casein-rich diet). The second scan was performed on the same mice 48-72 hrs after they were given the HP diet. For MR studies, mice were anesthetized with Isoflurane/O2 (1-2%, 1 L/hr) and positioned in a 9.4T Horizontal bore (Agilent Technologies Inc., USA) spectrometer. GluCEST imaging was performed using a custom-programmed RF spoiled gradient echo readout pulse sequence on a 2-mm thick coronal slice containing striatum, with a frequency selective continuous wave saturation preparation pulse. CEST images were collected using a 1-second saturation pulse at B1 of 250 Hz (5.9 μT) for the frequencies ±2.5-3.5 ppm from water resonance with the step-size of 0.25 ppm. The B0 inhomogeneity corrected images at 3 ppm (M+3ppm) and −3 ppm (M−3ppm) were used for computing the percent GluCEST contrast, which is equal to 100×[(M−3ppm − M+3ppm)/M−3ppm]. ROIs were manually segmented from T2-weighted images. Additionally, a 2x2x2 mm3 voxel was placed in the striatum of the GCDH-/- mice to acquire pre- and post-HP diet 1H MR spectra. The spectra were processed using LCModel.Results and Discussion
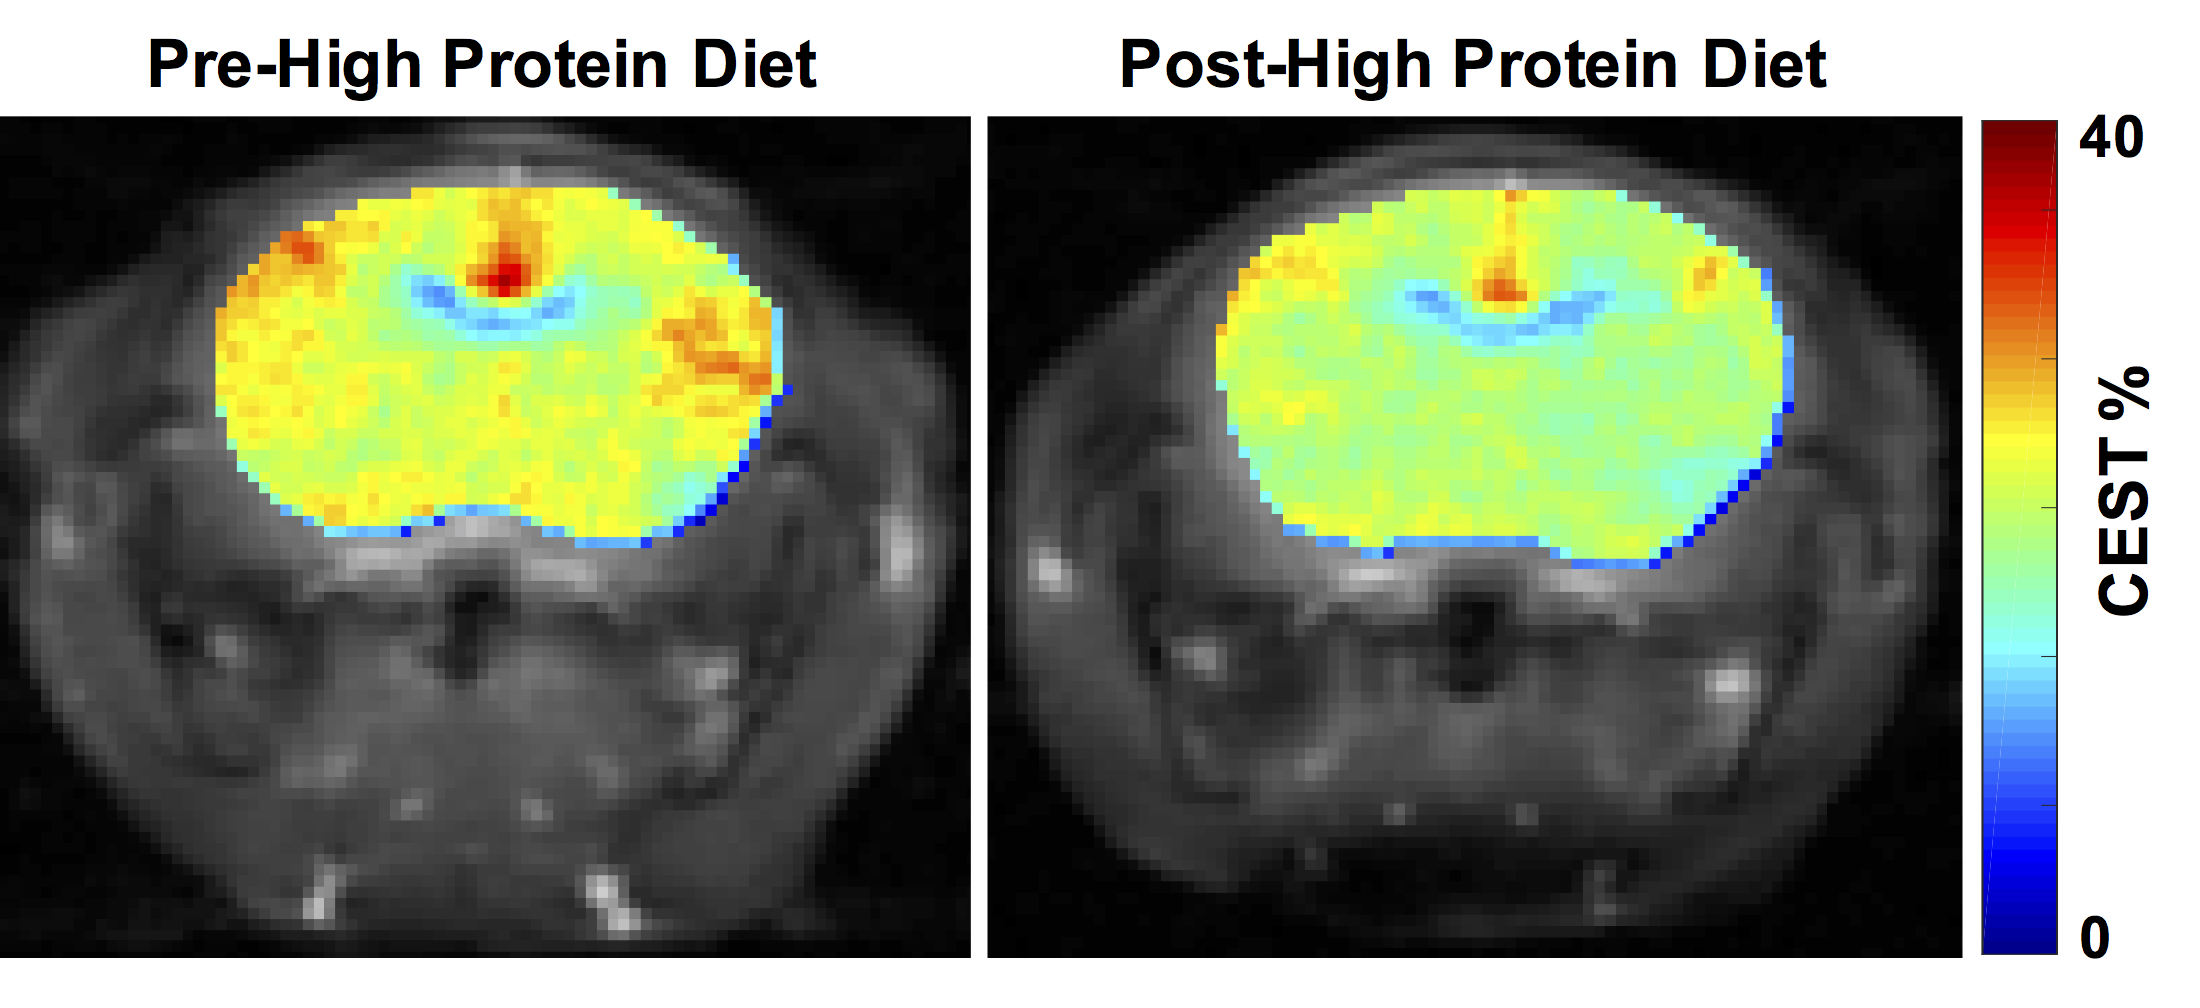
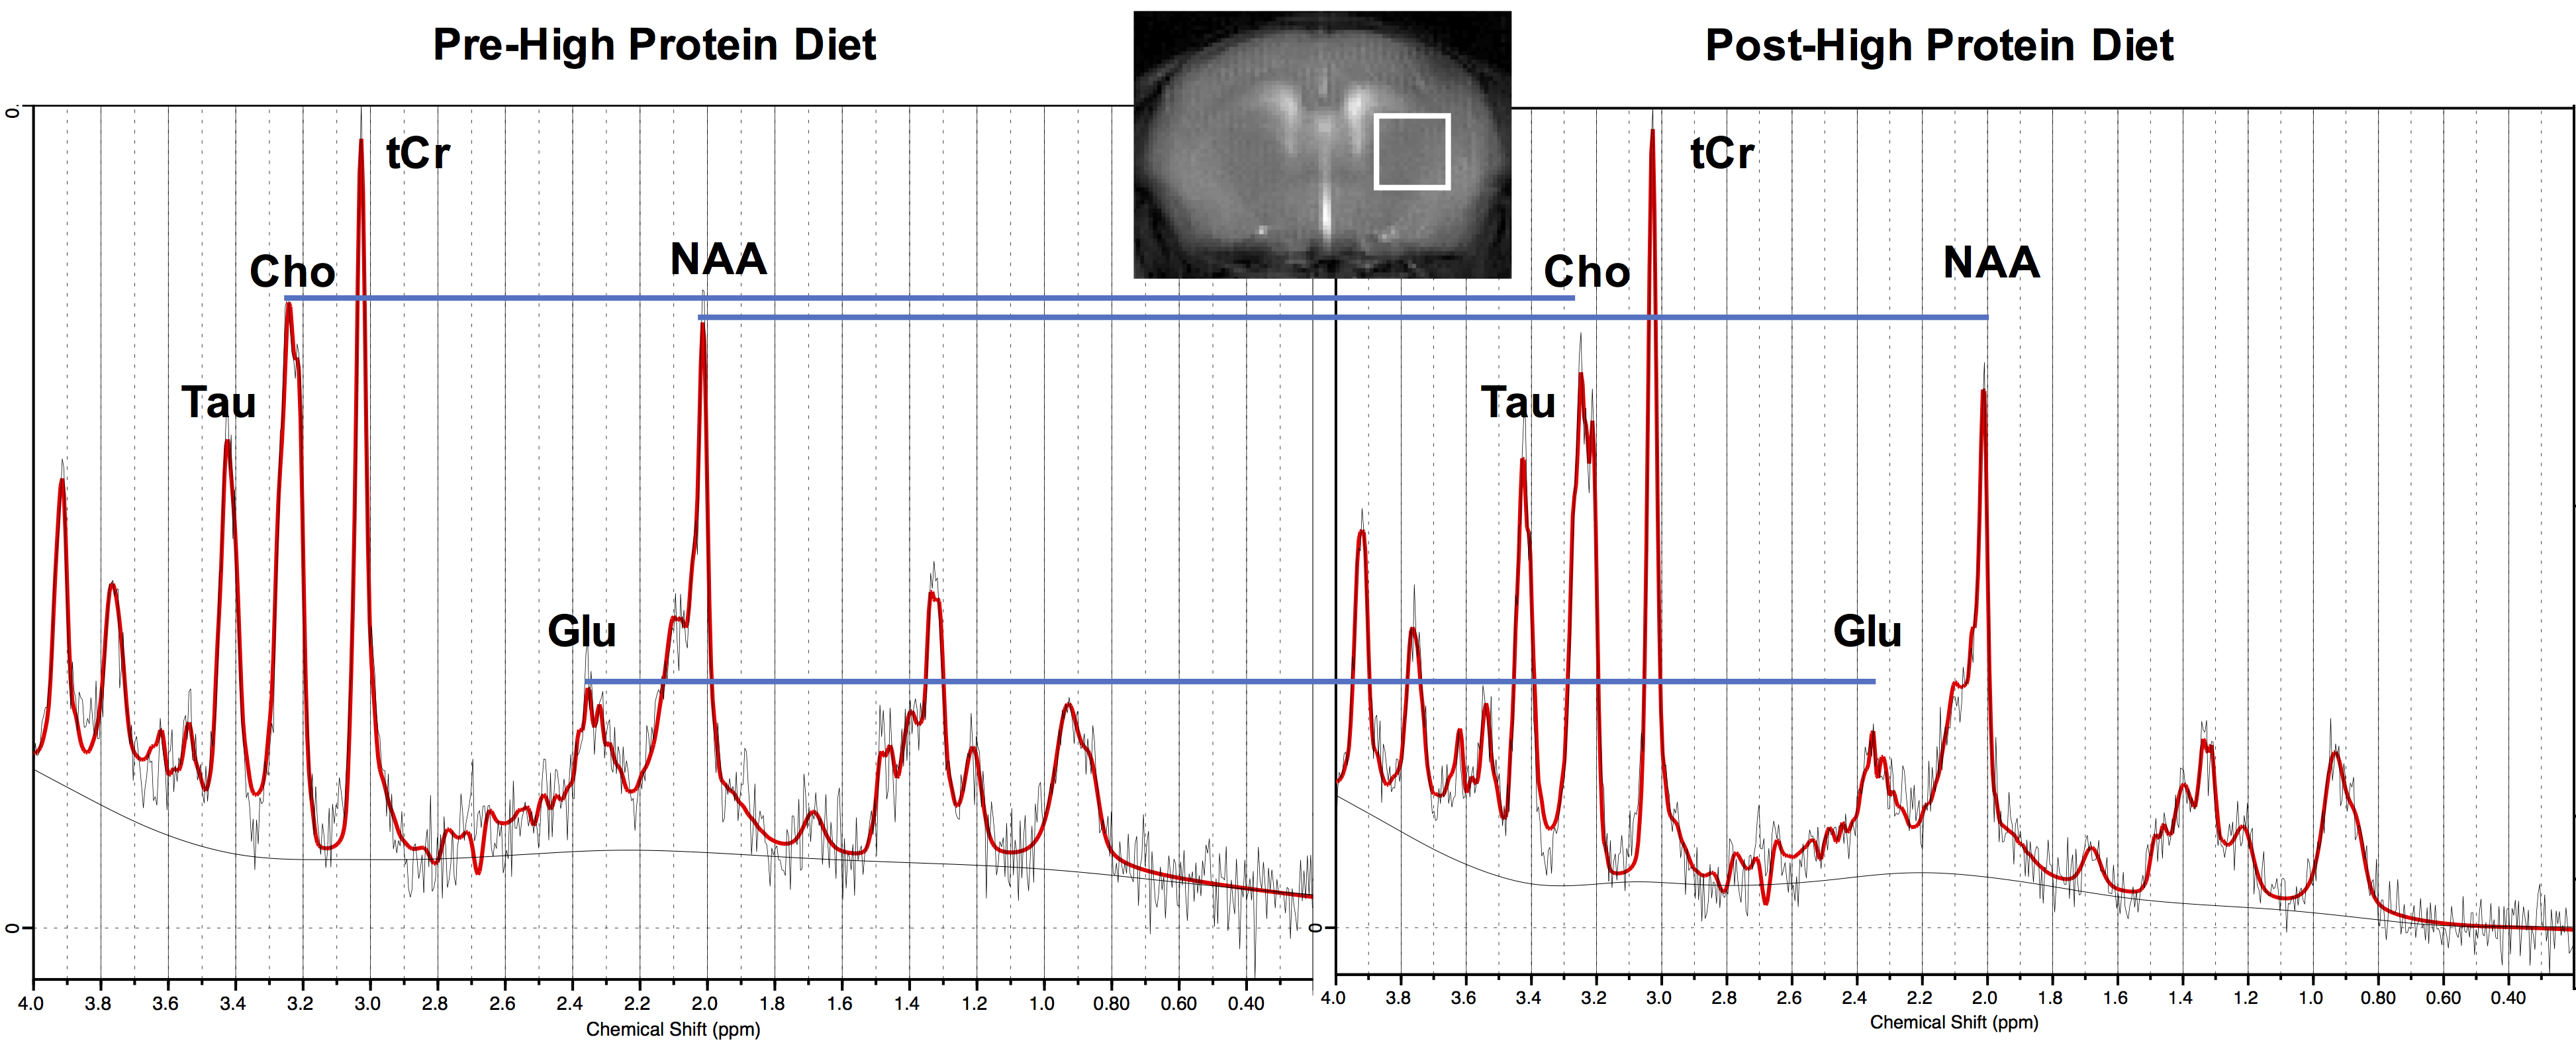
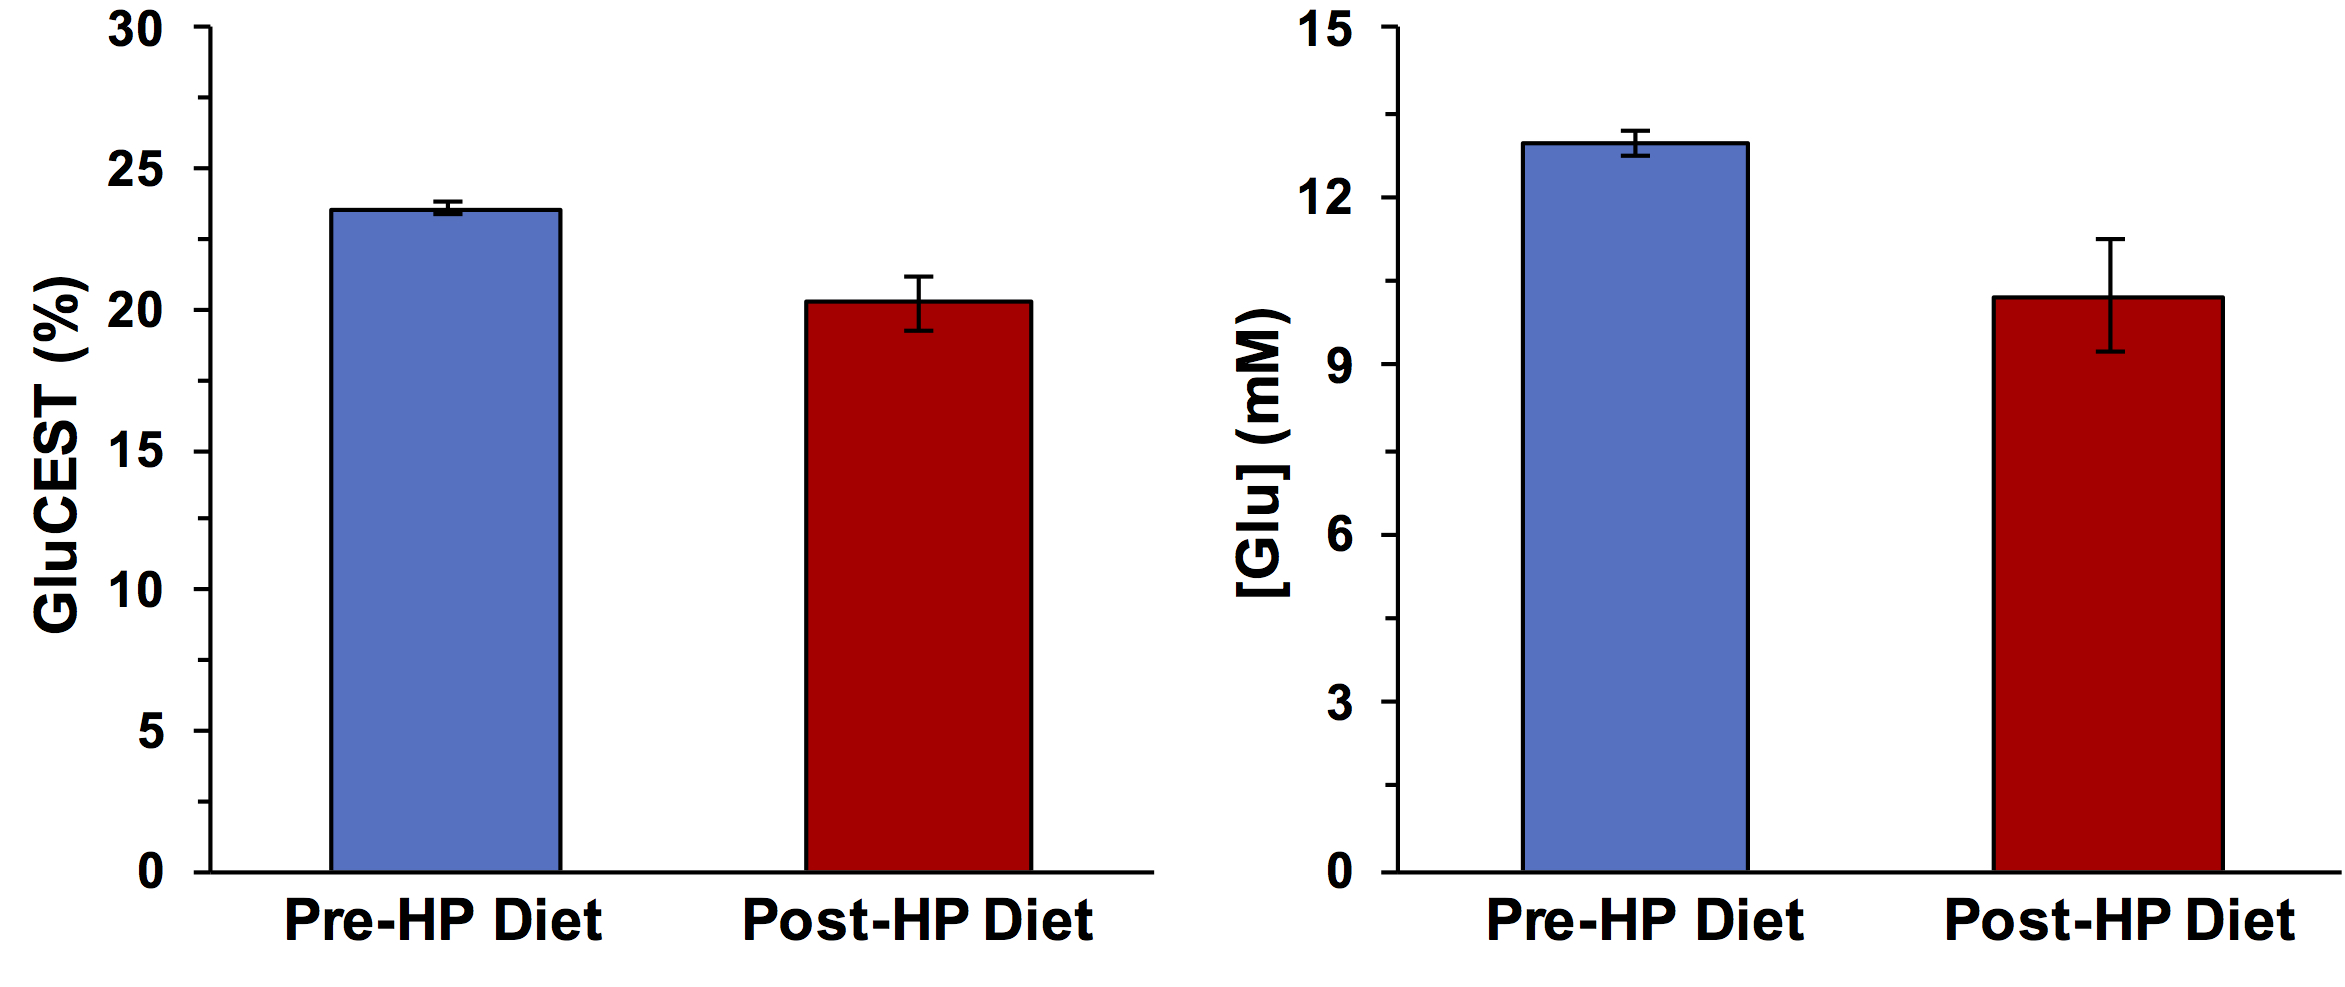
Following the HP diet exposure, the mice developed symptoms of severe weight loss and immobility. Representative GluCEST contrast maps of the brain of GCDH-/- mice before and after feeding with HP diet for 2 days are shown in Figure 1. The maps point toward a significant reduction in the GluCEST contrast in the whole brain including cortex and striatum following the HP diet. The GluCEST contrast was found to be lowered by ~3% following the exposure to the HP diet (Pre-HP: 23.6 ± 0.7%; Post HP: 20.2 ± 1.0%; n = 4, Figure 1). The LCModel processing of 1H MRS data revealed the reduction in the glutamate level (Pre-HP: 13.0 ± 1.1 mM; Post-HP: 10.2 ± 1.0 mM; n = 4; Figure 2). Additionally, NAA and choline were also found to be reduced significantly. The reduction in the GluCEST contrast corroborated well with the measured reduction in glutamate via 1H MRS (Figure 3). Additionally, GABA was also found to be significantly reduced. The other metabolites do not contribute toward GluCEST contrast suggesting the changes in the GluCEST may be due to the alterations in glutamate levels of the brain. The GluCEST MRI may be used to map the metabolic changes in the brain of GCDH-/- mice following exposure to the high protein diet. Since the high-protein diet leads to vascular and tissue damage in the brain, the amine proton transfer and magnetic transfer may be affected too. In the future studies, the effect of APT/MT changes due to the pathology of high protein diet will be evaluated.Acknowledgements
This project was supported by the National Institute of Biomedical Imaging and Bioengineering of the National Institutes of Health through Grant Number P41-EB015893 and the National Institute of Neurological Disorders and Stroke through Award Number R01NS087516.References
1. Kolker S et al (2006) Pediatr Res 59:840-847
2. Funk CB et al (2005) Brain 128:711-722
3. Soffer D et al (1992) J Neurol Sci 107:199-204
4. Zinnanti WJ et al (2007) J Clin Inv 117:3258-3270
5. Cai K et al (2012) Nat Med 18:302-306
6. Crescennzi R et al (2014) Neuroimage 101:185-92
7. Davis K et al (2015) Sci Transl Med 7:309ra161
8. Pepin J et al (2016) Neuroimage 139:53-64
9. Roalf DR et al (2017) Mol Psychiatry 22:1298-1305
10. Bagga P et al (2016) J Neurochem 139:432-439
Figures