3145
Evaluation of errors in image registration and diffusion measurement due to the cavum septum pellucidum1Institute of Medical Device and Imaging, National Taiwan University College of Medicine, Taipei, Taiwan, 2Molecular Imaging Center, National Taiwan University, Taipei, Taiwan, Taipei, Taiwan
Synopsis
To determine the registration errors caused by the cavum septum pellucidum (CSP), Dice coefficient and generalized fractional anisotropy (GFA) were assessed in brain using T1-weighted imaging and diffusion spectrum imaging (DSI), respectively. The subjects included 30 subjects with the CSP and 30 subjects without the CSP. Comparing with the subjects without the CSP, the subjects who had enlarged CSP showed significantly decreased Dice coefficient and significantly different GFA values in nine tracts. Our findings indicate that the existence of the CSP leads to errors in image registration and diffusion index calculation, and that the size of the CSP should be taken into consideration as a covariate in statistical analysis.
Introduction
The cavum septum pellucidum (CSP) is a normal variant of the cerebral spinal fluid (CSF) space which is located between the leaflets of the septum pellucidum. Approximately 15% of the adults are found to have the CSP, and so it is not rare on MRI. In image analysis, these subjects were usually included without scrutiny. To investigate the effects of the CSP on image registration and diffusion measurement, this study aimed to identify the errors of tissue segmentation and white matter tracts reconstruction caused by different sizes of the CSP.Methods
Subjects: Thirty subjects with the CSP and thirty age- and sex-matched controls without the CSP were recruited in the study. We measured the size of the CSP according to the method of Peg C. Nopoulous1. We divided these subjects into three groups (Enlarged: above 10 mm, n = 11; Median: 5-9 mm, n = 10; Small: below 5 mm, n = 9). Imaging parameters: MRI scans were performed on a 3T MRI system (TIM Trio, Siemens, Erlangen) with a 32-channel phased-array coil. T1-weighted imaging utilized a 3D magnetization-prepared rapid gradient echo pulse sequence (TR/TE = 2000/3 ms, flip angle = 9°, FOV = 256 × 192 × 208 mm^3, matrix size = 256 × 192 × 208, and spatial resolution = 1 x 1 x 1 mm^3). DSI used a twice-refocused balanced echo diffusion echo planar imaging sequence using a total of 102 diffusion encoding gradients with the maximal b value of 4000 s/mm^2: TR/TE = 9600/130 ms, FOV = 200 x 200 mm^2, matrix size = 80 x 80, 56 slices, and slice thickness = 2.5 mm. T1-weighted imaging analysis: We used SPM12 software to segment the brain into grey matter, white matter and CSF, and spatially normalize the images to a standard template ICBM152. We overlapped each subjects’ tissue probability map (TPM) with the ICBM152. We selected an ROI, 25 by 20 pixels in size and including the lateral ventricles and corpus callosum, and calculated the Dice coefficient ($$$QS=\frac{2|X∩Y|}{|X|+|Y|}$$$, where X and Y were the subject’s TPM and ICBM152’s TPM, respectively). DSI Analysis: We used whole-brain tract-based automatic analysis to obtain a 2D connectogram for each DSI dataset2. The connectogram provides generalized fractional anisotropy (GFA) profiles of 76 white matter tract bundles. Two-sample t-test was performed to compare the difference of the mean Dice coefficient between the two groups. General linear model (GLM) was applied to investigate which variables, including group, CSP size, age, gender, affected the altered tracts. We also conducted correlation to investigate the relationship between GFA and the size of the CSP.Results
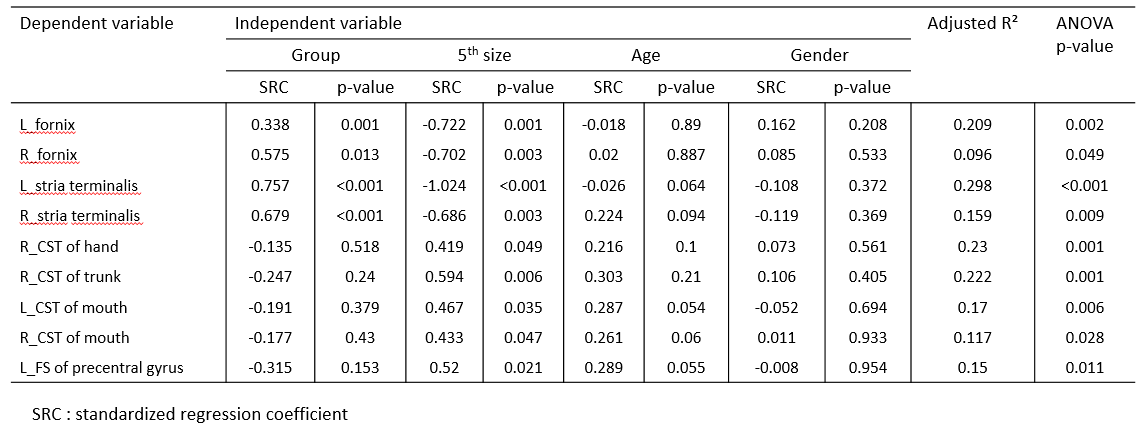
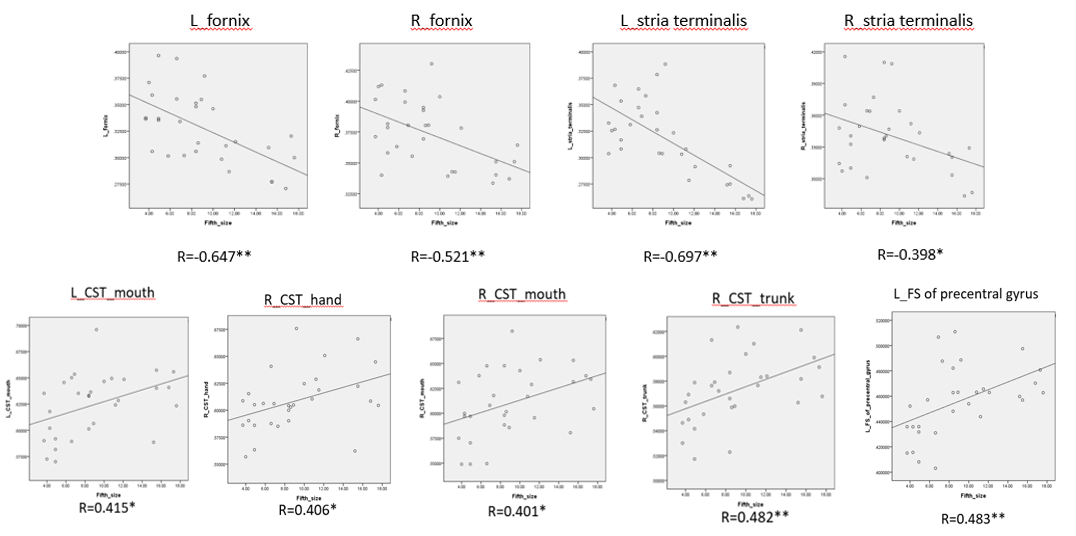
As compared with controls, the subjects with enlarged CSP showed significantly lower Dice coefficients in grey/white matter and CSF, but there was no significant difference in median and small CSP subjects. According to the GLM, nine tracts were significantly correlated with the size of the CSP, namely bilateral fornices, bilateral stria terminalis, right corticospinal tracts (CST) of the hand, right CST of the trunk, bilateral CST of the mouth and left frontostriatal tracts (FS) of the precentral gyrus. Among those tracts, bilateral fornices and bilateral stria terminalis showed significantly different GFA values between subjects with the CSP and those without the CSP (Figure 1). Furthermore, as the CSP size increased, the GFA value became lower (Figure 2).Discussion
In this study, we found that subjects with enlarged CSP showed significantly decreased GFA in bilateral fornices and bilateral stria terminalis. From the reconstructed tractography, we observed that the paths of the fornices and stria terminalis were deviated by the CSP. For the rest of the tracts, although they did not show obvious deviation by the CSP, their GFA values increased significantly. We conjectured that these white matter tracts are projection fibers in close proximity to the lateral ventricles, and so they might be compressed by the CSP, leading to the increase in GFA.Conclusion
Our findings imply that the existence of the CSP will lead to errors in image registration and diffusion measurement, and the size of the CSP affects the GFA values in the adjacent tracts. Therefore, we need to consider the size of the CSP as a covariate in statistical analysis. For the diffusion measurement along the tracts that pass by the CSP (i.e. bilateral fornix and bilateral stria terminalis), we suggest they should be excluded from the analysis if the CSP is larger than 10 mm.Acknowledgements
No acknowledgement found.References
1. Born, C.M., et al., The septum pellucidum and its variants - An MRI study. European Archives of Psychiatry and Clinical Neuroscience, 2004. 254(5): p. 295-302.
2. Chen, Y.J., et al., Automatic whole brain tract-based analysis using predefined tracts in a diffusion spectrum imaging template and an accurate registration strategy. Human Brain Mapping, 2015. 36(9): p. 3441-3458.
Figures