3144
Deciphering predictive models for differentiating vertebral lesions using multiparametric MRI1Radiodiagnosis, King George's Medical University, Lucknow, India, 2Division of Biostatistics & Epidemiology, Biomedical Sciences, Texas Tech University Health Sciences Center, El Paso, TX, United States, 3Neurosurgery, King George's Medical University, Lucknow, India
Synopsis
Conventional MR imaging has high sensitivity but limited specificity in differentiating various vertebral lesions. We aimed to assess the ability of multiparametric MR imaging in differentiating spinal vertebral lesions and to develop statistical models for predicting the probability of malignant vertebral lesions. On the basis of the mean ADC and signal intensity ratio, we established automated statistical models that would be helpful in differentiating vertebral lesions. Our study shows that multiparametric MRI differentiates various vertebral lesions, and we established prediction models for the same.
Introduction
Due to limited specificity of conventional MR, 1 radiologists often face trouble in differentiating between common spinal pathologies such as osteoporotic vertebral collapse, infectious spondylodiscitis and metastasis. Recently, multiparametric MRI (mpMRI) has shown the ability to localize, detect, and stage various diseases.2-5 The hypothesis for this study was that mpMRI approach would increase the discriminatory ability of different vertebral lesions. The purpose of the present study was to evaluate the ability of mpMRI in differentiating vertebral lesions and to establish statistical models for predicting the probability of malignant (GPM) lesions compared with noninfectious benign (GPN) and infectious (GPI) ones.Methods
The Institutional Ethics Committee approved this prospective cross-sectional study. Written informed consent was obtained from all patients prior to MR imaging. Between July 2011 and August 2015, we included all patients presenting consecutively with the vertebral lesion on mpMRI spine in form of vertebral erosion, destruction, collapse, fracture, and altered signal intensity with or without paraspinal soft tissue in absence of trauma followed by CT guided FNA/biopsy. As a result, a cohort of 126 patients was included in the analysis of this study. The MR investigations were carried out at 1.5T using a whole-body MR scanner (Signa Excite; GE Healthcare). All patients underwent MR examination of spine (T1W, T2W, STIR, contrast-enhanced MRI, DWI and in-phase/opposed-phase MRI). T1W images in axial (TR/TE = 500/11.7 ms, slice thickness = 4 mm) and in sagittal plane (TR/TE = 600/10.7 ms, slice thickness = 4 mm) were obtained. Phase sequences were obtained in the sagittal plane with the following parameters: in-phase (TR/TE = 118/5 ms; flip angle = 80°), opposed-phase (TR/TE = 118/2.5 ms; flip angle = 80°). A single-shot diffusion-weighted echo planar imaging (DW-EPI) pulse sequence was used to acquire DWI data in sagittal plane using b values of 0 and 600 s/mm2 and the ADC maps were generated. Contrast-enhanced imaging included non-fat-saturated T1W in axial and sagittal planes was obtained. The dosage of the Gadodiamide (Omniscan GE Healthcare, Ireland) contrast given was 0.1 mmol/kg body weight. Circular regions of interest (ROIs) were drawn on ADC and in-phase/opposed-phase images manually three times within the lesion and average of these values were calculated and used. CT-guided fine needle aspiration (FNA)/ biopsy (cytohistology / biopsy culture) were used as a reference standard test. A value of p < 0.05 was considered to be significant. All the statistical analyses were carried out using STATA 12.1Results
A total of 126 subjects (73 (57.9%) men, 53 women (42.1%); mean age 45.3 (SD: 15.2) years (range: 4 - 76 years)) were analyzed. Of the total, 49% (62/126) had infectious vertebral lesions, 18% (22/126) had non-infectious benign vertebral lesions, and 33% (42/126) had malignancy using the reference standard. The morphological and quantitative imaging of infectious and malignant lesions is shown in Figs. 1 and 2, respectively. The probability of malignant lesions in Model 1 can be obtained as exp(-10.50-5.67*ADC+18.35*SIR)/[1+exp(-10.50-5.67*ADC+18.35*SIR)]. Moreover, the probability of malignant lesions in Model 2 can be obtained using the equation, exp(-5.93-4.59*ADC+13.33* SIR)/ [1+ exp(-5.93-4.59*ADC+13.33*SIR)]. The probability of malignant lesions compared to all benign lesions in Model 3 can be estimated using the equation, exp(-8.25- 5.42*ADC + 15.27* SIR)/ [1+ exp(-8.25- 5.42*ADC + 15.27* SIR)]. The model validation on the test data (using leave-one-out method) showed AUC = 0.91 for model 1, AUC = 0.88 for model 2, and AUC = 0.90 for model 3 (Table 1). Model 1 can differentiate GPI and GPM lesions with a sensitivity of 80.9% and a specificity of 80.6% at the determined cut-off. Model 2 differentiates GPN and GPM lesions with a high sensitivity and specificity (83.3% and 82.8%, respectively). Model 3 differentiated malignant compared with all benign lesions with a sensitivity of 83.3% and specificity of 82.1%.Discussion
A major strength of this study was developing statistical models for malignant vertebral lesions using mpMRI and determining thresholds for different parameters of mpMRI, which have not been explored in earlier studies. Multivariate logistic regression analysis showed ADC and SIR as independent predictors of malignancy in vertebral lesions. Based on the mean ADC and SIR, we established automated statistical models which would be helpful in differentiating vertebral lesions. Various predictive models demonstrated excellent validation using leave-one-out analysis.Conclusion
Our study shows that mpMRI can differentiate various vertebral lesions. The prediction model established in this study using mpMRI can be used to assess the probability of malignancy in vertebral lesions that may help in accurate diagnosis and proper patient management.Acknowledgements
No acknowledgement found.References
1. Baur A, Stabler A, Arbogast S, Duerr HR, Bartl R, Reiser M. Acute osteoporotic and neoplastic vertebral compression fractures: fluid sign at MR imaging. Radiology 2002;225:730-735.
2. Dwivedi DK, Kumar R, Bora GS, et al. Stratification of the aggressiveness of prostate cancer using pre-biopsy multiparametric MRI (mpMRI). NMR Biomed 2016;29:232-238.
3. Kimura M, da Cruz LC, Jr. Multiparametric MR Imaging in the Assessment of Brain Tumors. Magn Reson Imaging Clin N Am 2016;24:87-122.
4. Rahbar H, Partridge SC. Multiparametric MR Imaging of Breast Cancer. Magn Reson Imaging Clin N Am 2016;24:223-238.
5. Ro SR, Asbach P, Siebert E, Bertelmann E, Hamm B, Erb-Eigner K. Characterization of orbital masses by multiparametric MRI. Eur J Radiol 2016;85:324-336.
Figures
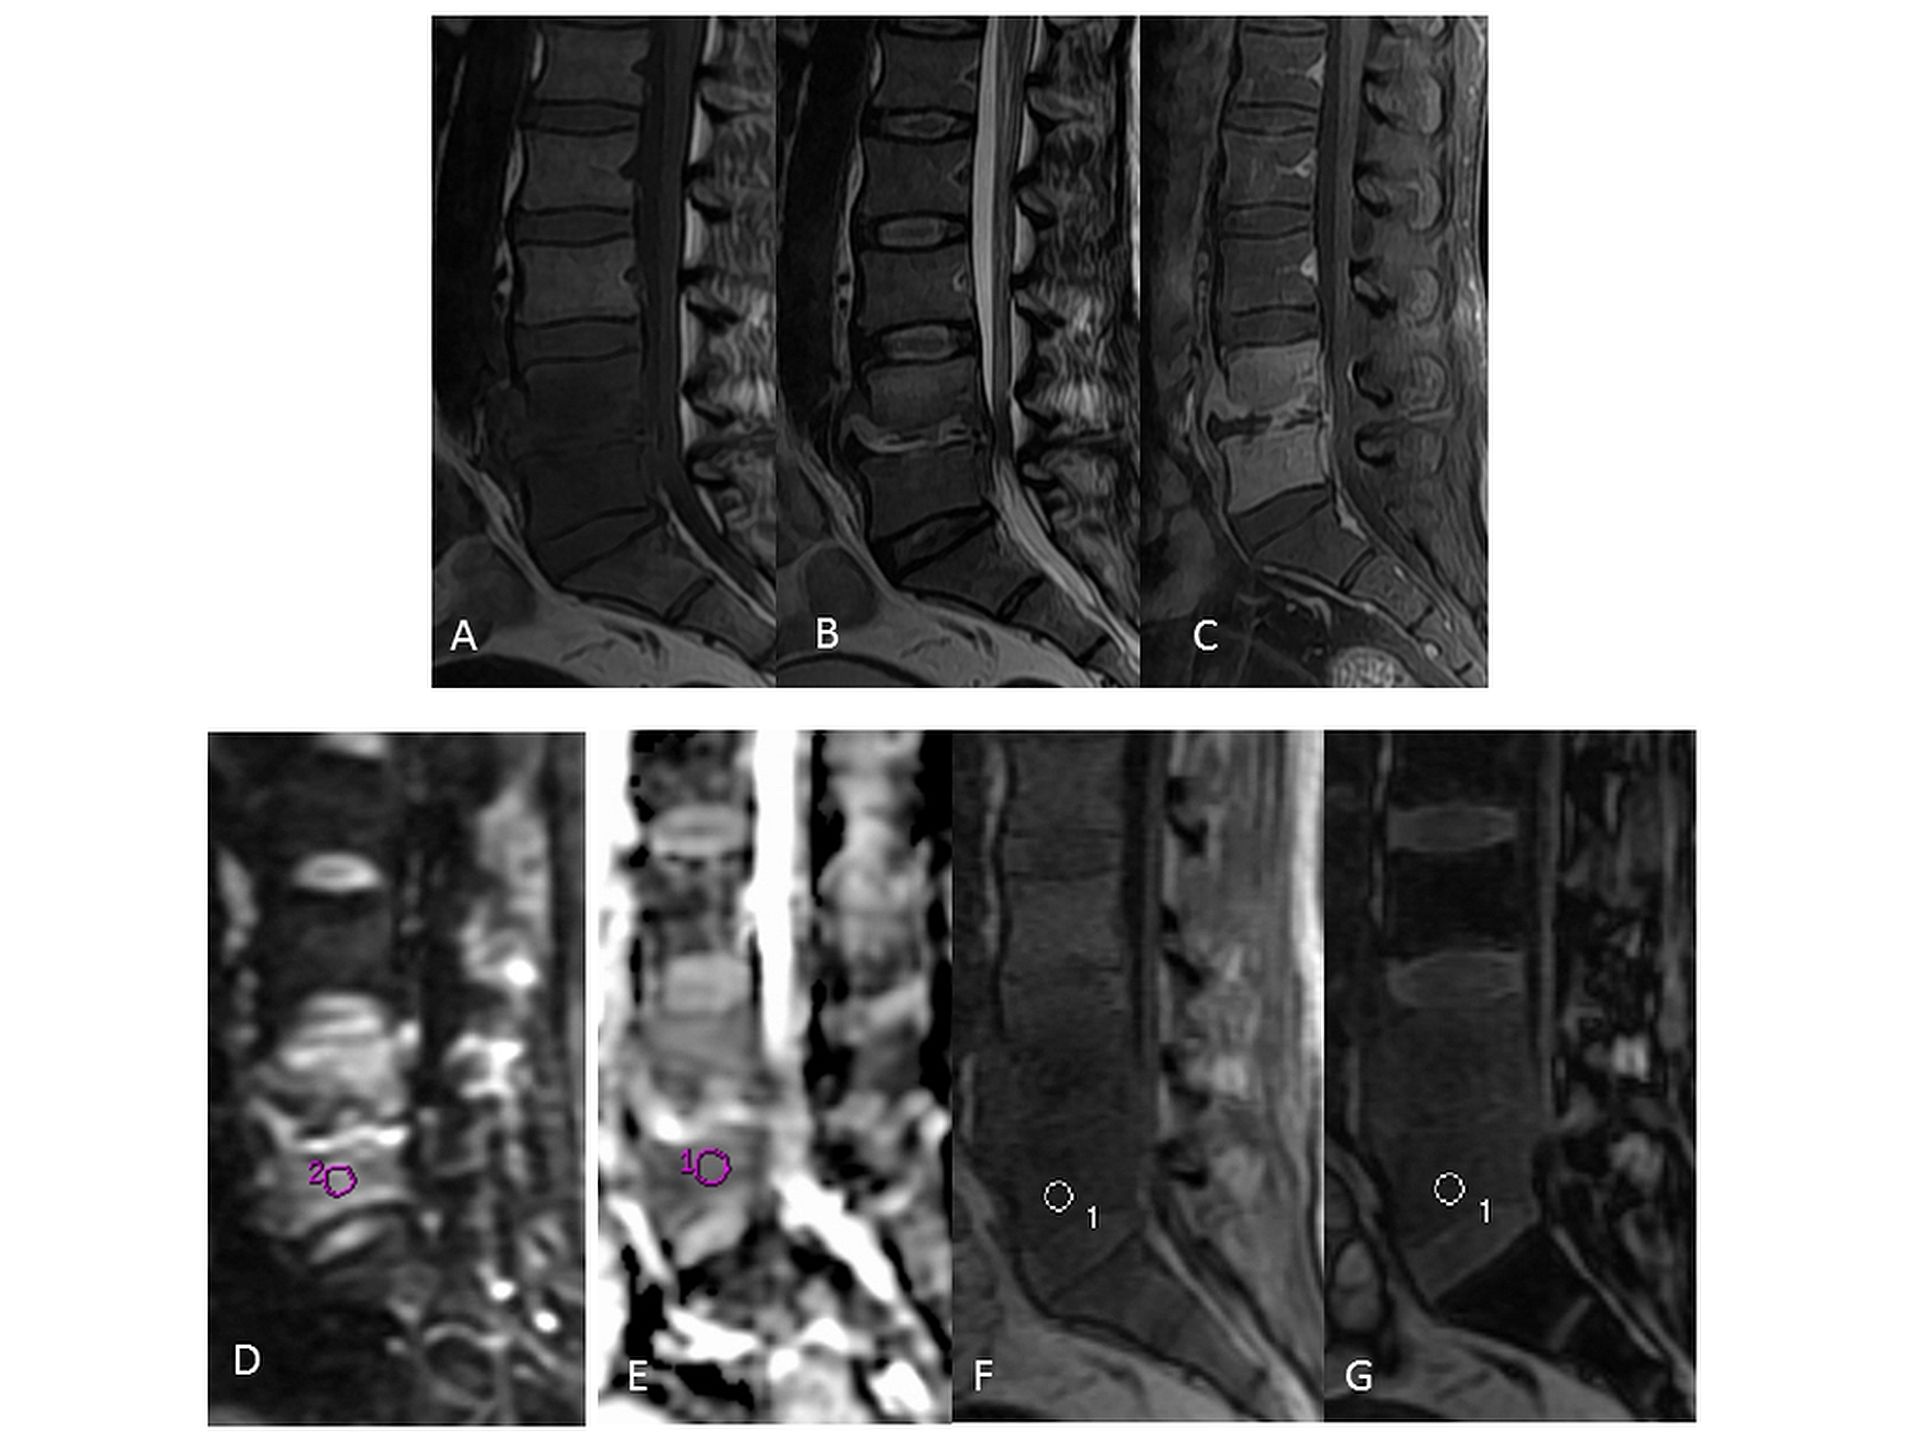
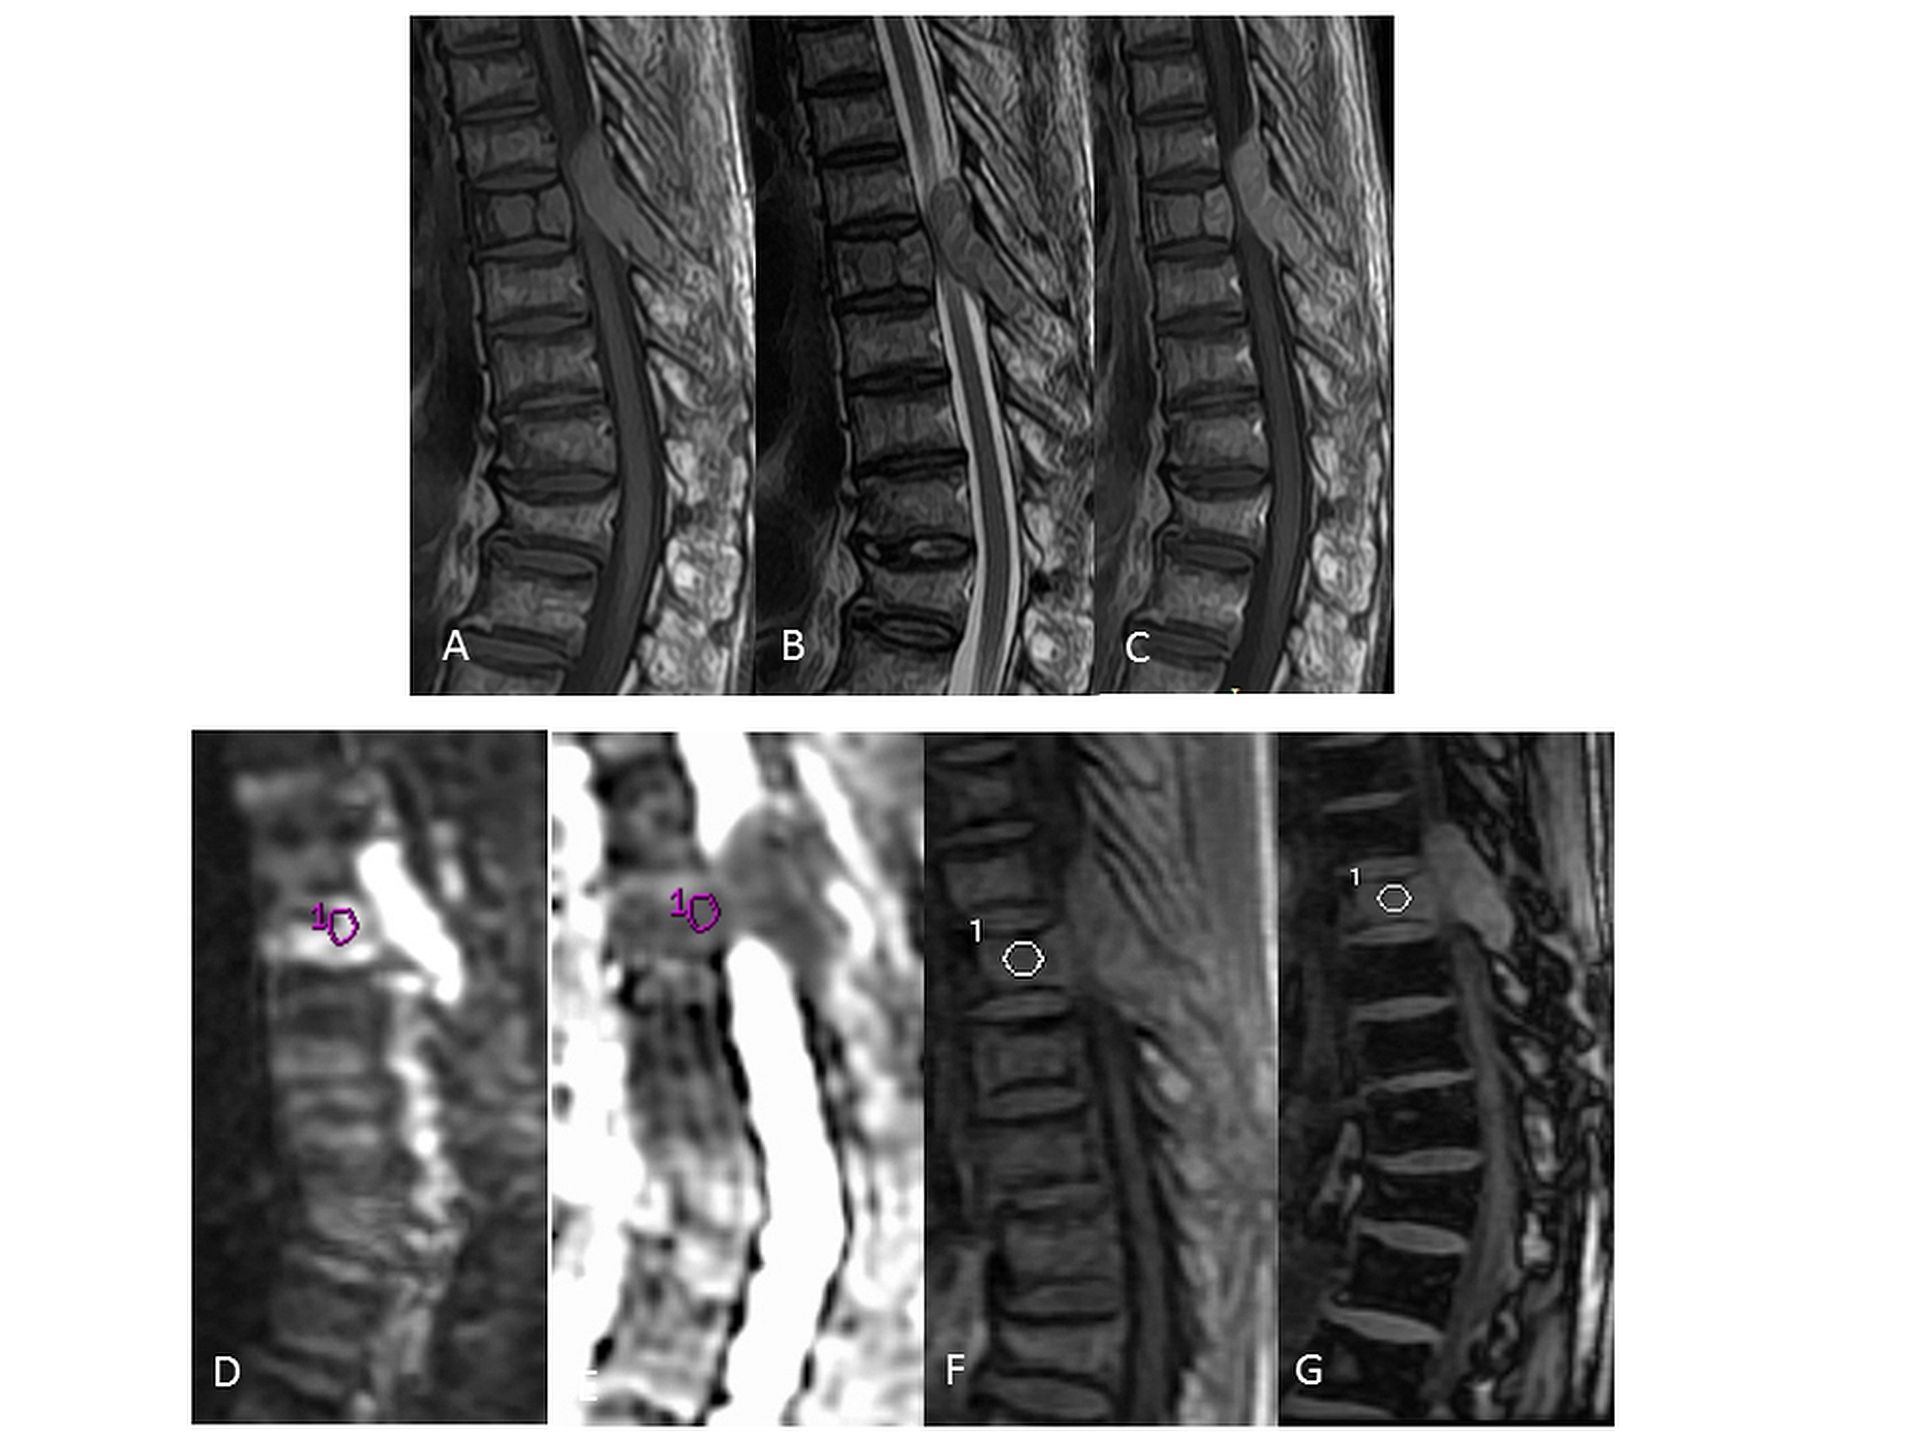
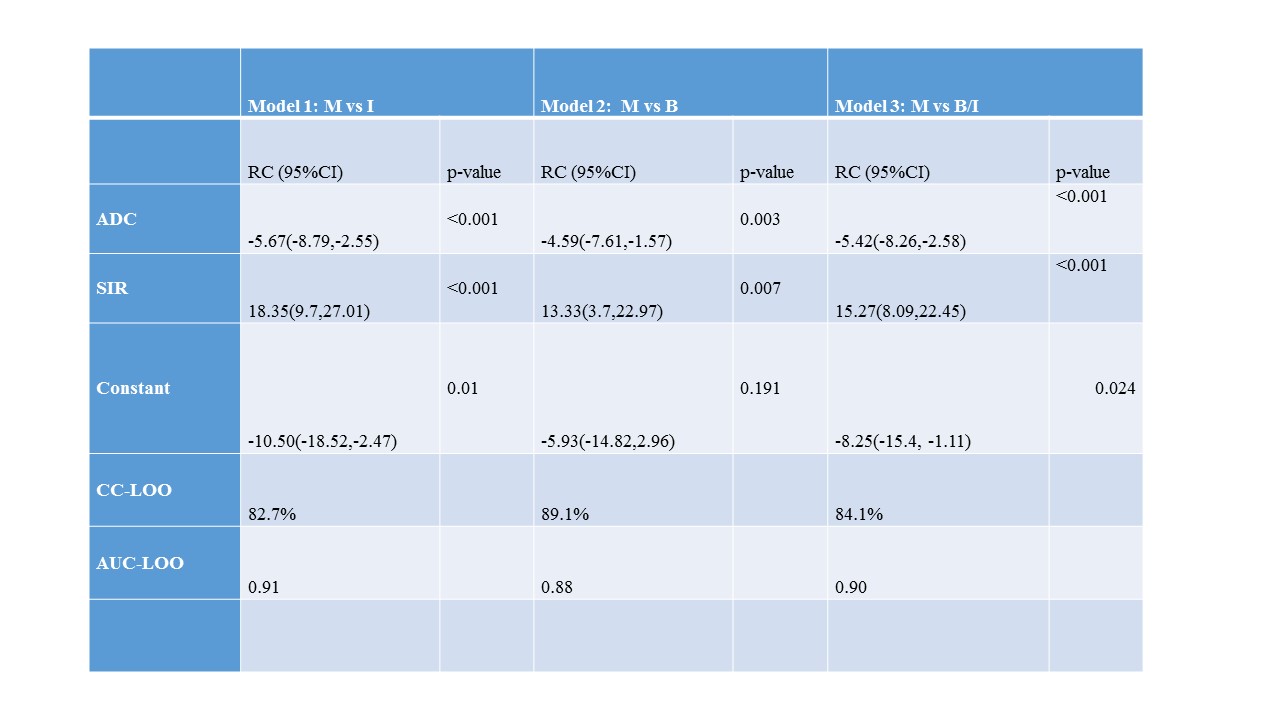
Table 1. Combined models for differentiating various groups.
ADC, apparent diffusion coefficient; SIR, signal intensity ratio; B, Non-infectious benign lesions; I: infectious lesions; M, malignant lesions; RC, regression coefficient; CI, confidence interval; CC-LOO, correct classification leave-one-out cross validation analysis; AUC-LOO, area under the curve on leave-one-out cross validation analysis.