3142
Deep Learning approach for Automatic Segmentation and characterization of Traumatic Brain Injury using Multi-parametric MRI1Laboratory of Molecular Imaging, Singapore Bioimaging Consortium, Singapore, Singapore, 2Queensland Brain Institute, The University of Queensland, Brisbane, Australia
Synopsis
Automatic and accurate segmentation of Traumatic brain injury is vital to
improve assessment of pathophysiology, plan treatment methods and enable large
cohort studies. In this work we propose a framework based on 3D CNN and FCM to
perform automatic segmentation of whole TBI volume and its sub-regions. The
proposed framework utilizes multiple MRI contrasts and has shown high accuracy
in delineating injury and sub-regions

Purpose
Accurate quantitative delineation of whole Traumatic Brain Injury (TBI) volume and its tissue types is of paramount importance in assessing physiological changes over time, planning treatment measures, and to assess response to clinical interventions. Manual segmentation of injury regions in 3D image volumes is highly laborious especially in large cohort studies involving multiple contrasts and is prone to errors due to inter-observer bias. In this study we present a Deep Learning and Clustering framework based on DeepMedic1, 3D-CNN model and FCM2 for accurate Injury volume segmentation and estimation of sub-component tissue types from T1w, T2w and MPRAGE MRI data of Rat TBI Models.Materials and Methods
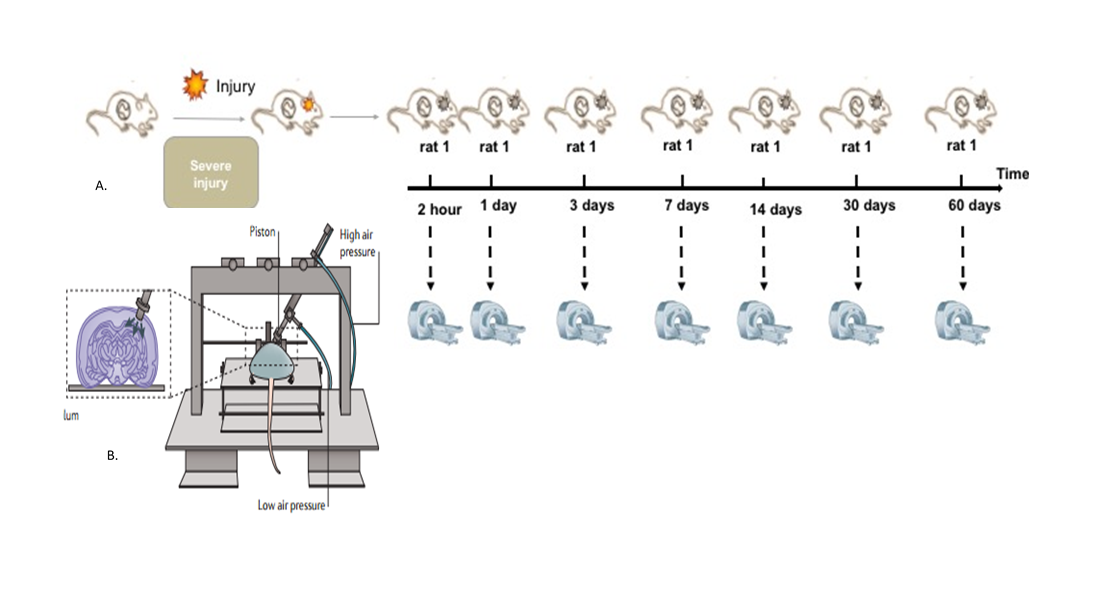
Eight adult male Sprague-Dawley rats were scanned 7 times including 2hours, 1-day, 3-days, 7-days, 14-days, 30-days and 60-days post injury (Fig-1A). Details of experimental setup for controlled cortical impact are provided in figure-1B. All experiments were approved by the University of Queensland animal ethics committee. MRI images were acquired using a Bruker Biospec 9.4T (BioSpec 94/30USR) with 4 elements-array coil. Animals were scanned after the injury using T2-weighted image, T1-Mprage, and T1-Flash at different time-points (Fig.1A). Axial T2w (RARE) data were acquired using FOV/slice-thickness/matrix size/TR/TE/RARE-factor/NA = 32mm×25mm/0.5mm/56×256×40/5900ms/65ms/8/2. Axial T1-Flash data were acquired using FOV/slice-thickness/matrix-size/TR/TE/NA = 25.6mm×25.6mm/0.9mm/256×256×20/255ms/4ms/3. Coronal T1-MPRAGE data were acquired using MDEFT, with 4 segments, FOV/slice-thickness/matrix-size/TR/TE/NA = 25.6mm×25.6mm/0.3mm/256×256×60/4000ms/3ms/3. Image volumes were reoriented to have consistent orientations. FSL was used to extract brain (BET3) and to perform bias field correction4. All images were resampled to 0.1x0.1x0.9 mm and co-registered linearly using FLIRT 5,6.
3D CNN Model Parameters and Datasets
The study included two training sessions with similar network configuration. Model-1 to identify whole TBI region from background followed by Model-2 to identify the sub-regions within the injury.
Model Configuration: Number of epochs = 40, Number of sub-epochs = 10, Number of cases loaded per sub-epoch = 25, Size of input image segments = [25, 25, 25], No of convolutional layers = 8, No of feature maps subsampled per layer = [20, 20, 30, 30, 30, 30, 40, 40], Batch size = 20.
Datasets for automatic TBI region extraction from background: A total of 52 image volumes (26 T1w, 26 T2w) were used for training. Test data included 14 image volumes (7 T1w, and 7 T2w). Manually drawn ROIs for TBI injury region were used as ground-truth. Training took close to 16 hours on CPU (Intel® Core™ i7-6700 CPU @ 3.4GHz).
Datasets for automatic labelling of injury sub-regions: Training images included 25 T1w, 25 T2w and 25 MPRAGE images. Test Data included 12 image volumes (T1w, T2w, MPRAGE; 4 volumes / contrast). Ground-truth of sub-regions within the injury were outlined by performing FCM2 of total population of injury voxels from T1w, T2w and MPRAGE volumes of all animals for all time points in to four classes. Cluster centres and their distributions were used to highlight individual tissue subtypes in each animal.
All images were pre-processed to zero mean and unit variance before training. Training/testing accuracy metrics like accuracy, sensitivity and specificity were captured during respective processes. Dice Similarity Coefficients (DSC) of whole TBI region (Model-1) and sub-regions within TBI region (Model-2) were calculated versus ground-truth volumes to evaluate testing accuracy.
Results
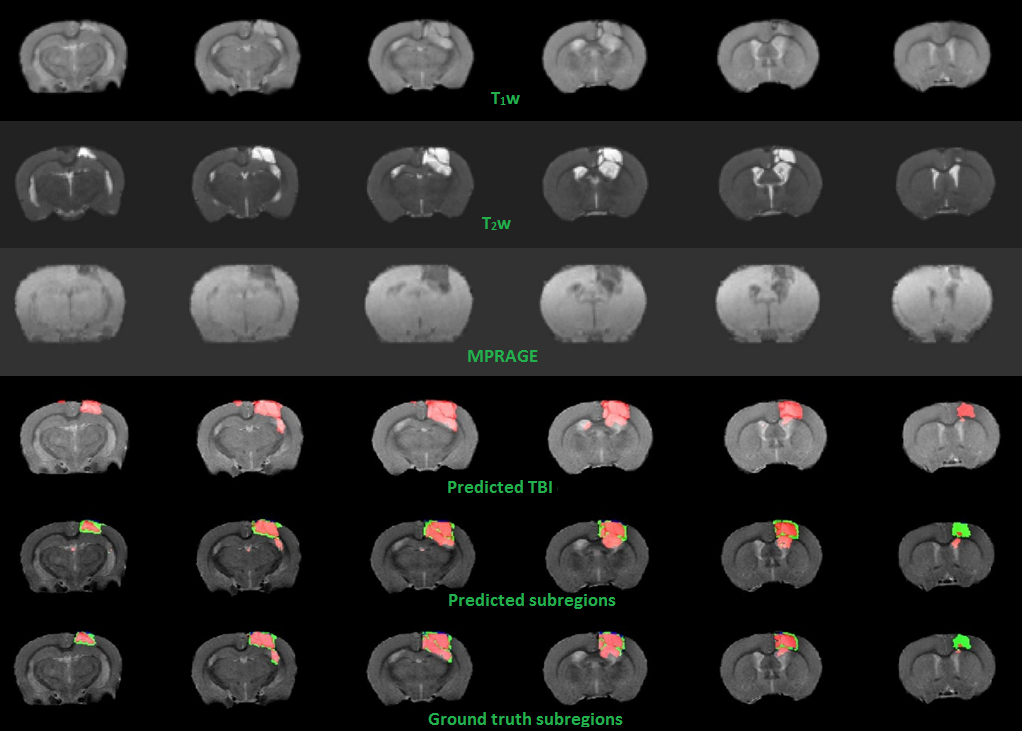
3D-CNN training performance of model-1 and model-2 are plotted against epochs in terms of sensitivity, specificity, mean accuracy and DSC in figure-2. Testing accuracy metrics, DSC of model-1 & 2 are reported in figure-3. Individual DSC were calculated for each class comparing predicted class volumes and their corresponding ground-truth. Testing samples did not have any class-3 voxels in their ground-truth. Figure-4 highlights montages of an example illustrating T1w, T2w and MPRAGE contrasts along with predicted injury regions of both models and ground-truth labels.Discussion
Multi-contrast MR (T1w, T2w and MPRAGE) for segmentation resulted in higher accuracy than individual contrasts alone as different contrasts provided complementary structural information. Additionally different contrasts resolved ambiguities in identifying the sub-regions of injury accurately which has resulted in high dice similarity coefficients. The proposed framework is useful for automatic and accurate segmentation of injury and its sub-regions, monitoring the temporal changes in injury, changes due to interventions and to understand the underlying process of traumatic brain injury and its recovery. Future work includes training/ testing on more datasets and validating the sub-regions for their physiological relevance in terms of pathology.Conclusion
The proposed framework automatically segmented whole TBI regions and sub-regions from background with high accuracy thus reducing the manual labor as well as eliminating the associated inter-operator bias.Acknowledgements
Agency for Science, Technology and Research, Singapore
Queensland Brain Institute, The University of Queensland, Australia
References
1. Kamnitsas, Konstantinos, et al. "DeepMedic for Brain Tumor Segmentation." International Workshop on Brainlesion: Glioma, Multiple Sclerosis, Stroke and Traumatic Brain Injuries. Springer, Cham, 2016.
2. Bezdek, James C., Robert Ehrlich, and William Full. "FCM: The fuzzy c-means clustering algorithm." Computers & Geosciences 10.2-3 (1984): 191-203.
3. Smith SM. Fast robust automated brain extraction. Hum Brain Mapp. 2002;17: 143–155. doi:10.1002/hbm.10062
4. Tustison NJ, Avants BB. Explicit B-spline regularization in diffeomorphic image registration. Front Neuroinform. 2013;7. doi:10.3389/fninf.2013.00039
5. Jenkinson M, Bannister P, Brady M, Smith S. Improved optimization for the robust and accurate linear registration and motion correction of brain images. Neuroimage. 2002;17: 825–841. doi:10.1016/S1053-8119(02)91132-8
6. Jenkinson M, Smith S. A global optimisation method for robust affine registration of brain images. Med Image Anal. 2001;5: 143–156. doi:10.1016/S1361-8415(01)00036-6
Figures