3140
Automated MR-based volumetry of basal ganglia and thalamus at the chronic phase of cortical stroke1Department of Diagnostic and Interventional Radiology, Lausanne University Hospital, Lausanne, Switzerland, 2Advanced Clinical Imaging Technology, Siemens Healthcare AG, Lausanne, Switzerland, 3Signal Processing Laboratory (LTS 5), École Polytechnique Fédérale de Lausanne (EPFL), Lausanne, Switzerland
Synopsis
We investigated the potential of automated T1-MPRAGE-based brain segmentation to assess individual basal ganglia and thalamus atrophy in nineteen patients with cortical stroke at the chronic phase. The basal ganglia and thalamus volumes z-scores were compared to the initial stroke ipsilateraly and contralateraly, and the relationship with the stroke volume was assessed. Except caudate nucleus, basal ganglia and thalamus, atrophy ipsilateraly to the stroke was observed and negatively correlated with the stroke volume in the territory of the middle cerebral artery. This suggests a potential role for automated MRI volumetry to assess brain plasticity after stroke at the individual level.
Introduction
Brain volumetric changes, including basal ganglia and thalamus volumetric changes, may reflect plasticity after cortical stroke [1,2]. We aimed at assessing the potential of automated MR-based brain morphometry to assess individual basal ganglia and thalamus volumetric changes at the chronic phase after cortical stroke.Methods
Nineteen patients (mean age: 68±21 years, male: 9) with cortical stroke at the chronic phase were retrospectively included. All patients were scanned at 3T (MAGNETOM Skyra, Prisma, Verio; all Siemens Healthcare, Erlangen, Germany) using a T1-MPRAGE sequence [4,5]. Resulting 3D images were processed with the MorphoBox prototype [3] to automatically segment basal ganglia (caudate nucleus, putamen, pallidum) and thalamus structures. Deviations from reference range of resulting volume estimates normalized by total intracranial volume were assessed by z-scores. Reference ranges were calibrated on the respective healthy volumes estimated by MorphoBox (N=306 controls scanned with same MPRAGE, 66.4±19yo, age range: 19-90 years, 49% healthy female subjects) using a log-linear regression model taking into account the confounding effects of age and gender. Basal ganglia and thalamus were also classified according to the following 3-point scale: atrophic (volume<10th percentile), normal (>10th and <90th percentile) or hypertrophic (volume> 90th percentile). For each patient, stroke volume in mL was estimated by manual delineation on T2 SE imaging. Z-scores and trophicity scores were compared between ipsi- and contralateral stroke side and according to the vascular territory (middle cerebral artery [MCA] versus non-MCA) with the Wilcoxon signed-rank test and Fisher exact test, respectively. Potential relationship between basal ganglia and thalamus volume z-scores and stroke volume was assessed using the Spearman correlation coefficient.Results
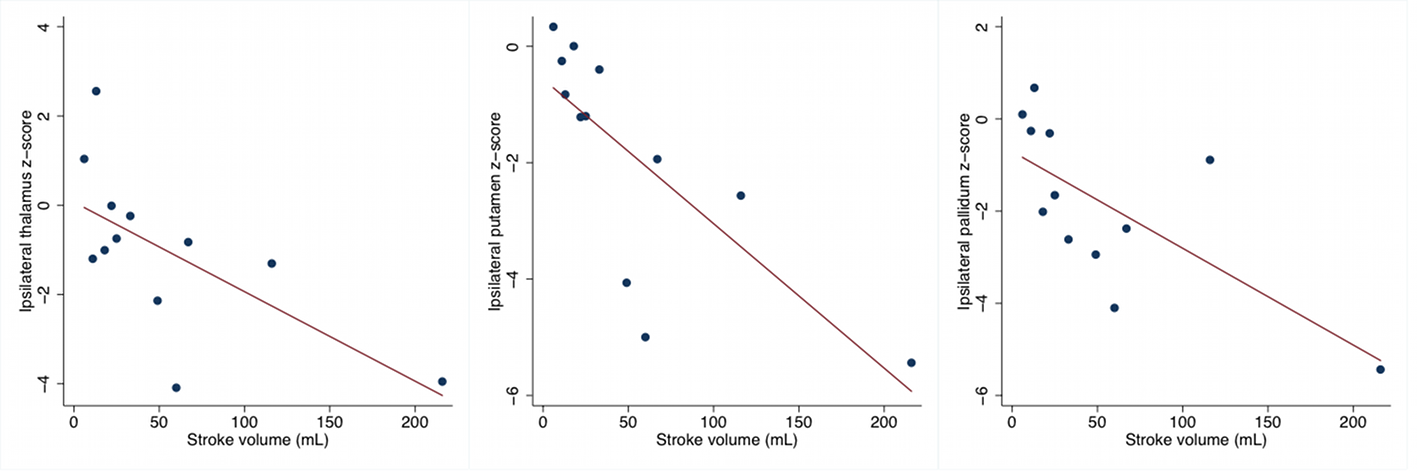
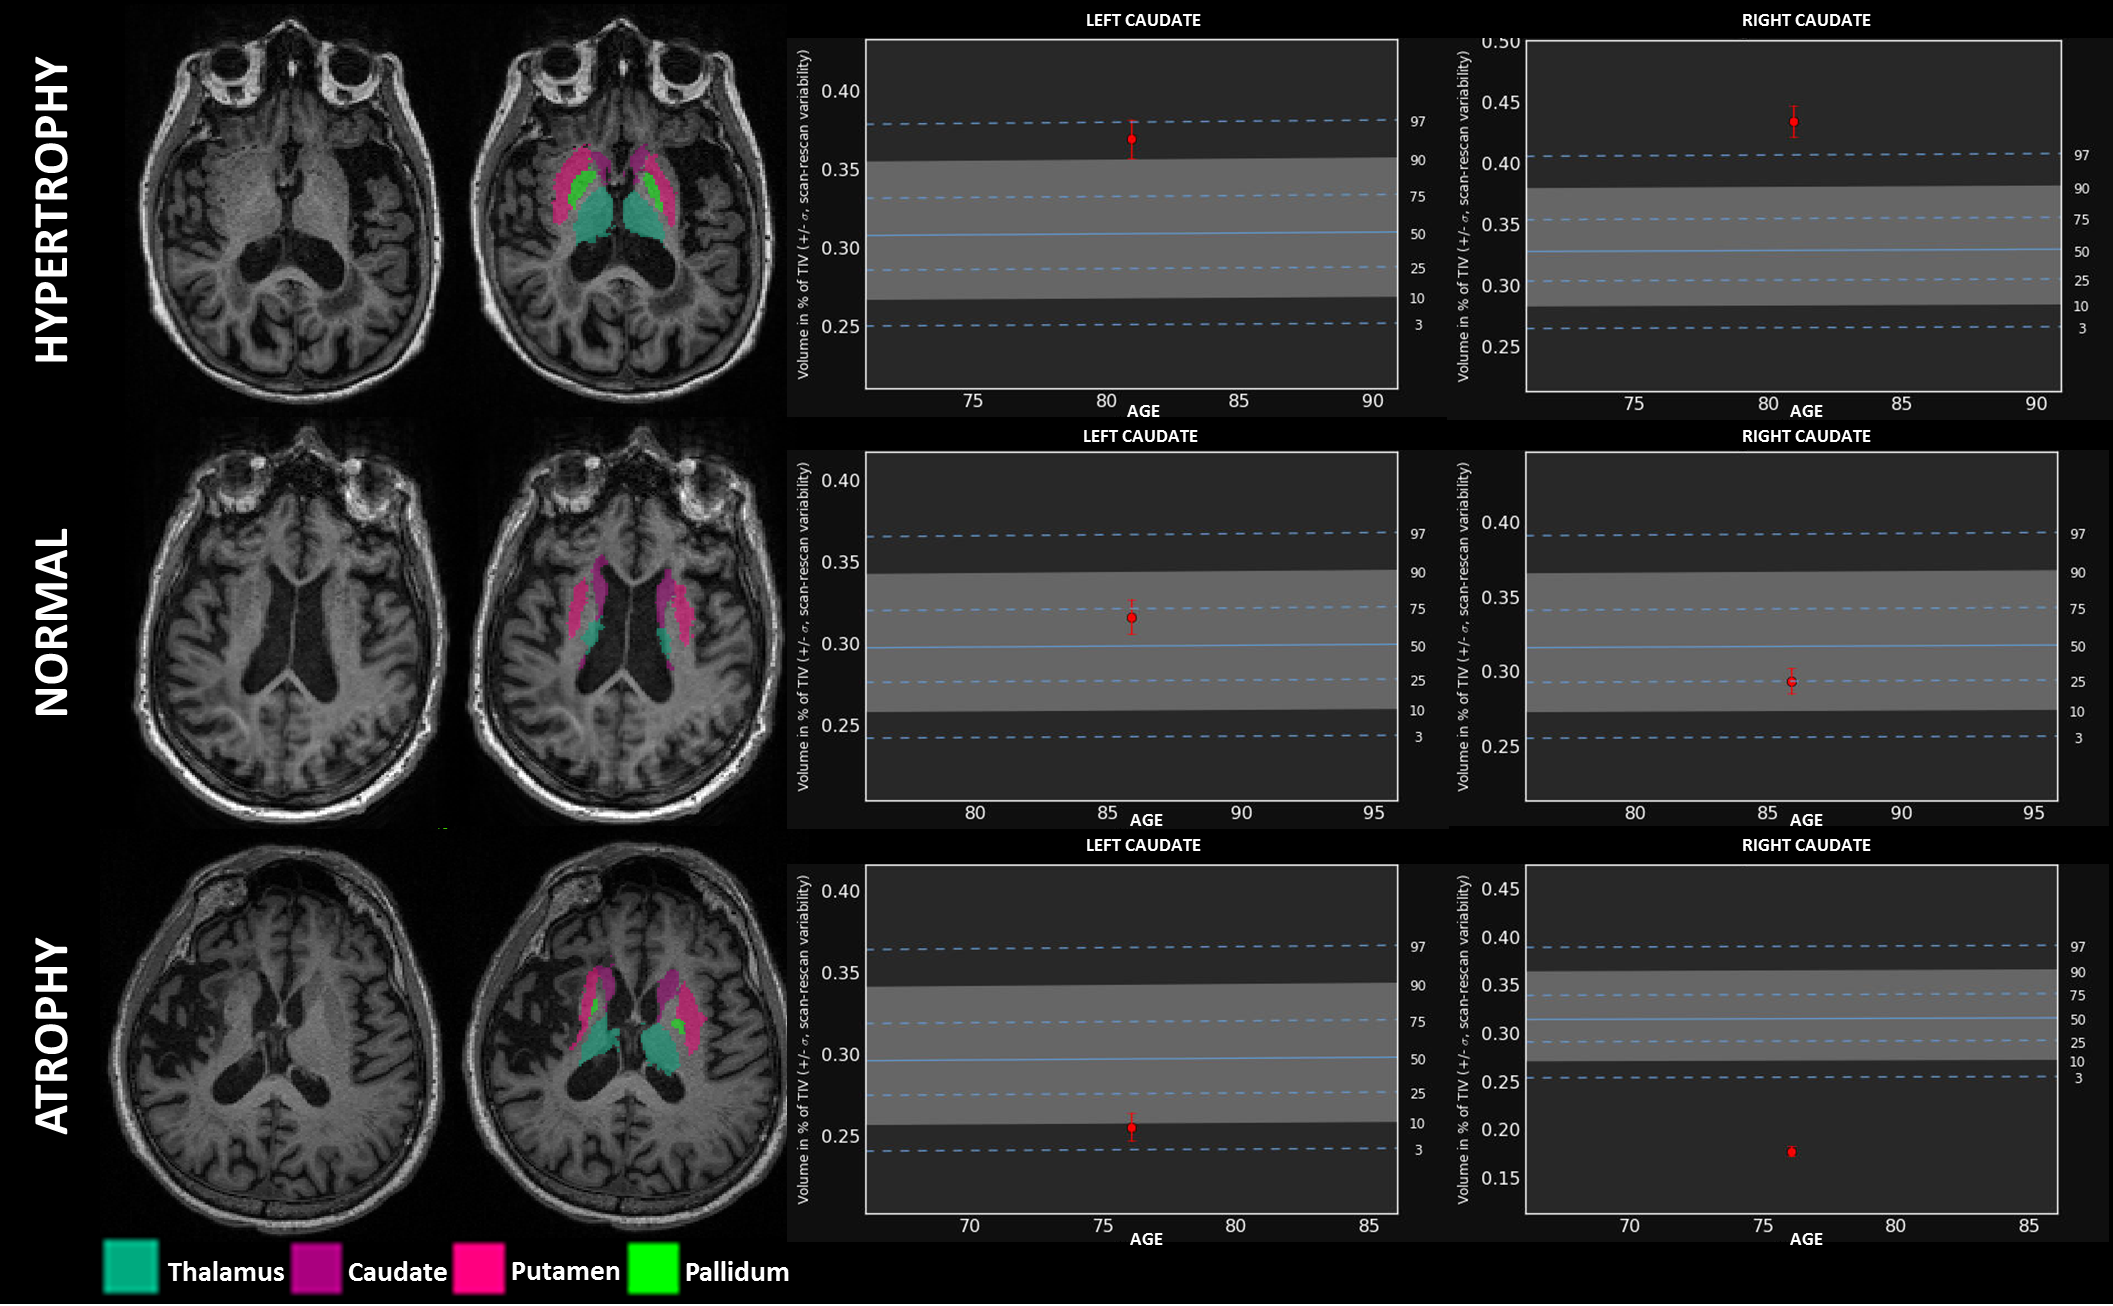
Eight patients had left-sided and eleven right-sided stroke. Twelve patients had MCA territory stroke and seven had non-MCA territory stroke. The mean stroke volume was 65±84 mL. Putamen, pallidum and thalamus volume z-scores were lower ipsilaterally to MCA territory stroke (all p-value<0.05) while caudate nucleus volume z-scores were not different between ipsi- and contralateral stroke sides regardless of the stroke vascular territory (all p-values >0.31). In MCA territory stroke, ipsilateral putamen, pallidum and thalamus volume z-scores negatively correlated with the cortical stroke volume (Figure 1) while there was no significant correlation in case of non-MCA stroke (all p>0.12). Left (p=0.023) and right (p=0.01) caudate nucleus hypertrophy was interestingly found more frequently in left-sided stroke than in right-sided stroke but did not correlate with stroke volume (see examples of patients with hypertrophic, normal and atrophic caudate nucleus in Figure 2).Discussion and conclusion
Automated MRI segmentation demonstrated putamen, pallidum and thalamus but not caudate nucleus atrophy at the chronic phase following ipsilateral cerebral infarction in the territory of the MCA. These results confirmed remote changes of basal ganglia after cortical stroke [1,2,6,7], which were negatively correlated with the stroke volume. At the patient level, automated MRI segmentation could thus help improving characterization of brain plasticity after cortical stroke and management of motor and cognitive decline relative to basal ganglia atrophy [7,8].Acknowledgements
No acknowledgement found.References
[1] Abela E, Seiler A, Missimer JH et al. Grey matter volumetric changes related to recovery from hand paresis after cortical sensorimotor stroke. Brain Struc Funct. 2015;220(5):2533-50
[2] Yang M, Yang Yr, Li Hj et al. Combining diffusion tensor imaging and gray matter volumetry to investigate motor functioning in chronic stroke. PloS One 2015;10(5):e0125038
[3] Schmitter D, Roche A, Marechal B et al. An evaluation of volume-based morphometry for prediction of mild cognitive impairment and Alzheimer’s disease. Neuroimage Clin. 2014; 7:7-17
[4] http://adni.loni.usc.edu/methods/documents/mri-protocols/
[5] Jack CR Jr, Bernstein MA, Fox NC et al., « The Alzheimer’s disease neuroimaging initiative (ADNI) : MRI methods. Journal of Magnetic Resonance Imaging 2008;27(4):685-691
[6] Tamura A, Tahira Y, Nagashima et al. Thalamic atrophy following cerebral infarction in the territory of the middle cerebral artery. Stroke 1991;22:615-618
[7] Lopes MA, Firbank MJ, Widdrington M et al. Post-stroke dementia: the contribution of thalamus and basal ganglia changes. Int Psychogeriatr 2012;24(4):568-76
[8] Cho H, Kim JH, Kim C et al. Shape changes of the basal ganglia and thalamus in Alzheimer disease: a three-year longitudinal study. J Alzheimer 2014;40(2):285-95
Figures