3138
Quantitative Assessment of the Intracranial Vasculature of an Elderly Population using the intraCranial Artery Feature Extraction (iCafe) Technique1Electrical Engineering, University of Washington, Seattle, WA, United States, 2Neurology, Xuanwu hospital, Capital Medical University, Beijing, China, 3Radiology, University of Washington, Seattle, WA, United States, 4Wellesley College, Wellesley, MA, United States, 5Biomedical Engineering, Tsinghua University, Beijing, China
Synopsis
iCafe is a novel technique which semi-automatically traces intracranial arteries from 3D magnetic resonance angiography (MRA) and computes corresponding quantitative morphometry and intensity features. MRA images of 100 healthy subjects (age 57-85) were processed and 8 representative features were extracted. We found significant decreases in total artery length (p=0.026), distal artery length (p=0.025), and number of branches (p=0.005) with increasing age using linear regression. These results suggest reduced vascularity with age, consistent with prior results showing cerebral blood flow with age. iCafe may be a useful tool to generalize systemic quantitative measurements of intracranial vascular structures.
INTRODUCTION
A healthy cerebrovascular system delivers sufficient blood flow to each brain territory, which is of vital importance for maintaining brain health and cognitive functions. Unsurprisingly, aging has been shown to lead to significant change to cerebral flow 1–3. Previous studies have identified microvascular and large artery changes associated with aging, including decreased microvascular density 4, loss of microvascular plasticity 5, progressive luminal dilation 6, and alterations in smooth muscle cells of large arteries 1.
Recently, an intraCranial artery feature extraction technique (iCafe) 7 has been developed. With iCafe, comprehensive morphometry and intensity features for each artery and vascular group visible from 3D time-of-flight (TOF) magnetic resonance angiography (MRA) can be quantified. With accurate quantification of the full intracranial vascular map, we demonstrate a new approach to evaluating cerebrovascular structure and flow based on arteries visualized on MRA.
In this study, we applied iCafe to a cohort of healthy subjects and assessed features from all the intracranial MRA images. Morphometry and intensity features extracted from iCafe were evaluated in relation to subject age.
METHODS
Patient studies
The dataset was consisted of 100 subjects (age 71±7 years, 49 males) with no cardiovascular symptoms within 6 months before MR imaging. Subjects who had severe consciousness disturbance (coma) and contraindications to MR imaging were excluded. 3D TOF images were scanned on a 3.0T Philips MR scanners (Achieva TX, Best, The Netherlands). Imaging parameters of TOF MRA were as follows: TR/TE = 25/3.5 ms, flip angle = 20°, in-plane resolution = 0.35 mm×0.35 mm, slice thickness = 1.4 mm, matrix = 376*277. The study followed local IRB guidelines and informed consent was obtained for all patients prior to enrollment.
Feature extraction
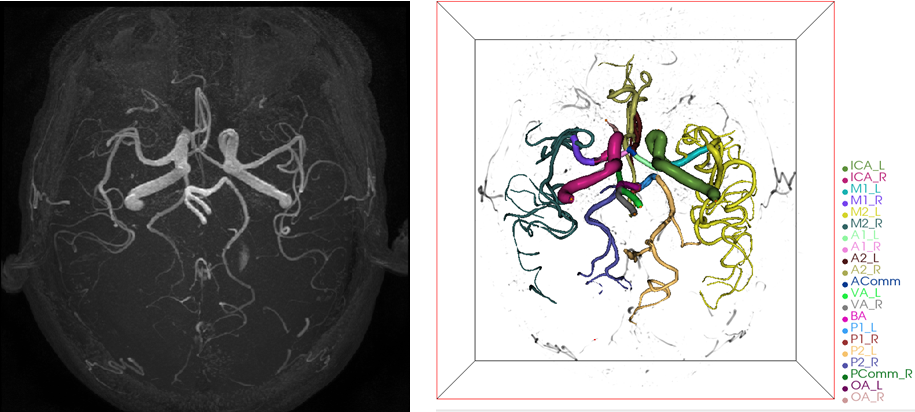
TOF images were resampled to isotropic resolution of 0.35 mm in 3D space and image intensities were normalized using the Nyul 8 method to allow comparable intensity features from different cases in dataset. Artery regions were then traced using an improved open-curve active contour model, and labeled using a Maximum a Posteriori model in iCafe. Artery traces from one subject are shown in Figure 1. An experienced neuro-radiologist supervised the tracing and labeling process and made corrections when needed. The dataset was shuffled in age to avoid bias during human interventions.
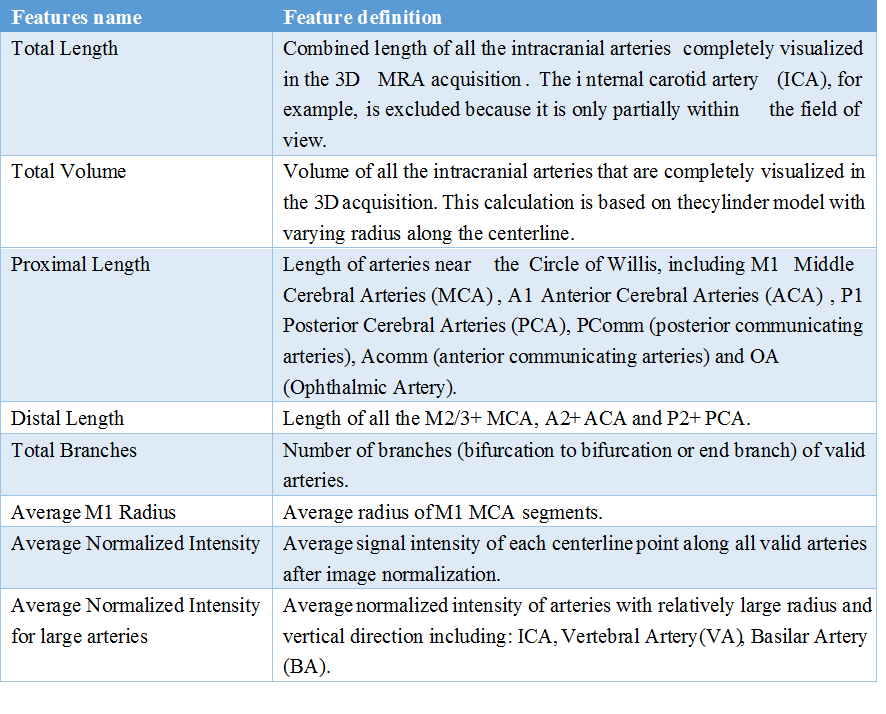
A group of 8 features (listed in Table 1) reflecting typical characteristics in each category was selected and used for analysis.
Statistical Testing
A linear regression model was used to assess the relation of each feature with age (gender adjusted). Pearson product-moment correlation coefficient (PPMCC) was calculated to measure the strength of linear association between features and age. P<0.05 was considered as statistically significant without adjustment for the number of comparisons. R (version 3.4.2) was used for the statistical analysis.
RESULTS
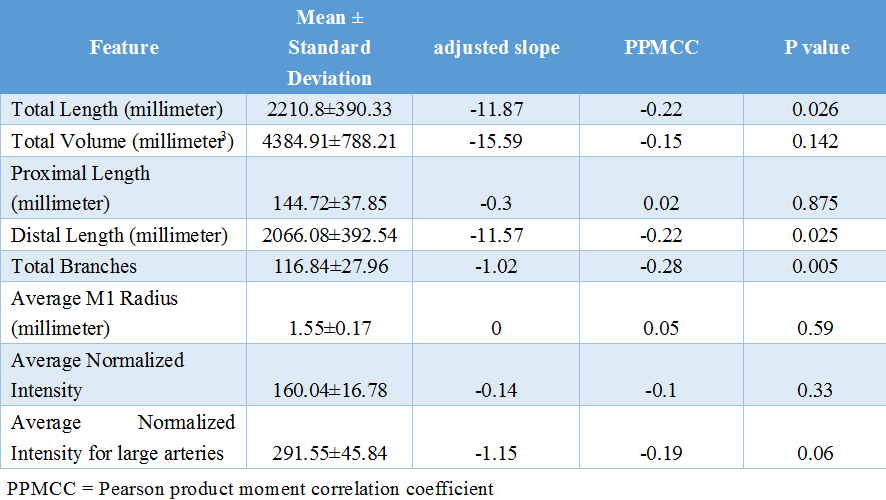
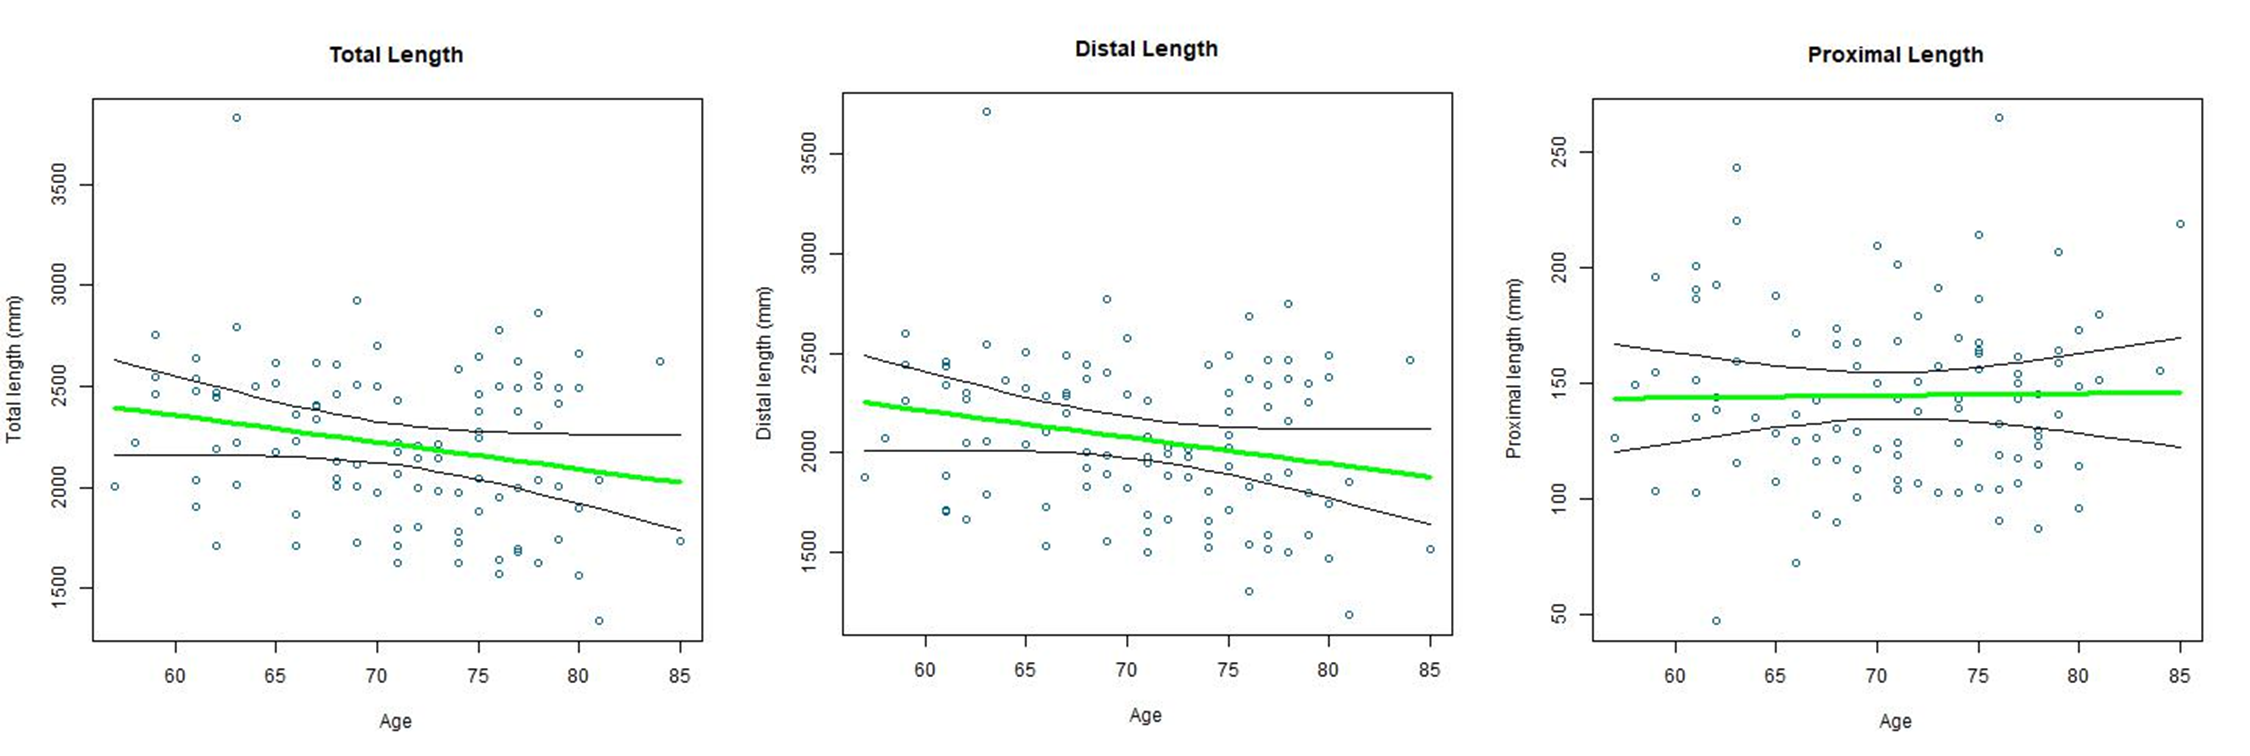
Morphometry and intensity association with age is shown in Table 2. We found there was a significant decrease of total artery length with increasing aging (PPMCC=-0.22, p=0.026). Further dividing the arteries into proximal and distal subgroups, we found the length from distal branches decreased significantly with increasing age (p=0.025), while the length of proximal branches was not (p=0.875). This suggests the association between total artery length and age was driven mostly by the length of the distal branches. The total number of branches also decreased with age (p=0.005) due to the correlation with total length (PPMCC=0.83). We did not find significant relations from other 5 tested features with age. The plot of length of subjects is shown in Figure 2.DISCUSSION
This is a cross-sectional study focusing on the associations between vascular features and age from the perspective of morphometry and signal intensity of both large and small arteries. The quantitative information provides a comprehensive description of intracranial status. We used a human operator to verify and correct iCafe artery tracings prior to automated measurement, as small arteries in particular may be incorrectly connected due to the relatively weak signal intensity within those arteries. The relatively long processing time (30-60 minutes per subject) might be a limitation. Further improvement of iCafe is ongoing to reduce human input.CONCLUSION
In a large number of subjects (N=100) we found a significant decreasing trend in length (particularly distal branches) and number of intracranial artery branches. This suggests that reduced vascularity with aging and is reflected as reduced visibility of distal branches on MRA. ICafe is used as a new approach in analyzing cerebral vasculature health and may provide useful insights for further research on structural and flow-related changes with aging.Acknowledgements
This research is supported by grants from the National Natural Science Foundation of China (81771825) and Philips Healthcare.References
1. Kalaria RN. Cerebral vessels in ageing and Alzheimer’s disease. Pharmacol Ther. 1996;72(3):193-214. doi:10.1016/S0163-7258(96)00116-7.
2. Kety S. Human Blood flow and oxygen consumption as related to aging. J Chronic Dis. 1955;3(5):478-486. doi:10.1097/00004647-200009000-00001.
3. Scheinberg P, Blackburn I, Rich M, Saslaw M. Effects of aging on cerebral circulation and metabolism. AMA Arch Neurol Psychiatry. 1953;70(1):77-85. doi:10.1001/archneurpsyc.1953.02320310083007.
4. Brown WR, Thore CR. Review: Cerebral microvascular pathology in ageing and neurodegeneration. Neuropathol Appl Neurobiol. 2011;37(1):56-74. doi:10.1111/j.1365-2990.2010.01139.x.
5. Riddle DR, Sonntag WE, Lichtenwalner RJ. Microvascular plasticity in aging. Ageing Res Rev. 2003;2(2):149-168. doi:10.1016/S1568-1637(02)00064-8.
6. Gutierrez J, Honig L, Elkind MSV, et al. Brain arterial aging and its relationship to Alzheimer dementia. Neurology. 2016;86(16):1507-1515. doi:10.1212/WNL.0000000000002590.
7. Chen L, Mossa-Basha M, Balu N, et al. Development of a quantitative intracranial vascular features extraction tool on 3DMRA using semiautomated open-curve active contour vessel tracing. Magn Reson Med. 2017. doi:10.1002/mrm.26961.
8. Nyul LG, Udupa JK, Zhang X. New variants of a method of MRI scale standardization. IEEE Trans Med Imaging. 2000;19(2):143-150. doi:10.1109/42.836373.
Figures