3137
Spatio-temporal features of brain's iron accumulation across the life span.1ICM - Institut du Cerveau et de la Moelle épinière, Hôpital de la Salpêtrière, Paris, France, 2Institute of Psychiatry, Psychology and Neuroscience, King's College London, London, United Kingdom, 3Wellcome Trust Centre for Neuroimaging, University College London, London, United Kingdom, 4Department of Neurophysics, Max Planck Institute for Human Cognitive and Brain Sciences, Leipzig, Germany, 5Institute of Cognitive Neuroscience, University College London, London, United Kingdom, 6Psychology Department, Goldsmiths College, London, United Kingdom
Synopsis
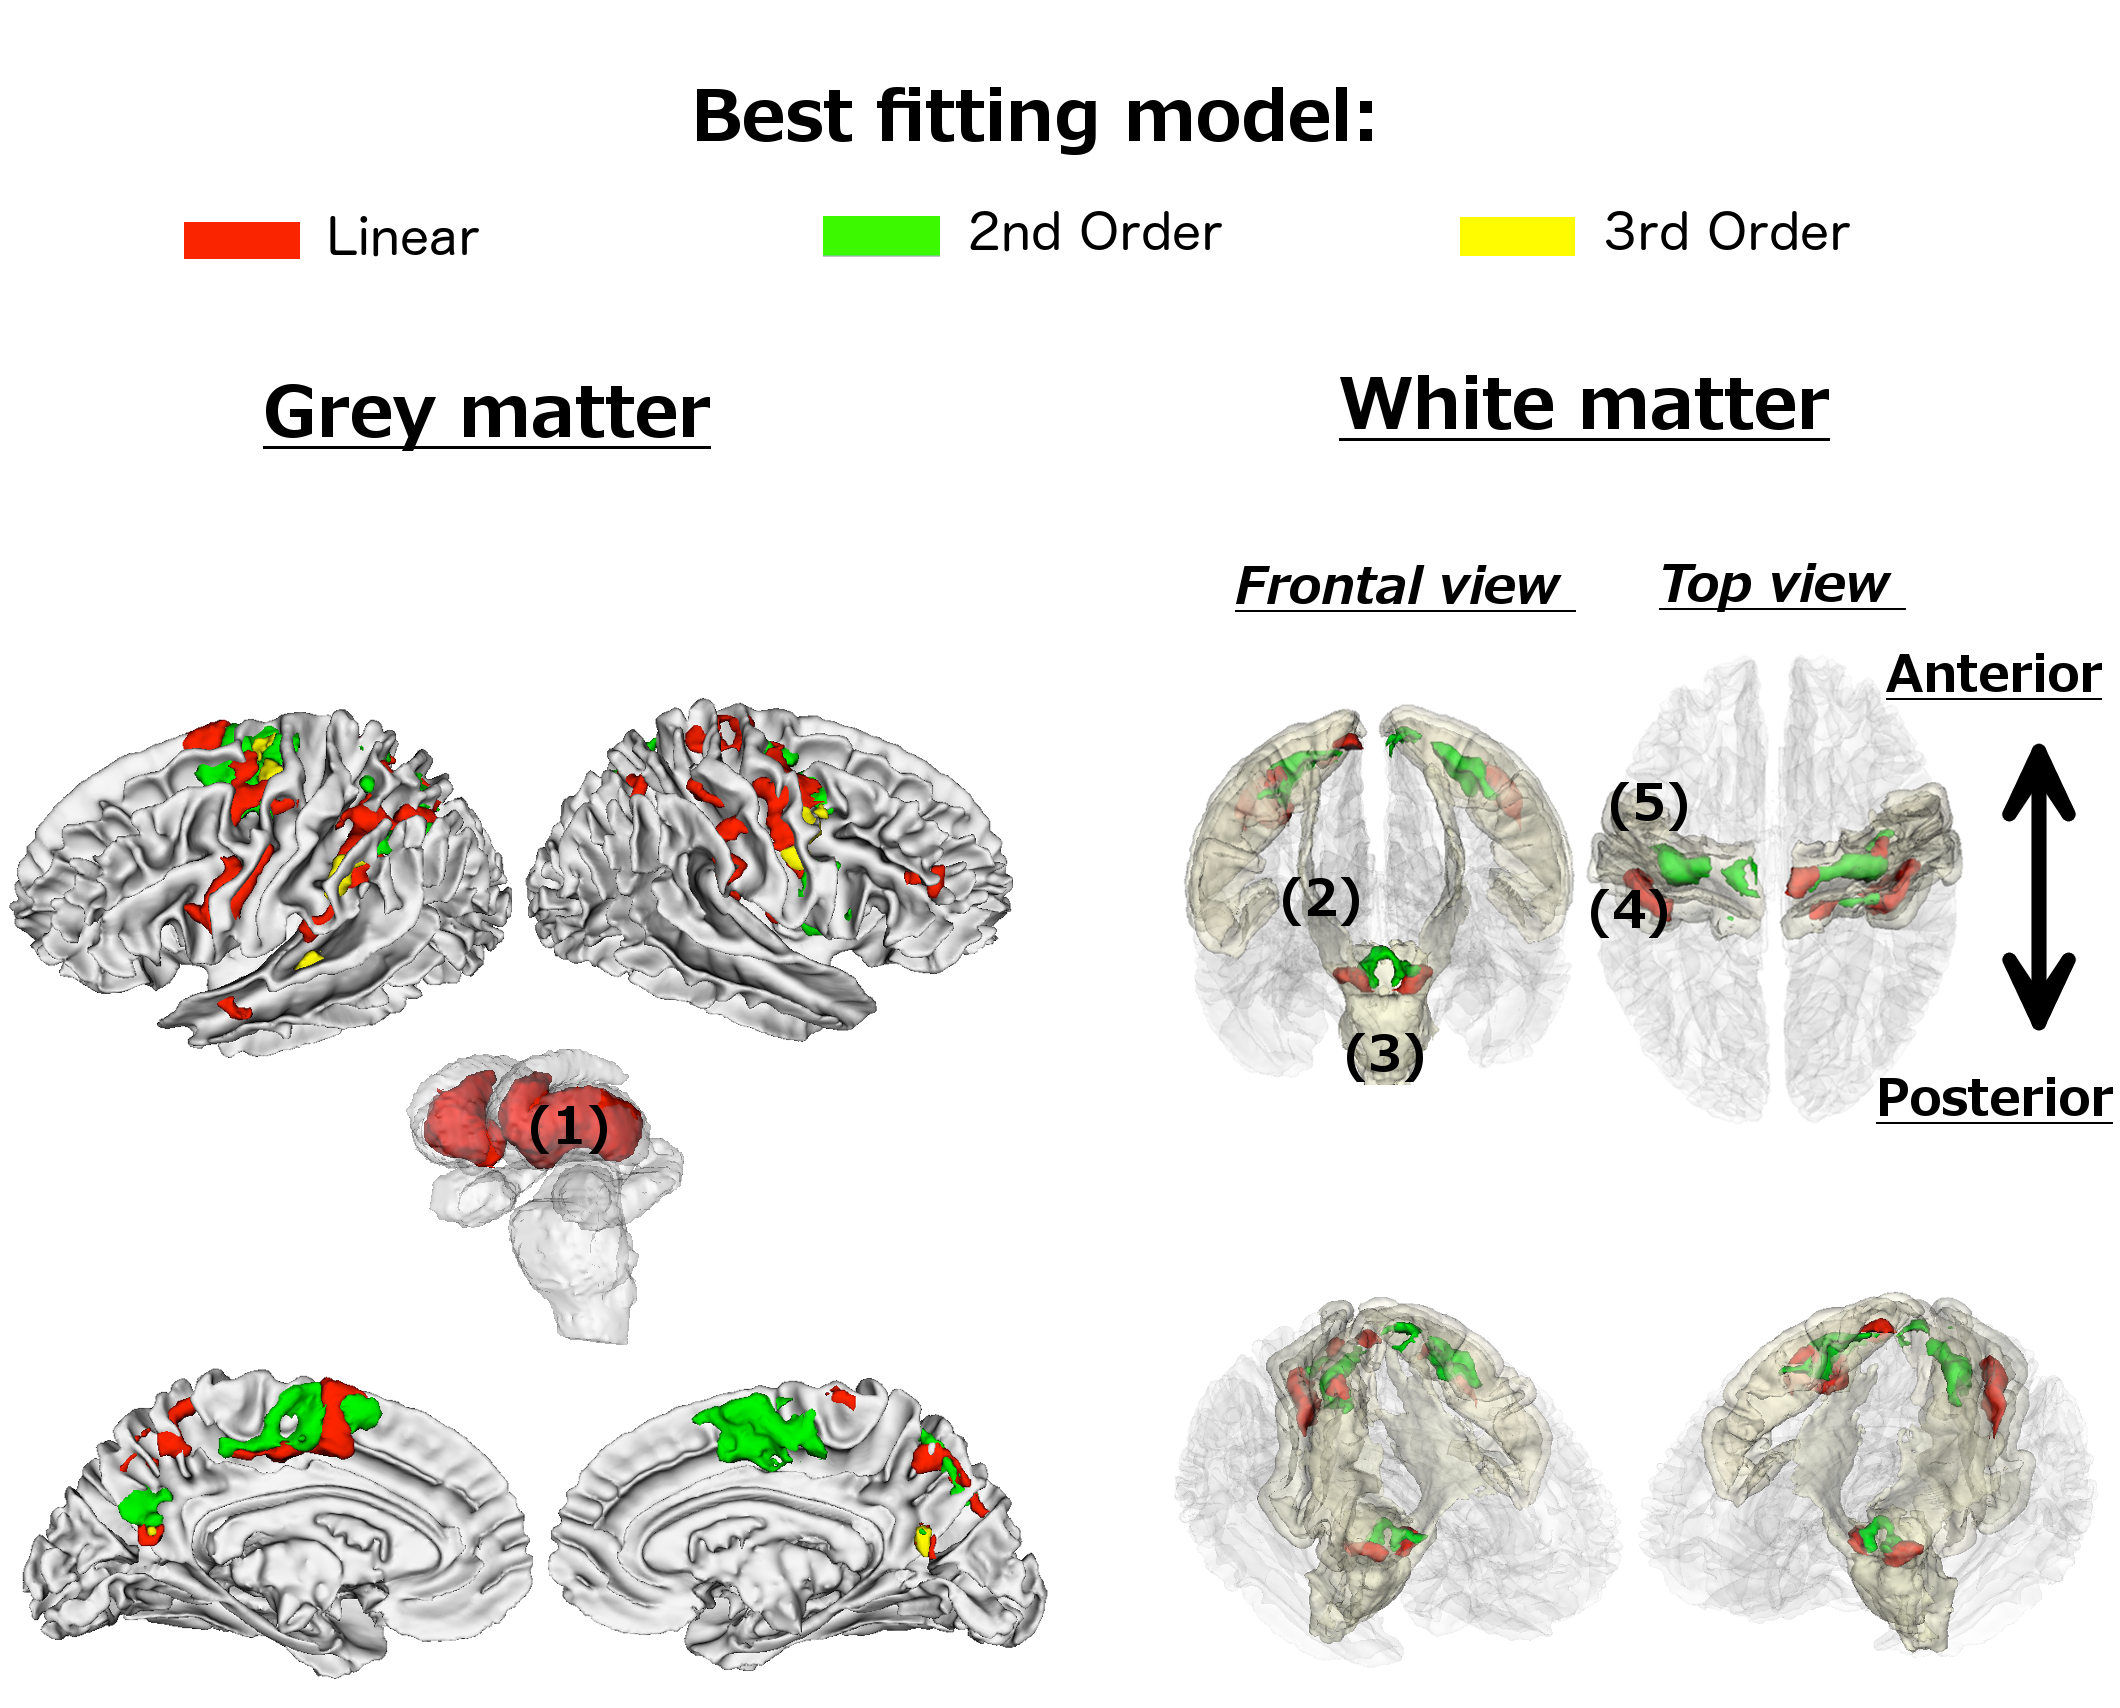
In this study we characterised the spatiotemporal features of age-related iron accumulation marked by R2* maps in 97 participants distributed over the whole range of ages between 20 and 75 years old. The analyses showed a broad spectrum of linear and non-linear patterns of age-related differences in R2*. These were predominantly confined to striatum, motor, pre-motor and parietal regions of grey matter as well as subgyral pre- and postcentral regions of white matter. The spatial distribution of R2* changes seems to be related to a higher prevalence of long-distance white matter connections originating from a region.
Introduction
Previous studies demonstrated region-specific iron accumulation in the ageing brain but its spatiotemporal features are not well specified1,2. Using R2* maps3 as iron surrogate marker in the brain, we aimed to cross-sectionally characterise (1) spatial distribution of age-related changes in iron content, and (2) critical points (i.e., inflexion) on the age-dependent trajectories, as well as the speed at which the R2* content changes before and after these critical points. As iron accesses have previously been related to an increased phagocytic activity4, we hypothesised that age-dependent iron accumulation may occur in regions with high metabolic expenditures, particularly those with a high density of long-distance connections5.Methods
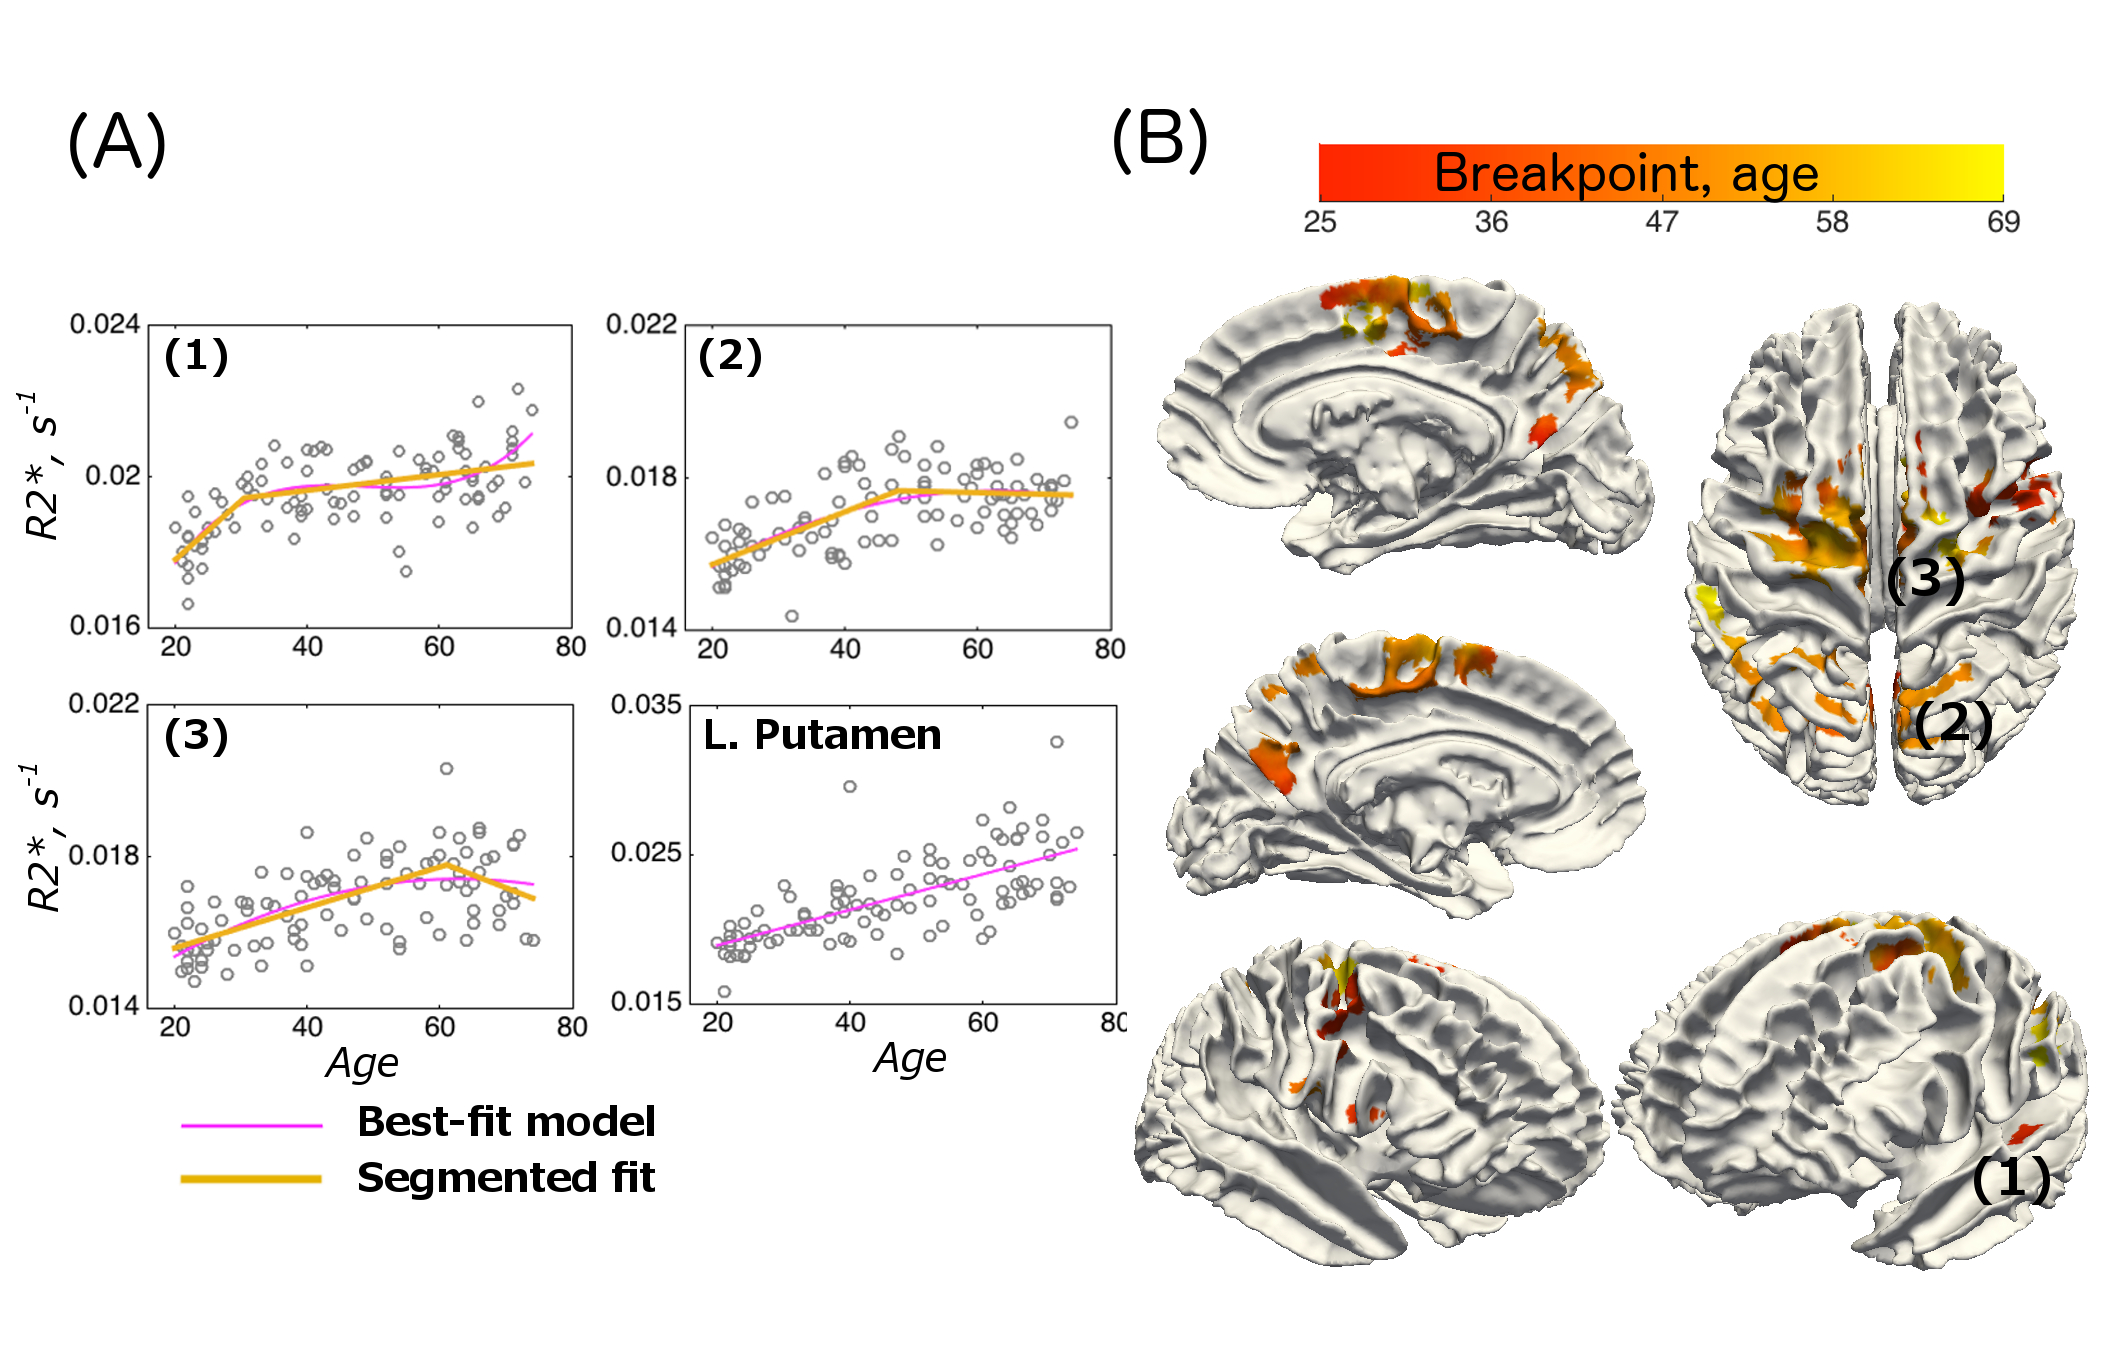
R2* (= 1/T*) quantitative images were obtained in 97 participants (40 males, 57 females) distributed over the whole range of ages between 20 and 75 years, and analysed using a mass-univariate approach implemented in SPM12. Regions which showed significant age-dependent changes were identified by fitting polynomial functions up to a third order. Subsequently, a segmented linear approximation6 was applied to voxels showing a significant non-linearity in order to obtain three parameters of interest: 1) breakpoint, i.e., a point that separates two linear segments of the fitted function; this parameter was used as an estimate for a critical point in the trajectory; 2) the rate of change of the linear segment before, and 3) the rate of change of the linear segment after the breakpoint, characterising how quickly age-related differences unfold, respectively, prior to and following the critical point on the trajectory.Results
1. Spatial distribution of R2* changes
Grey matter. Age-related R2* changes were predominantly confined to subcortical, motor, pre-motor and parietal regions (Figure 1). A linear fit characterised age-related differences in subcortical regions – specifically in the putamen and the anterior of the caudate nucleus, bilaterally. Spatially intertwined linear and non-linear patterns were observed in cortical structures.
White matter. Age-related differences in R2* were detected in subgyral precentral and postcentral white matter adjacent to those showing similar age-related changes in grey matter. The only exceptions were the left and right cerebral peduncles and an adjacent white matter area, possibly coinciding with thalamic fibres entering the brain stem.
2. Temporal characteristics of the age-related differences
Examples of fitted trajectories and spatial distribution of breakpoints of the segmented fit on the cortical surface are shown in Figure 2A-B. The breakpoints were bell-shape distributed (mean age: 46.5, sd: 8.6), with a few spikes in the shape (Figure 3A). A broad spectrum of trajectories was observed (Figure 3B-C). At the one end of the spectrum, early breakpoints (as early as 30 years of age) were preceded by a relatively quick rate of R2* increase, which was then followed by a continued increase at a slower rate without saturation at later stages. At the other end of the spectrum, an initial R2* increase at a relatively slow rate either saturated in late 40s or, for later breakpoints, or it showed an R2* decrease.
Discussion
We found a broad spectrum of linear and non-linear patterns of age-related differences in R2*, mainly in the striatum, motor, pre-motor and parietal regions of grey matter and subgyral pre- and postcentral regions of white matter. Anatomically, long-range projecting white matter fibres, e.g. cortico-spinal tract and superior longitudinal fasciculi I-III, originate in these regions. These fibers require high-cost maintenance in terms of energy consumption7,8 and removal of debris from their increased metabolic activity9,10. Moreover, the superior parietal, superior frontal, precuneus and insular cortices form brain’s “rich club”, a densely connected subset of regions (‘hubs’) that represent the backbone of the brain structural connectome11,12. It is possible that iron excess in these regions occurs due to iron accumulation by microglial cells, which become activated in response to homeostatic changes and neuroimflammation and whose functions include synaptic pruning and phagocytose13. This hypothesis finds support in immunotracing studies, showing that age-related differences in grey matter iron content can be detected only in microglial cells14. The absence of age-related differences in deeper layers of white matter R2* is in agreement with immune-tracing studies showing that iron levels in myelin-producing oligodendrocytes are relatively stable over the adult life-span14. Age-related R2* alterations were minor in prefrontal cortex which contrasts the findings from studies of macroscopic age-related changes in brain anatomy2 showing that anterior regions are first to decline. This suggests that R2* maps reveal an independent profile of normal ageing.Conclusions
This study showed a diverse pattern of age-related R2* trajectories in the brain. Their spatial distribution indicates that regions with high density of long-distance connections are the most susceptible to age-related accumulation of iron.Acknowledgements
No acknowledgement found.References
1Deoni S, Mercure E, Blasi A, Gasston D, Thomson A, Johnson M, Williams S, Murphy D. Mapping Infant Brain Myelination with Magnetic Resonance Imaging. J Neurosci 2011;31:784-791.
2Gogtay N, Giedd N, Lusk L, Hayashi K, Greenstein D, Vaituzis A, Nugent TFIII, Herman DH, Clasen LS, Toga AW, Rapoport JL, Thompson PM. Dynamic mapping of human cortical development during childhood through early adulthood. PNAS 2004;101:8174-8179.
3Weiskopf N, Suckling J, Williams G, Correia MM, Inkster B, Tait R, Cinly O, Bullmore ET, Lutti A. Quantitative multi-parameter mapping of R1, PD*, MT, and R2* at 3T: a multi-center validation. Front Neurosci 2013;7:95
4Rouault T. A. Iron metabolism in the CNS: implications for neurodegenerative diseases. Nat Rev Neurosci 2013:14:551-564.
5Crossley N, Mechelli A, Scott J, Carletti F, Fox P, McGuire P, Bullmore E. The hubs of the human connectome are generally implicated in the anatomy of brain disorders. Brain 2014;137:2382-2395.
6Toms JD, Lesperance ML. Piecewise regression: a tool for identifying ecological thresholds. Ecology 2003;84:2034–2041
7Markov NT, Ercsey-Ravasz M, Van Essen DC, Knoblauch K, Toroczkai Z, Kennedy H. Cortical High-Density Counterstream Architectures. Science 2013;342:1238406.
8Ercsey-Ravasz, M, Markov NT, Lamy C, Van Essen DC, Knoblauch K, Toroczkai Z, Kennedy H. A Predictive Network Model of Cerebral Cortical Connectivity Based on a Distance Rule. Neuron 2013;80:184–197.
9Saxena S, Caroni P. Selective Neuronal Vulnerability in Neurodegenerative Diseases: from Stressor Thresholds to Degeneration. Neuron 2011;71:35–48.
10Cavana AE, Trimble MR. The precuneus: a review of its functional anatomy and behavioural correlates. Brain 2006;129:564-83.
11van den Heuvel MP, Kahna RS, Gonib J, Sporns O. High-cost, high-capacity backbone for global brain communication. PNAS 2012;109:11372–11377.
12McColdan P, Seunarine KK, Razi A, Cole JH, Gregory S, Durr A, Roos RA, Stout JC, Landwermeyer B, Scahill RI, Clark CA, Rees G, Tabrizi SJ, Track-HD Investigators. Selective vulnerability of Rich Club brain regions is an organizational principle of structural connectivity loss in Huntington's disease. Brain 2015;138:3327-44.
13Kettenmann K, Hanisch UK, Noda M, Verkhratsky A. 2011. Physiology of Microglia. Physiol Rev. 91:461–553.
14Connor JR, Menzies SL, St Martin SM, Mufson EJ. Cellular distribution of transferrin, ferritin, and iron in normal and aged human brains. J Neurosci Research 1990;27:595–611.
Figures