3135
Quantifying cortico-cerebellar structural covariance1Neurology, Max Planck Institute for Human Cognitive and Brain Sciences, Leipzig, Germany, 2Cerebral Imaging Center, Douglas Mental Health University Institute, McGill University, Montreal, QC, Canada
Synopsis
Invasive tract-tracing in primates has shown that cerebellar regions (lobules) are differentially connected to the cerebral cortex. As diffusion tractography to/from the cerebellum is problematic in living humans, we propose a simple non-invasive approach to identify the patterns of grey-matter structural covariance between cerebellar lobules and the cerebral cortex as a proxy for anatomical connectivity. We performed vertex-wise linear regressions between lobular volumes and cortical thickness/surface area. We then clustered lobule-wise correlations to identify similar spatial patterns of cortico-cerebellar covariance. We identified differential patterns that may reflect the underlying connectivity between the cerebellum and cortex.
Introduction
Non-human primate tract-tracing work has shown that the cerebellum is connected to the cerebral cortex in predominantly closed loops between distinct cerebellar and cortical regions [1,2]. Diffusion-weighted magnetic resonance imaging (dwMRI) tractography shows significant promise for non-invasively assessing white-matter connectivity [3], but the multi-synaptic pathways in cortico-cerebellar connectivity make tractography problematic. However, structural properties of the brain such as cortical thickness, surface area, and cell density co-vary across communities of brain regions. And while the biological meaning is uncertain, it is likely a function of development and white-matter connectivity [4]. To overcome the limitations of diffusion tractography, we developed a non-invasive approach to quantify structural covariance in the grey-matter as an indicator of anatomical connectivity and concerted regional development.Method
Processing was performed with the T1w structural images from the Human Connectome Project (HCP) S900 data release (T1w: 0.7 mm iso, TI/TE/TR=1000/2.14/2400ms, FOV=224x224mm) (www.humanconnectome.org) [5]. Preprocessed diffusion data were used to calculate fractional anisotropy (FA) from the b=3000 shell and generate a white-matter exclusion mask (FA > 0.35). Cerebellar lobular segmentation was performed with the Multiple Automatically Generated Templates segmentation tool (MAGeT Brain: https://github.com/CobraLab/MAGeTbrain) [6], further refined with the white-matter exclusion mask, and resulted in segmentations for 33 anatomically-defined lobules (11 per hemisphere and 11 vermal). After non-uniformity correction and brain extraction (https://github.com/CobraLab/minc-bpipe-library), cerebral cortical thickness (CT) and surface area (SA) were estimated with CIVET 1.1.12 [7,8], and smoothed (20mm/40mm FWHM surface heat kernels respectively). After removing individuals without T1w and dwMRI, those who failed quality control assessment, and selecting unrelated right-handed individuals, our final sample included 328 individuals.
Cortico-cerebellar covariance was estimated with vertex-wise linear regression models relating cerebellar lobular volume to CT and SA. Independent models predicting CT and SA were used, including age and sex as covariates of no interest. All linear regressions were performed with RMINC https://github.com/Mouse-Imaging-Centre/RMINC) in R (v3.3).
Linear regression models predicting CT or SA with all 33 cerebellar lobules were evaluated separately for all vertices in the right and left hemisphere to assess the overall relationship with cerebellar cortex. For example, left SA ~ age + sex + {left H III + right H III + left H IV + right H IV … Vermal X}.
Individual lobular linear regressions predicting left and right CT and SA separately with a) volume of the respective opposite hemispherical lobules (e.g., left SA ~ age + sex + right H IV), and b) volume from the vermal lobules (e.g., left SA ~ age + sex + Vermal III) were performed to identify the covariance of each lobule. In a data-drive approach, the betas from all lobular regressions were then combined correlated, and hierarchically clustered based on their similarity (Ward, D2). Extracted clusters were then used as predictors in four additional regression models.
Results
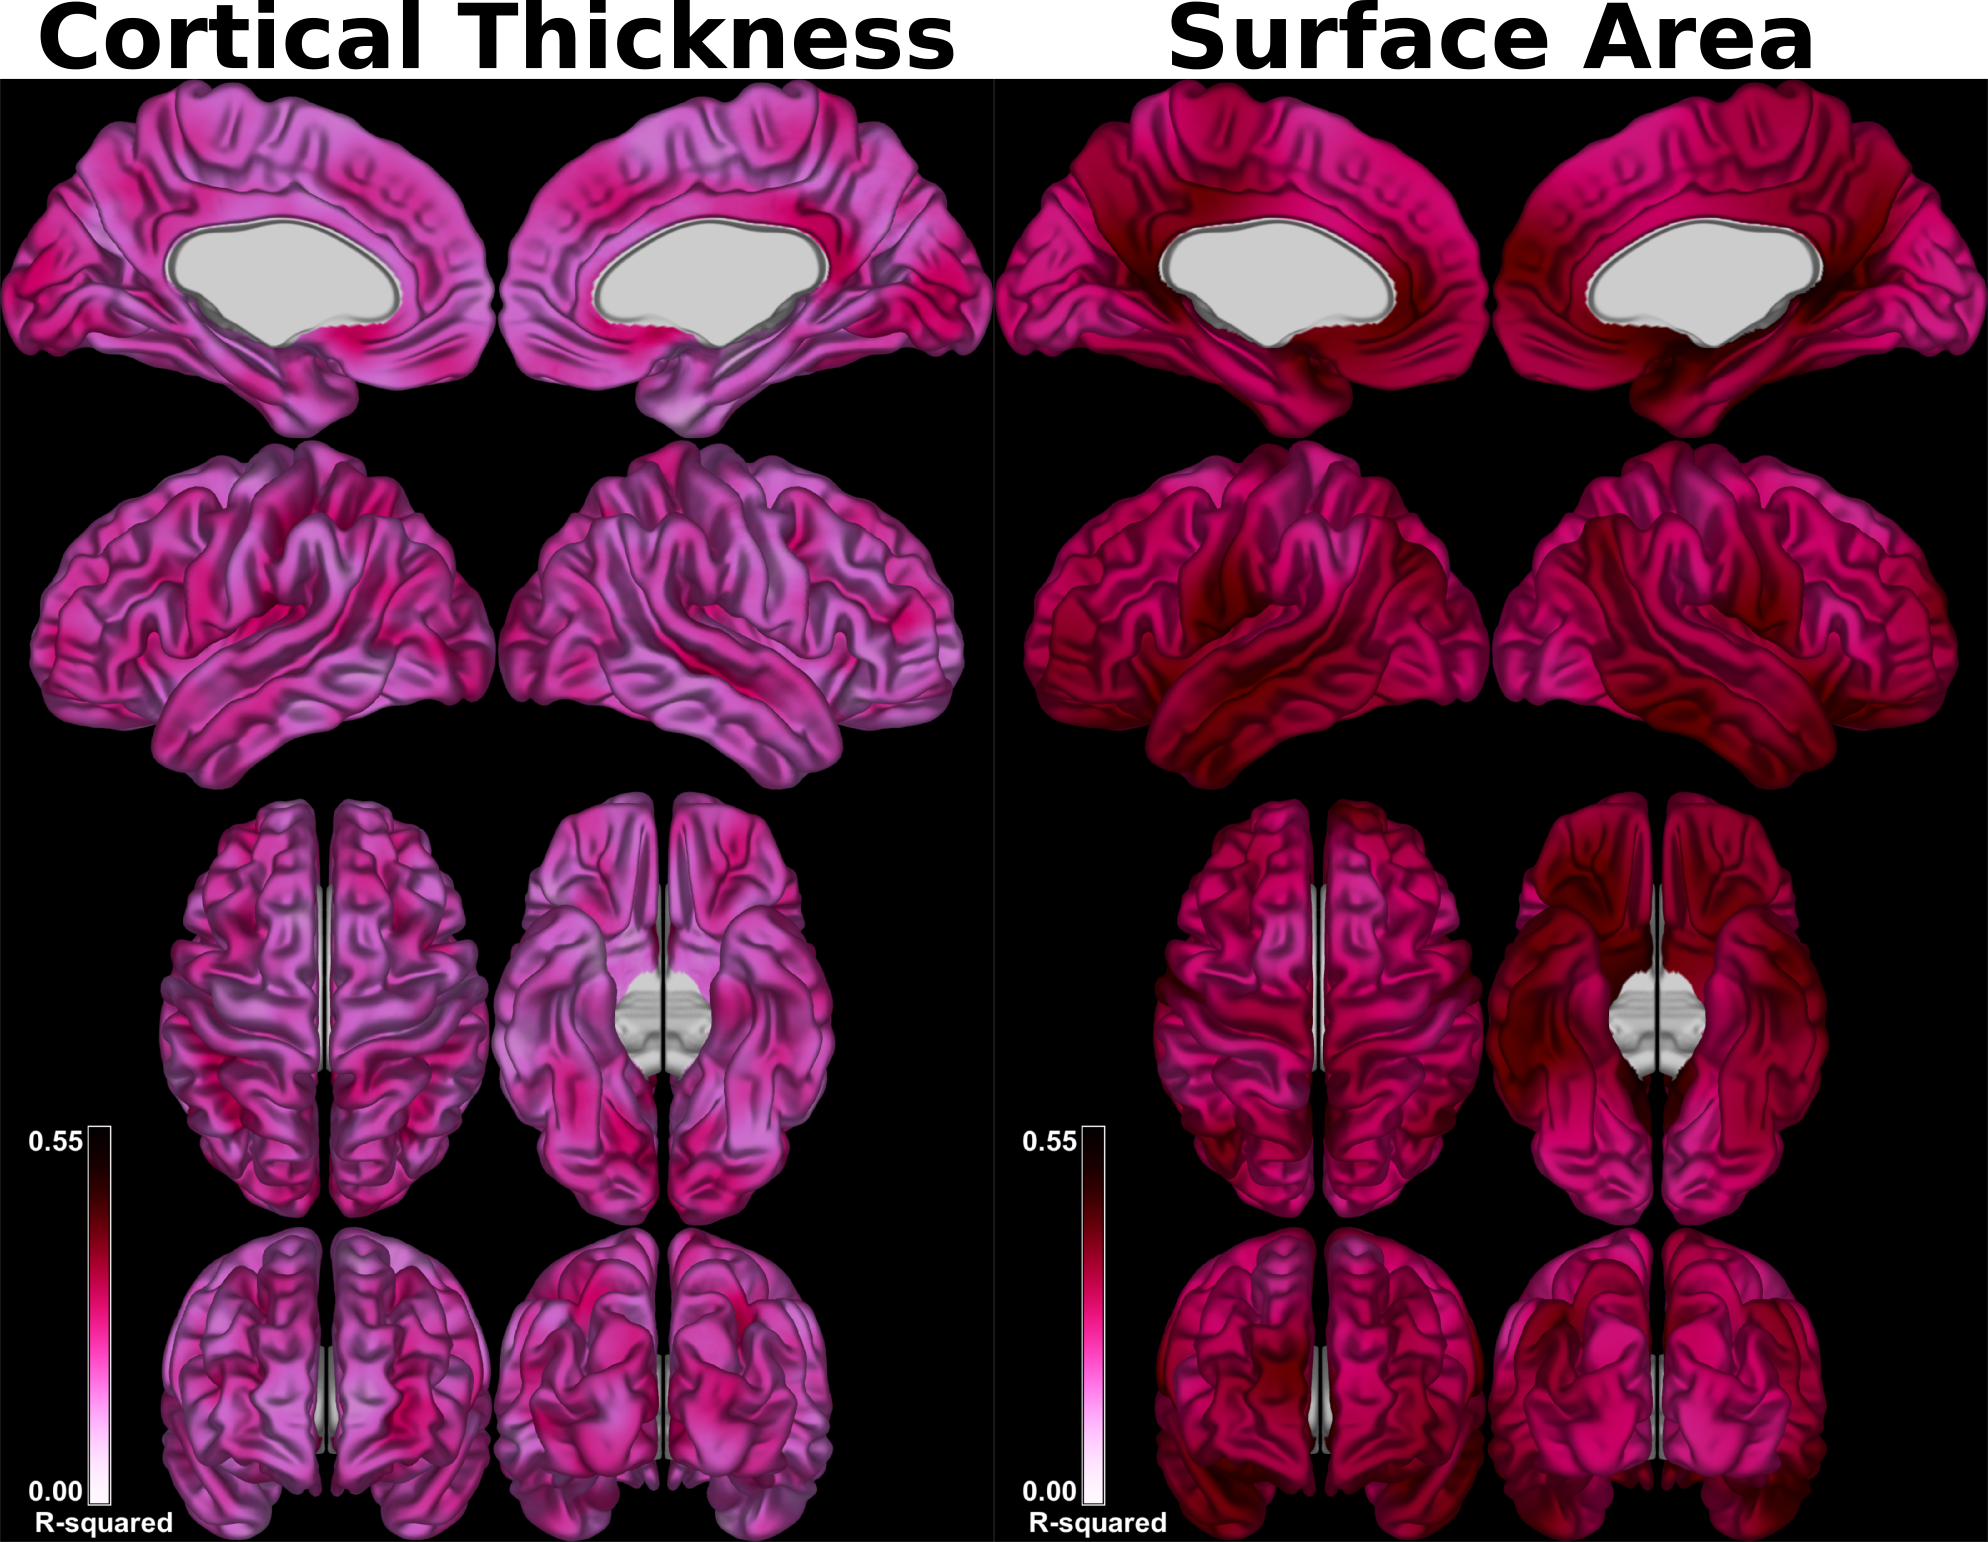
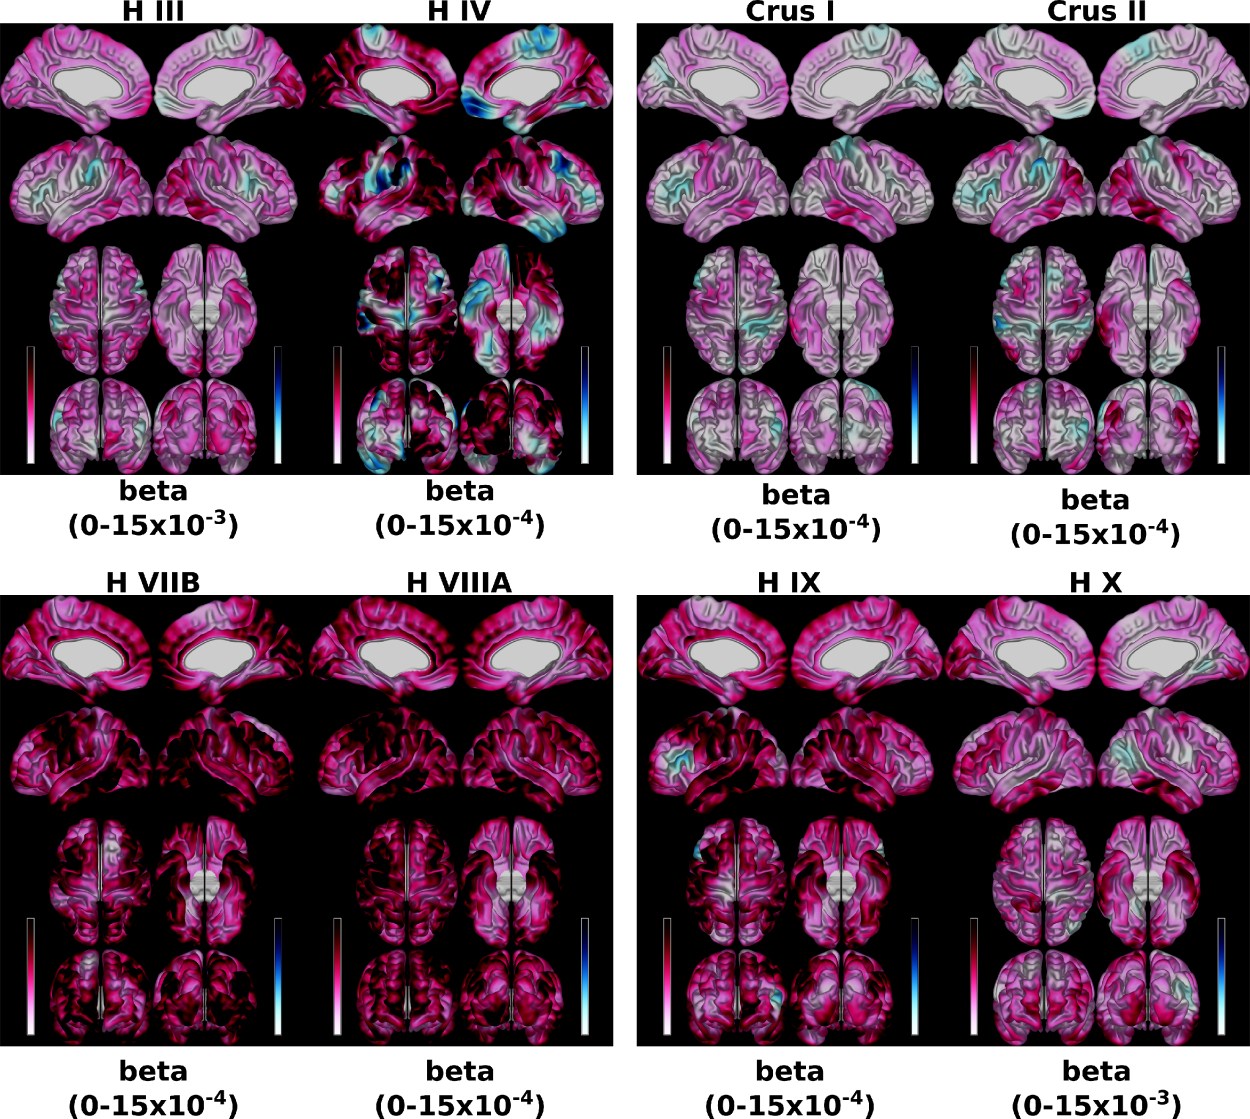
The set of models relating lobular volumes to CT/SA revealed that there was less variance accounted for in CT (range across vertices: 0.07–0.46) than that of SA (0.20 – 0.52) (Figure 1). For the individual lobule-wise regression models predicting CT and SA, the spatial distributions exhibited strikingly different patterns (Figure 2, for SA). The magnitude of the betas also differed by a large amount, with lobules H III and X exhibiting the largest betas and lobules Crus I and Crus II exhibiting the smallest.
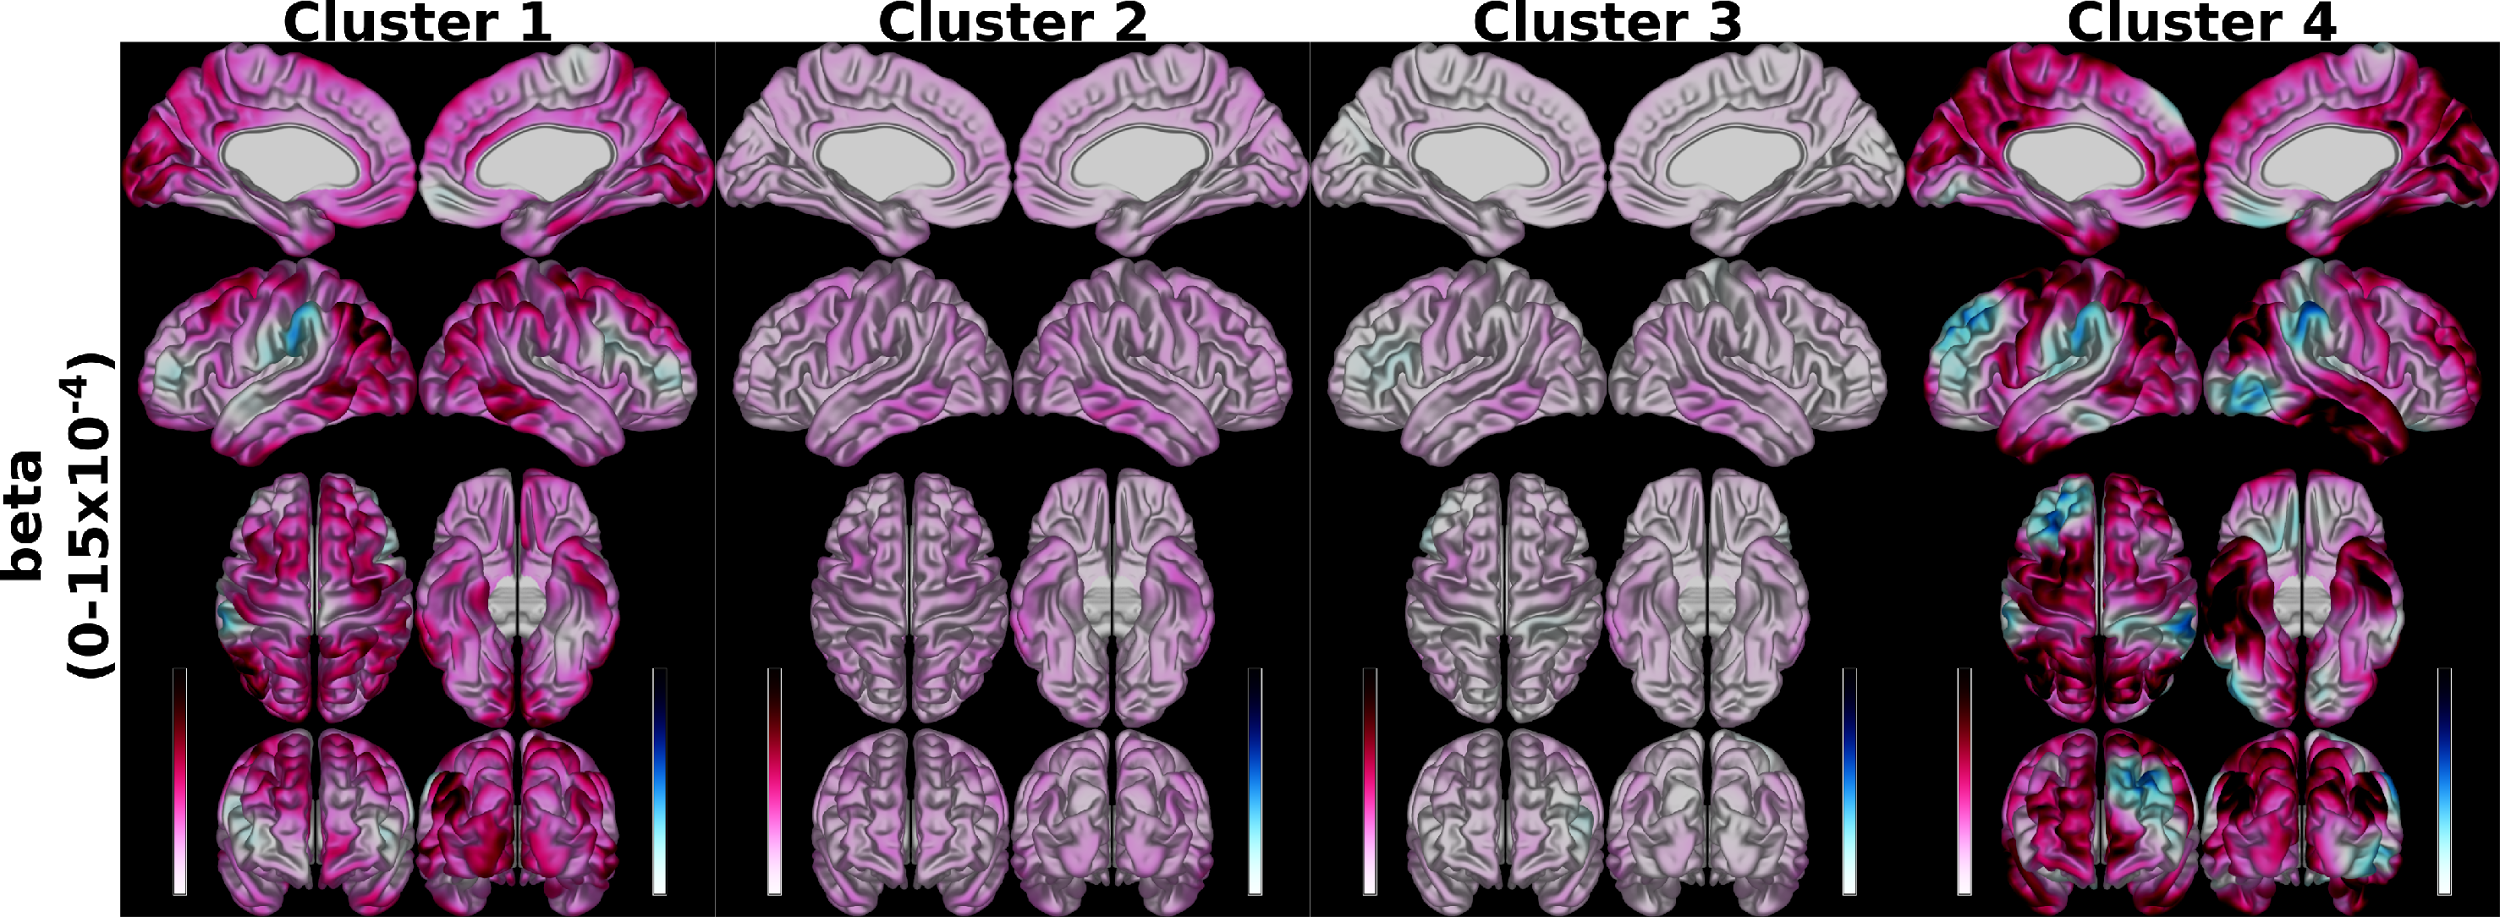
Hierarchical clustering of the similarities between the betas of the regression models predicting SA resulted in four clusters: cluster 1 (left and right H III, IV, Vermal I/II, III, and V), 2 (left and right H V, VI, VIIB, VIIIA, VIIIB, X, Vermal VIIIB, IX, X), 3 (left and right Crus I, II, IX, and Vermal VIIIA), and 4 (Vermal IV, VI, VIIA, VIIB). When to predict SA, our results indicated that clusters 1 and 4 exhibited betas with the largest absolute magnitude while clusters 2 and 3 were smaller (Figure 3).
Discussion and Conclusions
Our results demonstrate that the spatial distribution of cortico-cerebellar covariance varies between lobules (Figures 2 and 3). While it is likely that this covariance is driven by a combination of developmental processes and anatomical connectivity, previous work indicates that a large proportion is accounted for by structural connectivity [12]. Our results also provide initial evidence that the structural covariance between the cerebellum and cerebral cortex may be stronger with SA than with CT (Figure 1) - a finding that is in line with previous work in animals showing that these two cortical metrics are determined by distinct ontogenetic processes [9].Acknowledgements
No acknowledgement found.References
1. Ramnani, N. The primate cortico-cerebellar system: anatomy and function. Nat Rev Neurosci 7, 511–522 (2006).
2. Strick, P. L., Dum, R. P. & Fiez, J. A. Cerebellum and Nonmotor Function. Annual Review of Neuroscience 32, 413–434 (2009).
3. Steele, C. J. et al. Human Cerebellar Sub-millimeter Diffusion Imaging Reveals the Motor and Non-motor Topography of the Dentate Nucleus. Cereb. Cortex (2016).
4. Alexander-Bloch, A., Giedd, J. N. & Bullmore, E. Imaging structural co-variance between human brain regions. Nat. Rev. Neurosci. 14, 322–336 (2013).
5. Van Essen, D. C. et al. The WU-Minn Human Connectome Project: An overview. NeuroImage 80, 62–79 (2013).6. Park, M. T. M. et al. Derivation of high-resolution MRI atlases of the human cerebellum at 3 T and segmentation using multiple automatically generated templates. NeuroImage 95, 217–231 (2014).
7. Ad-Dab’bagh, Y. et al. The CIVET image-processing environment: a fully automated comprehensive pipeline for anatomical neuroimaging research. in Proceedings of the 12th annual meeting of the organization for human brain mapping 2266 (Florence, Italy, 2006).
8. Tohka, J., Zijdenbos, A. & Evans, A. Fast and robust parameter estimation for statistical partial volume models in brain MRI. NeuroImage 23, 84–97 (2004).
9. Pontious, A., Kowalczyk, T., Englund, C. & Hevner, R. F. Role of Intermediate Progenitor Cells in Cerebral Cortex Development. DNE 30, 24–32 (2008).
10. Rakic, P. Specification of cerebral cortical areas. Science 241, 170–176 (1988).
11. Rakic, P. Evolution of the neocortex: a perspective from developmental biology. Nat. Rev. Neurosci. 10, 724–735 (2009).
12. Gong, G., He, Y., Chen, Z. J. & Evans, A. C. Convergence and divergence of thickness correlations with diffusion connections across the human cerebral cortex. NeuroImage 59, 1239–1248 (2012).
Figures