3134
Preliminary investigation of QSM stability across sites1German Center for Neurodegenerative Diseases, Magdeburg, Germany, 2Institute for Cognitive Neurology and Dementia Research, Otto-von-Guericke University, Magdeburg, Germany, 3Department of Psychiatry, University Hospital Bonn, Bonn, Germany, 4German Center for Neurodegenerative Diseases, Bonn, Germany, 5Department of Psychosomatic Medicine, University Medicine Rostock, Rostock, Germany, 6German Center for Neurodegenerative Diseases, Rostock, Germany, 7Institute for Stroke and Dementia Research, Klinikum der Universität München, Ludwig-Maximilians-Universität, Munich, Germany, 8German Center for Neurodegenerative Diseases, Munich, Germany, 9Department of Psychiatry, Charité-Universitätsmedizin Berlin, Berlin, Germany, 10German Center for Neurodegenerative Diseases, Berlin, Germany, 11Department of Psychiatry and Psychotherapy, University Medical Center Göttingen, Göttingen, Germany, 12German Center for Neurodegenerative Diseases, Göttingen, Germany, 13Department of Psychiatry and Psychotherapy, Eberhard Karls University, Tübingen, Germany, 14German Center for Neurodegenerative Diseases, Tübingen, Germany, 15Department of Psychiatry, University of Cologne, Cologne, Germany, 16Institute of Cognitive Neuroscience, University College London, London, United Kingdom, 17Wellcome Centre for Human Neuroimaging, UCL Institute of Neurology, University College London, London, United Kingdom
Synopsis
We compared quantitative susceptibility mapping (QSM) from two groups of subjects scanned at two different sites on different 3T Siemens MRI systems running different Syngo MR software versions. Qualitative whole-brain inspection of summary statistics and a statistical test comparing data from both sites revealed no major QSM offsets. The present results are only preliminary but they suggest QSM might be well suited for multi-site studies.
Purpose
QSM is increasingly gaining traction for the study of aging and neurological disorders. However, with the adoption of QSM in several multi-center studies, investigating QSM inter-site stability has become a pressing priority. In this preliminary study, we studied QSM data from two age-matched groups scanned at two sites.Methods
Two groups of 15 healthy volunteers (age: 68±5 y.o. and 68±3 y.o., respectively) were scanned at imaging centers in Bonn and Magdeburg. The former site has a Siemens Skyra MR system with Syngo VD13 software version, whereas the latter site has a Siemens Verio MR system with VB19. A 32-channel receive head-coil was used at both sites. 3D-MPRAGE (TR/TI/TE 2500/1100/4.37ms, 1-mm3 isotropic resolution) and flow-compensated 3D-FLASH (TR/TE 28/20ms, 0.8x0.8x2.0mm3 resolution) data were acquired for each subject.
QSM reconstruction consisted of coil-data combination [1], phase unwrapping [2], background filtering [3] and L1-regularized inversion [4], i.e. an analogous pipeline to that used in [5]. The optimal regularization term, λ, for each subject was calculated with the L-curve method [6] sweeping the parameter space from λ=400 to λ=1100 in λ=20 steps.
Currently, there is no consensus on how to best select an optimal λ for group analysis. In most studies, λ is optimized for a small group of subjects, often a single subject, and the same parameter value is used for all reconstructions. In this study, we inferred the average L-curve optimal λ across all subjects, i.e. λ=705. Another unresolved issue in QSM is global referencing. A previous study, however, found reference adjustments are small compared to aging effects [5]. Thus, in this study, we excluded such a step.
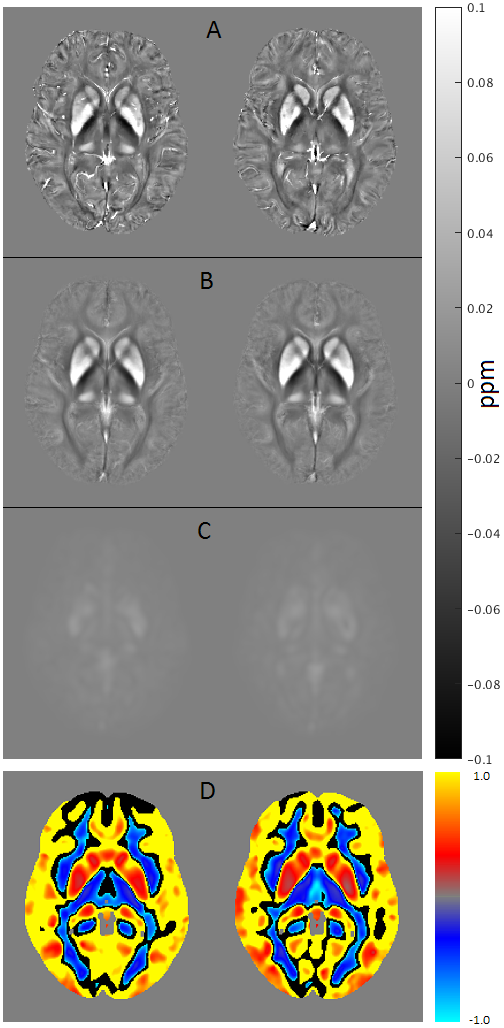
QSM data were spatially standardized as follows: T2*-weighted magnitude data were first co-registered to their corresponding MPRAGE image using FLIRT/FSL. Then the latter were non-linearly co-registered to the MNI152 template using FLIRT/FSL plus FNIRT/FSL. Subsequently, the estimated co-registration parameters from first step, followed by warping parameters from second step were applied to QSM. Mean, standard deviation (SD) and coefficient of variation (CV=SD/mean) maps were computed in MNI space. For formal statistical analysis (in SPM12), all data were spatially smoothed with an 8-mm full-width-at-half-maximum isotropic Gaussian kernel prior to performing a two-sample t-test on the null-hypothesis QSM at site 1 and QSM at site 2 came from the same distribution.
Results
On visual inspection, site-specific mean, SD and CV QSM maps are largely analogous (Fig. 1). In addition, the statistical comparison was negative, i.e. we could not reject the null hypothesis for any cluster at the corrected threshold level, PFWE<0.05.Discussion
In this preliminary study, we explored the comparability of QSM reconstructions from two different 3T MRI systems (same vendor but different software versions) at two different sites. We found no direct evidence of major instabilities either on qualitative investigation of summary metrics such as mean, standard deviation or coefficient of variation for each site, or with a formal two-sample t-test analysis. Although numbers are on the low side, QSM previously demonstrated it can detect disease alterations in similarly sized cohort [7]. Therefore, a negative result in this context, although with many caveats (e.g. sub-optimal co-registration, use of parametric statistics for a relatively small sample, etc), can be interpreted as a satisfactory indication that systematic site-specific effects are not overwhelmingly large. This warrants a further investigation with greater power and further optimized methods.Acknowledgements
This study was sponsored by the German Center for Neurodegenerative Diseases (DZNE). Julio Acosta-Cabronero was supported by core funding from the Wellcome, UK [203147/Z/16/Z]. We gratefully thank all the participants in this research study together with our radiographers for their dedicated efforts in scanning standardization.References
1. Walsh DO, Gmitro AF, Marcellin MW (2000) Adaptive reconstruction of phased array MR imagery. Magn Reson Med 43(5):682-90.
2. Schofield MA, Zhu Y (2003) Fast phase unwrapping algorithm for interferometric applications. Opt Lett 28(14):1194-6.
3. Schweser F, Deistung A, Lehr BW, Reichenbach JR (2011) Quantitative imaging of intrinsic magnetic tissue properties using MRI signal phase: an approach to in vivo brain iron metabolism? Neuroimage 54(4):2789-807.
4. Liu T, Wisnieff C, Lou M, et al. (2013) Nonlinear formulation of the magnetic field to source relationship for robust quantitative susceptibility mapping. Magn Reson Med 69:467-76.
5. Acosta-Cabronero J, Betts MJ, Cardenas-Blanco A, Yang S, Nestor PJ (2016) In Vivo MRI Mapping of Brain Iron Deposition across the Adult Lifespan. J Neurosci 36(2):364-74.
6. Hansen PC and O’Leary DP (1993) The Use of the L-Curve in the Regularization of Discrete Ill-Posed Problems. SIAM J Sci Comput 14(6):1487-1503.
7. Acosta-Cabronero J, Williams GB, Cardenas-Blanco A, Arnold RJ, Lupson V, Nestor PJ (2013) In vivo quantitative susceptibility mapping (QSM) in Alzheimer's disease. PLoS One 8(11):e81093.
Figures