3132
Large Vessel Filtering of In Vivo High-Resolution Mouse CBV Map Using Expectation-Maximization Gaussian Mixture Model1Department of Biomedical Engineering, Columbia University, New York, NY, United States, 2Departments of Neurology, Radiology or Psychiatry, Columbia University College of Physicians and Surgeons, New York, NY, United States
Synopsis
When examining relative cerebral blood volume (rCBV) between mice, values from the unwanted large vessels should be excluded, otherwise, they may result in findings that are not associated with the basal metabolism mapped by microvascular blood volume. Our proposed method provides an automated and robust approach to estimate the rCBV distribution in large vessels with the maximum likelihood estimation using expectation-maximization Gaussian mixture model and to help filter out this unwanted confounding. In research related to rCBV analysis, we suggest applying this as one preprocessing step, which may help improve both sensitivity and specificity when comparing rCBV between subjects.
INTRODUCTION
Cerebral blood volume (CBV) is the MRI technique that can most readily visualize individual hippocampal subregions with high spatial resolution and contrast, among the MRI hemodynamic correlates of brain metabolism. High-resolution measures of CBV do in fact reflect underlying physiology and metabolism and has been shown to successfully detect AD-related and age-related neuronal dysfunction targeted separate hippocampal subregions1.
Mice are the only species that provide both a model of the AD and a model of normal aging and have a relatively short lifespan. Transgenically engineered mice have emerged as the dominant animal model with which to investigate disorders of the brain and novel therapeutic agents.
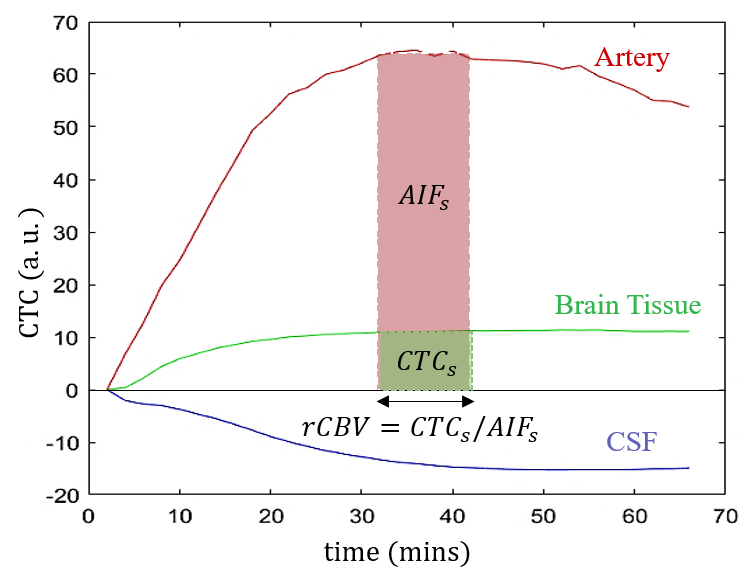
As previously described2, mouse CBV was mapped according to changes in the transverse relaxation rate (∆R2) induced by Gadodiamide intraperitoneal injection. Instead of a fast pass of the contrast bolus observed with intravenous injection, IP injection provides a continuous Gadodiamide perfusion in the brain characterized with a relatively long saturation-state (SS) which is used for generating high spatial resolution CBV maps in vivo. This SS contrast-enhanced (SS-CE) technique was developed with the contrast agent (CA) that remain confined to the vascular space during the measurement in the presence of an intact blood-brain barrier. Assuming a linear relationship between ∆R2 and the CA concentration, relative CBV can be modeled as the blood volume fraction (BVf) as illustrated in Figure-1.
This technique provides contrast for all vasculature in the brain, but only microvasculature rCBV is more tightly coupled to neuronal basal metabolism. Values from the large vessels can play as an unwanted confound factor thus should be filtered out prior to rCBV analysis and comparison between animal groups.
In this abstract, we proposed a large vessel filtering algorithm using the Expectation-Maximization Gaussian mixture model (EM-GMM), based on the prior knowledge of the underlying vascular anatomy and the real experimental observation - large vessels such as arteries have the highest rCBV throughout the whole brain while brain regions enriched in capillary have much lower rCBV.
METHODS
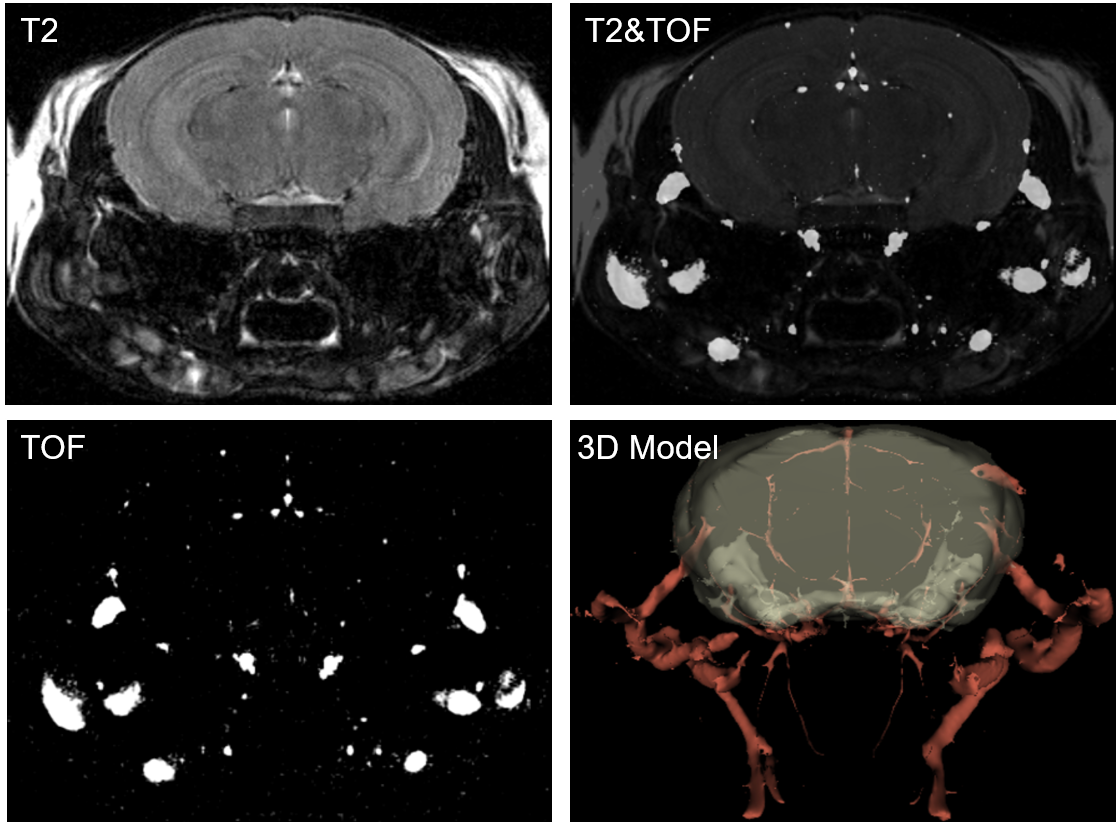
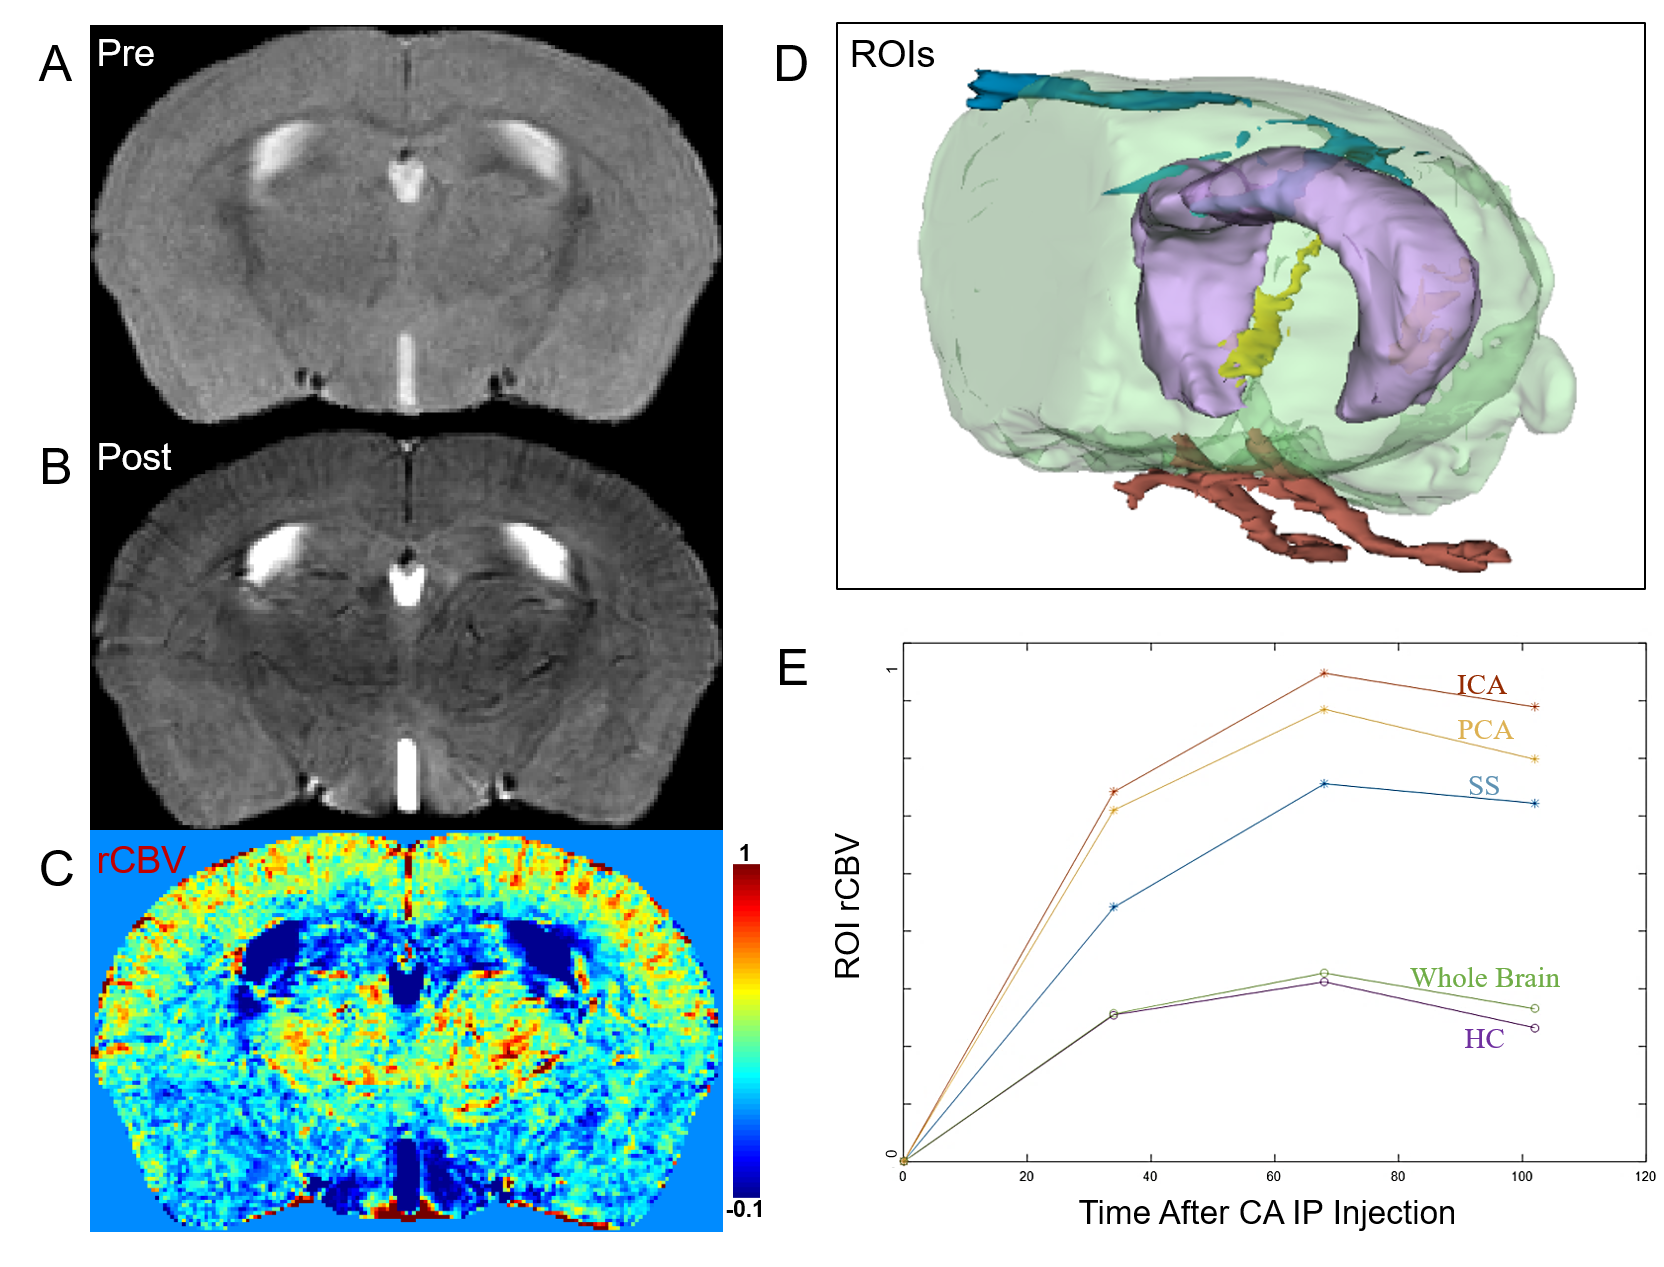
A Bruker BioSpec 94/20 horizontal scanner and a 23-mm 1H circularly polarized transmit/receive capable mouse head volume coil were used for the imaging. Mice were anesthetized using medical air and 1-1.5% isoflurane. The body temperature was maintained at around 37°C. T2-weighted images were acquired before and 36 min after IP injection of the Gadodiamide at 10 mmol/kg. Two more post contrast scans were acquired than the previous protocol2 to capture the dynamic concentration-time-curve (Figure-3). T2-weighted images were acquired to cover the mouse cortex with a RARE sequence (TR, 2,500 ms; TE, 45 ms; RARE factor, 16; in-plane resolution, 50 µm; slice thickness, 250 µm). To localize large vessels so that we can examine the differences in rCBV distribution between large vascular and brain tissue, a TOF scan was acquired before IP injection of CA with the same orientation, geometry and field of view as the baseline T2 scan (Figure-2).
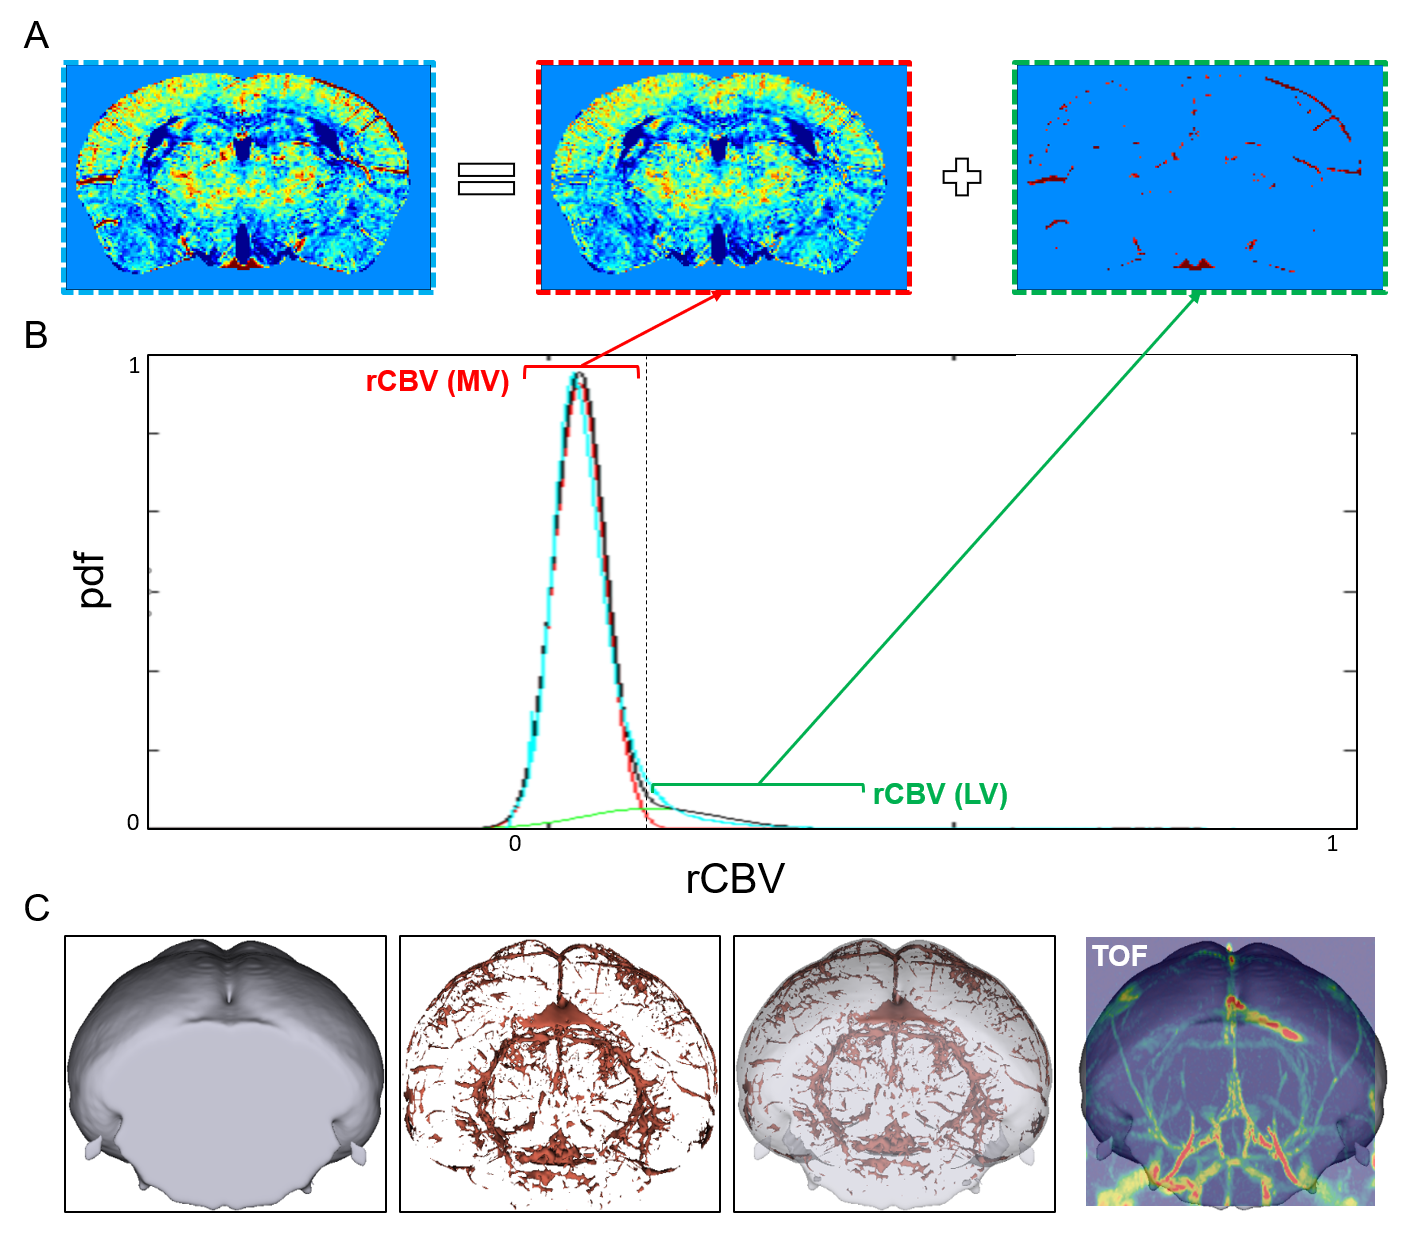
A consistent bimodal distribution was observed in the rCBV intensity distribution in the mouse brain mapped with ∆R2 across the subject. We used EM-GMM to decompose this distribution into two Gaussian distributions which we assume to represent the microvasculature and large vessels respectively. Once the mean and variance of each vessel type are known, voxels in the CBV map can be classified based on its rCBV intensity (Figure-4). The result of the segmented large vessels can be further validated by comparing its structure with the known vascular anatomy.
RESULTS
The representative illustration of rCBV calculation is displayed in Figure-1.
Figure-2 shows images acquired using T2 RARE and TOF from the same field of view with the same geometry and orientation.
rCBV results of different regions of the brain were generated including three brain arteries, the bilateral hippocampus, and the whole brain, as shown in Figure-3. Large vessels (i.e., the arteries) have the largest rCBV across the whole brain. Large vessels can be separated from the brain tissue (enriched in microvasculature) using EM-GM model.
Figure-4 illustrates the concept of this algorithm and displays the segmented results.
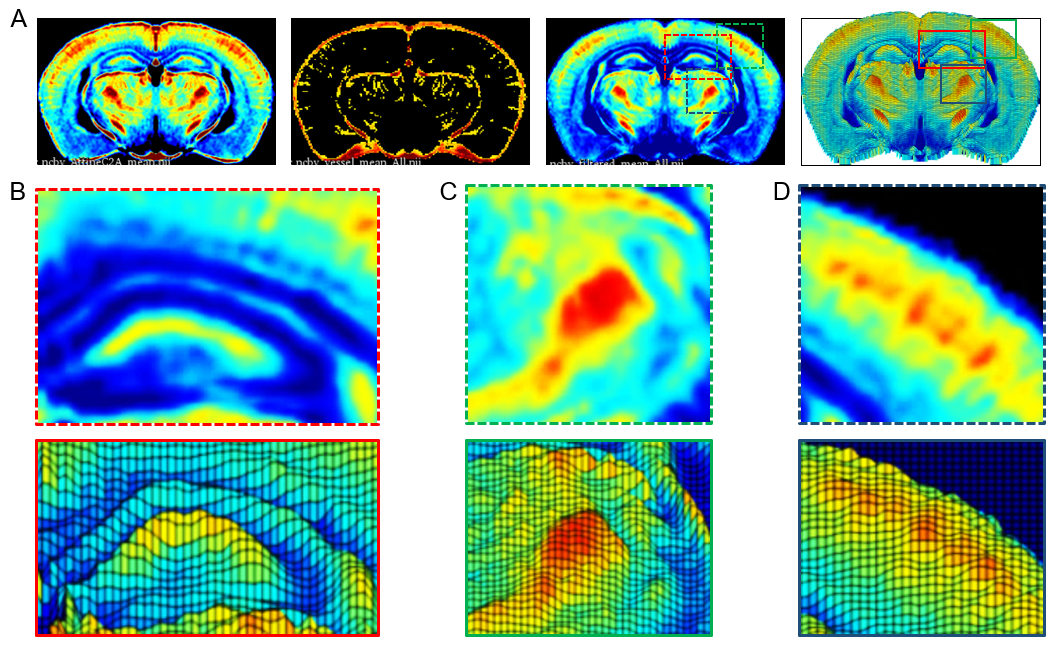
By removing the unwanted confound large vessel components; large vessel filtering clearly improved the ability to use rCBV to map functional architectures in vivo as shown in Figure-5.
DISCUSSION & CONCLUTION
Our proposed method to employ a single subject rCBV large vessel filtering algorithm based on the EM-GMM. Large vessels can be separated from the brain tissue successfully. Additionally, we have verified that the segmented large vessel results through a 3D visualization examination and comparing it to the corresponding TOF angiography. Moreover, when removing components from large vessels, the filtered rCBV maps can better distinguish different functional architectures in the brain.Acknowledgements
No acknowledgement found.References
1. Khan, U.A., et al. Molecular drivers and cortical spread of lateral entorhinal cortex dysfunction in preclinical Alzheimer's disease. Nat Neurosci 17, 304-311 (2014).
2. Moreno, H., Hua, F., Brown, T. & Small, S. Longitudinal mapping of mouse cerebral blood volume with MRI. NMR Biomed 19, 535-543 (2006).
Figures