3131
Automatic quality assessment of high-resolution T2-weighted images used in hippocampus volumetry and functional studies – a tool developed as part of DZNE-DELCODE study.1German Center for Neurodegenerative Diseases (DZNE), Magdeburg, Germany, 2IKND, Magdeburg, Germany, 3Institute of cognitive neurology and dementia research, Magdeburg, Germany, 4Aging & Cognition Research Group, German Center for Neurodegenerative Diseases (DZNE), Magdeburg, Germany, 5Department of Psychiatry, University Hospital Bonn, Bonn, Germany, 6German Center for Neurodegenerative Diseases (DZNE), Bonn, Germany, 7German Center for Neurodegenerative Diseases (DZNE), Rostock, Germany, 8Department of Psychosomatic Medicine, University Medicine Rostock, Rostock, Germany, 9German Center for Neurodegenerative Diseases (DZNE), Munich, Germany, 10Institute for Stroke and Dementia Research, Ludwig-Maximillian-Universitaets, Munich, Germany, 11Department of Psychiatry, Charité-Universitätsmedizin Berlin, Berlin, Germany, 12German Center for Neurodegenerative Diseases (DZNE), Berlin, Germany, 13Department of Psychiatry and Psychotherapy, University Medical Center Göttingen, Goettingen, Germany, 14German Center for Neurodegenerative Diseases (DZNE), Goettingen, Germany, 15Department of Psychiatry and Psychotherapy, Eberhard Karls University, Tuebingen, Germany, 16Aging & Cognition Research Group, German Center for Neurodegenerative Diseases (DZNE), Tuebingen, Germany, 17Department of Psychiatry, University of Cologne, Cologne, Germany, 18Institute of Cognitive Neuroscience, University College London, London, United Kingdom
Synopsis
This abstract presents a processing pipeline developed to automatically assess the quality of specific structural T2-weighted images typically acquired in the study of the hippocampus. By combining existing neuroimaging tools, the presented pipeline generates descriptive information about the signal properties in different tissue classes of the T2-weighted image. This information could subsequently be used to detect sub-optimal volumes due to noise or motion artifacts. Similarly as it measures the angulation of the T2-weighted slices with respect to the HC, it could also be used to automatically determine whether the field of view angulation follows protocol.
Introduction
During the last years there has been a growing interest in understanding the impact of neurodegenerative diseases in the hippocampus (HC) – by following volume changes [1] or understanding its role in different cognitive processes [2]. Due to its particular shape, this analysis is typically carried out by acquiring a high-resolution T2-weighted (T2-w) sequence oriented perpendicularly to the HC’s longitudinal axis. In small, single-site studies, assessing the quality of structural images represents a challenge itself, in which motion artifacts and angulation are the main sources of problem. Obviously, the challenge increases with the number of subjects and becomes of critical importance in large – multisite studies. Recently, different initiatives have developed several strategies to automatically assess the quality of different MR images. [3, 4]. In this study, we present an automatic workflow developed to assess the quality of high resolution T2-w images acquired for HC segmentation as part of the DZNE-DELCODE study [5].Methodology
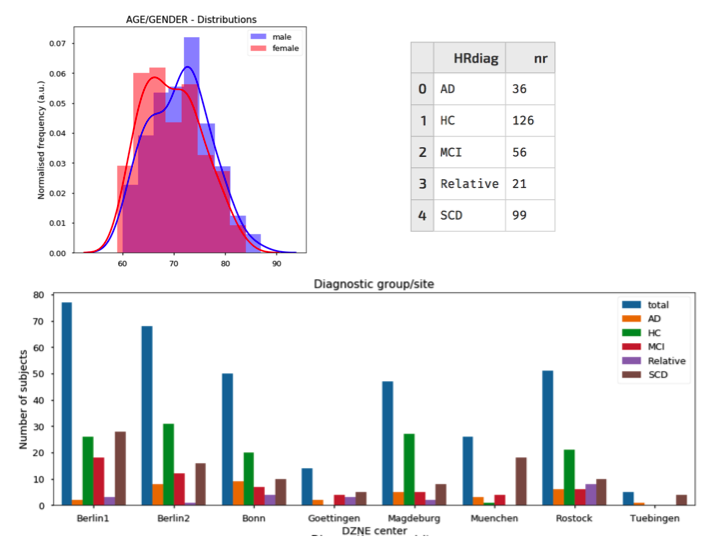
Data corresponding to 338 subjects, part of the initial
release of DELCODE, has been analysed using this pipeline - Figure 1 summarises the cohort's demographic details. Developed in python, making use of different neuroimaging
packages ( fsl, ants and spm)[6, 7, 8] and integrated using Nipype [9], the proposed pipeline
aims to automatically assess the quality of high resolution T2-w images.
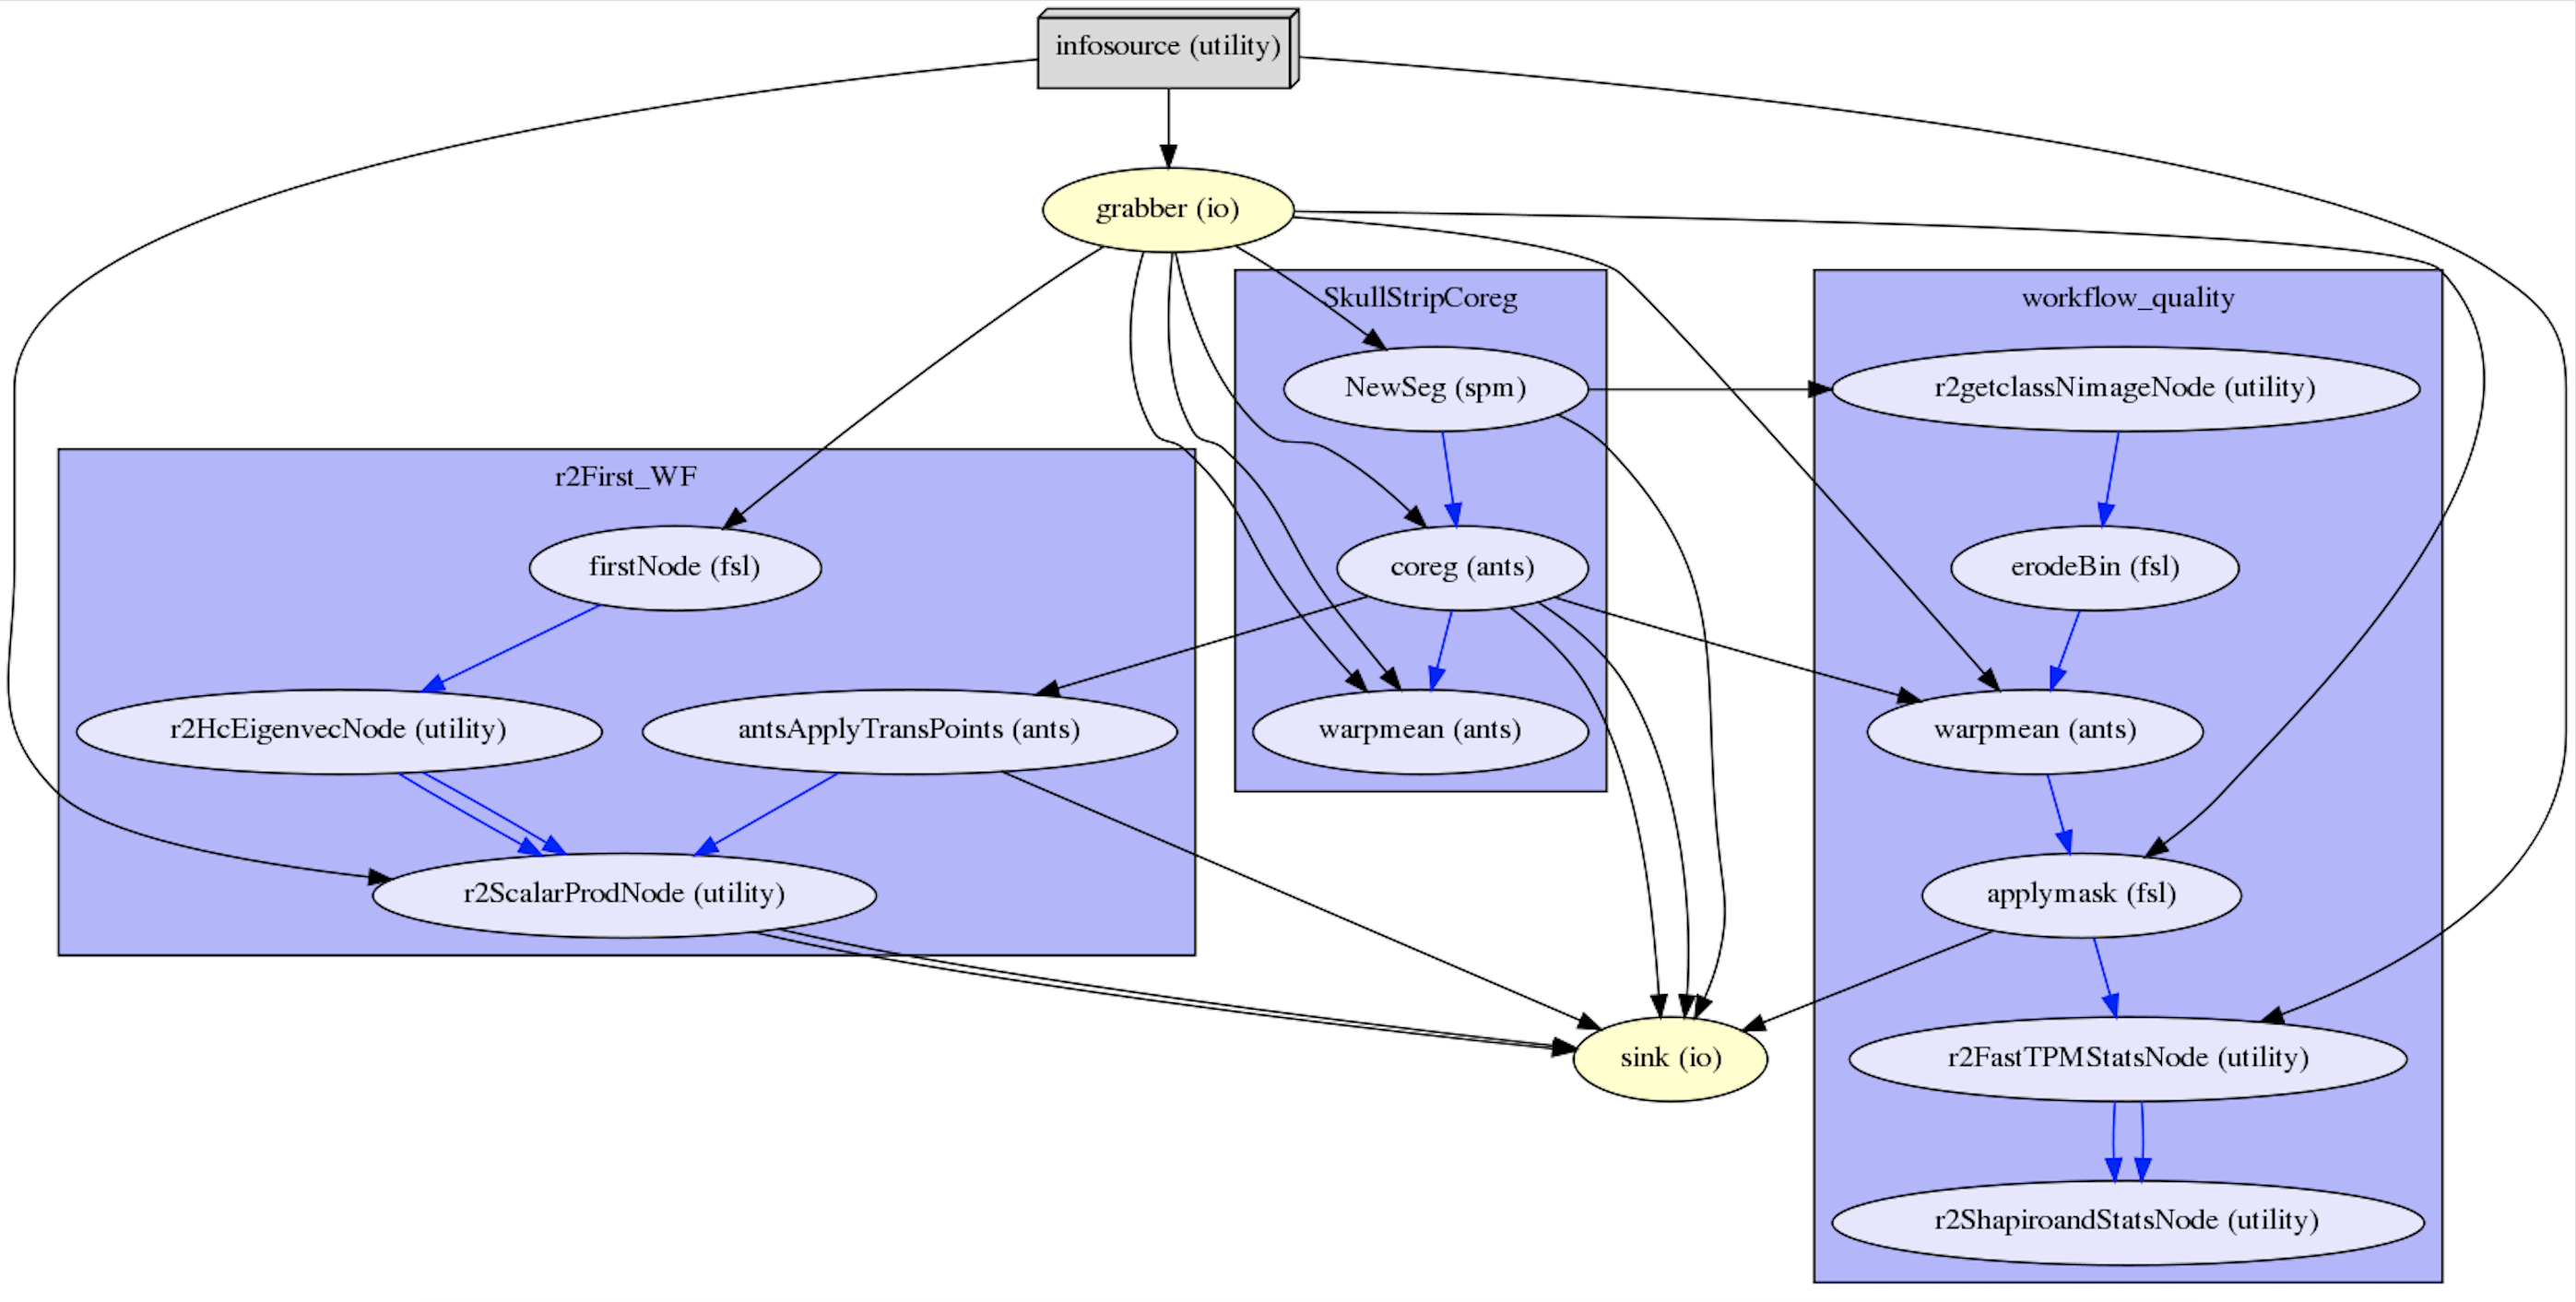
Taking structural a structural whole brain T1 weighted (T1-w) images and high in-plane resolution partial brain T2-w images as
an input, the data goes through an analysis pipeline which interconnect so
called “workflows” in which different data analysis processes take place
(Figure 2). The processing pipeline is divided into three different workflows.
The first one, “SkullStripCoreg” segments the T1-w image using spm and
coregisters it to the T2-w images. The second workflow –
“Workflow_quality”, brings the GM, WM, CSF and background tissue probability
maps obtained in the first workflow into T2 space. Descriptive metrics for each
of these signals are then extracted and stored into a csv file using pandas.
The third workflow “r2First_WF” segments the HC from the T1-w images
using fsl FIRST and estimate the angulation of the T2-w sequence with
respect to the main longitudinal axis of the HC.
The presence of motion and artifacts is assessed by
analysing the signal distribution in the gray matter (GM), white matter (WM)
and backgroung (BG) regions. The angulation of the T2-w images to the HC
is assessed by measuring the angle between a vector normal to the T2-w
slices (information obtained from the dicom header) and the HC's first eigenvector obtained after running principal
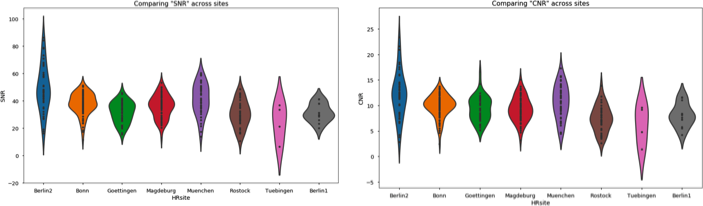
components analysis of the voxels that belong to each of the HC masks. The signal to noise ratio (SNR) and the contrast to noise ratio (CNR) are estimated in the T2-w space as follows.
$$SNR=(mean(GM)/std(BG))$$
$$CNR=(mean(GM)-mean(WM))/std(BG)$$
Results
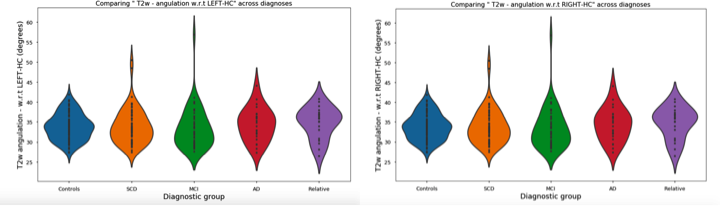
Figure 3 shows the SNR and CNR distribution values, for all subjects, across sites. Even though we expect to have signal variation across sites, the information shown in the figure can be used to identify outliers in each of the sites and flag them for meticulous visual inspection. Figure 4 shows the orientation information of the T2-w sequence with respect to the left and right hippocampi. Ideally, we would expect to find our values distributed around 0 degrees. Nevertheless, the main longitudinal axis of the hippocampus is not contained in a true sagittal plane, its tail is closer to the brain’s midline that its head. We believe this is causing a bias in the orientation measurement which requires further investigation. An ANOVA statistical test was used to assess whether the different in angulation of the T2-weighted slices is different across diagnostic groups. Results were negative for both, left and right HC with p=0.75, f=0.53 and p=0.70, f =0.54 respectively.Discussion
This abstract presents a processing pipeline developed to automatically assess the quality of specific structural T2-w images acquired in the study of the HC as part of the DZNE-DELCODE study. By combining existing neuroimaging tools, the presented pipeline generates descriptive information about the signal properties in different tissue classess of the T2-w image which ultimately can be used to detect sub-optimal volumes due to noise or motion artifacts. Similarly it measures the angulation of the T2-w slices with respect to the structure of interest, the HC. The fact that no significant differences in orientation of the T2-w slices across the groups were found could suggest that this method to determine the HC's longitudinal axes is robust versus atrophy, given that no differences were found between AD and the other diagnostic groups.Acknowledgements
We gratefully thank all the participants in this research study together with our radiographers for their dedicated efforts in scanning standardisation.References
1. Schuff N., et al. MRI of hippocampal volume loss in early Alzheimer's disease in relation to ApoE genotype and biomarkers. Brain - 2009
2. Maas A., Laminar activity in the hippocampus and entorhinal cortex related to novelty and episodic encoding. Nature Communications - 2014
3. Shehzad Z., et al.The Preprocessed Connectomes Project Quality Assessment Protocol - a resource for measuring the quality of MRI data. Frontiers in Neuroscience - 2015.
4. Alfaro-Almagro F., et al. Image processing and Quality Control for the first 10,000 brain imaging datasets from UK Biobank. Neuroimage - 2017
5. Jessen, F., et al. Design and first baseline data of the DZNE multicenter observational study on predementia Alzheimer‘s Disease (DELCODE). Alzheimer‘s Research & Therapy (in press)
6. Patenaude B., et al. A Bayesian Model of Shape and Appearance for Subcortical Brain. NeuroImage - 2011.
7. Avants B., et al. A reproducible evaluation of ANTs similarity metric performance in brain image registration. Neuroimage - 2011
8. Ashburner, J., et al. Unified segmentation.
NeuroImage -
2005.
9.
Gorgolewski K., et al. Nipype: a flexible, lightweight and extensible neuroimaging data
processing framework in Python. Frontiers in Neuroinformatics - 2011
Figures