3128
Regional Differences in Cortical Diffusion MRI Measurements Based on the HCP Dataset1Dept. of Radiology, New York University School of Medicine, NEW YORK, NY, United States
Synopsis
Diffusion MRI (
Introduction
Diffusion MRI (dMRI) has been commonly used to study white matter structures in the brain, including their trajectories and microstructural properties. Recent animal and post-mortem human brain studies suggest that diffusion MRI can also reveal useful information about microstructural organization in gray matter structures, especially the cortex [1-4]. In vivo dMRI of the human cortex has been primarily limited by the spatial resolution of diffusion MRI (~ 2 mm), as the average thickness of the human cortex is 2.5 mm. The human connectome project (HCP) dataset contains co-registered T1 and dMRI data (with an isotropic resolution of 1.25 mm) [5]. As methods to segment cortical and subcortical structures based on T1 MRI have matured over the last decade [6], we investigated regional differences in dMRI measurements among various cortical regions in a subset of the HCP data from healthy volunteers (n = 50). As new parcellation maps based on task and resting-state fMRI have emerged for clinical research [6], additional information on normative values of cortical microstructures from dMRI may be important to augment our understanding of mechanisms underlying normal brain functions and pathology in patients [7].Method
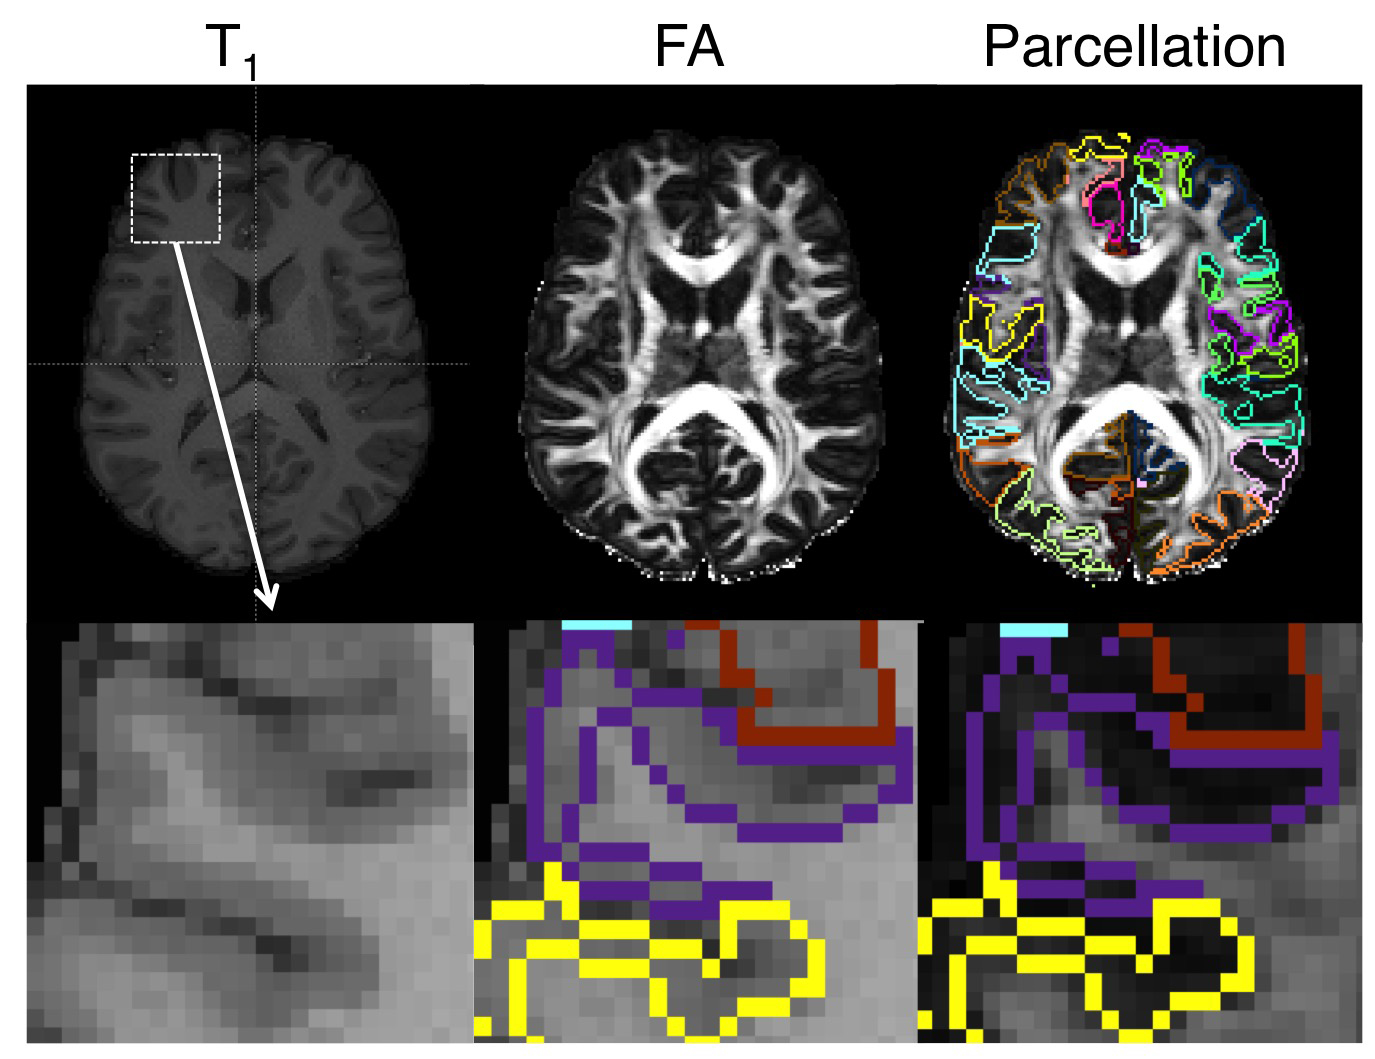
HCP data (MPRAGE (T1) and dMRI data) from 50 healthy subjects were used in this study. The original MPRAGE images have been registered to diffusion space using BBR Cross-model registration [8]). dMRI data were processed using the denoise routine [9] implemented in MRtrix. Maps of mean diffusivity (MD), fractional anisotropy (FA), and mean kurtosis (MK) were computed from the pre-processed dMRI data [10]. The T1 images were parcellated using the automated pipeline at https://www.mricloud.org/. The pipeline first linearly registered individual subject data to the MNI space, followed by multi-atlas registration as described previously [11]). Each subject T1 image was parcellated into 286 regions, including 74 cortical gray matter sub-regions and 176 whiter matter sub-regions. K-mean clustering was used to separate gray matter regions into separate groups based on their mean MD, FA, and MK values.Results
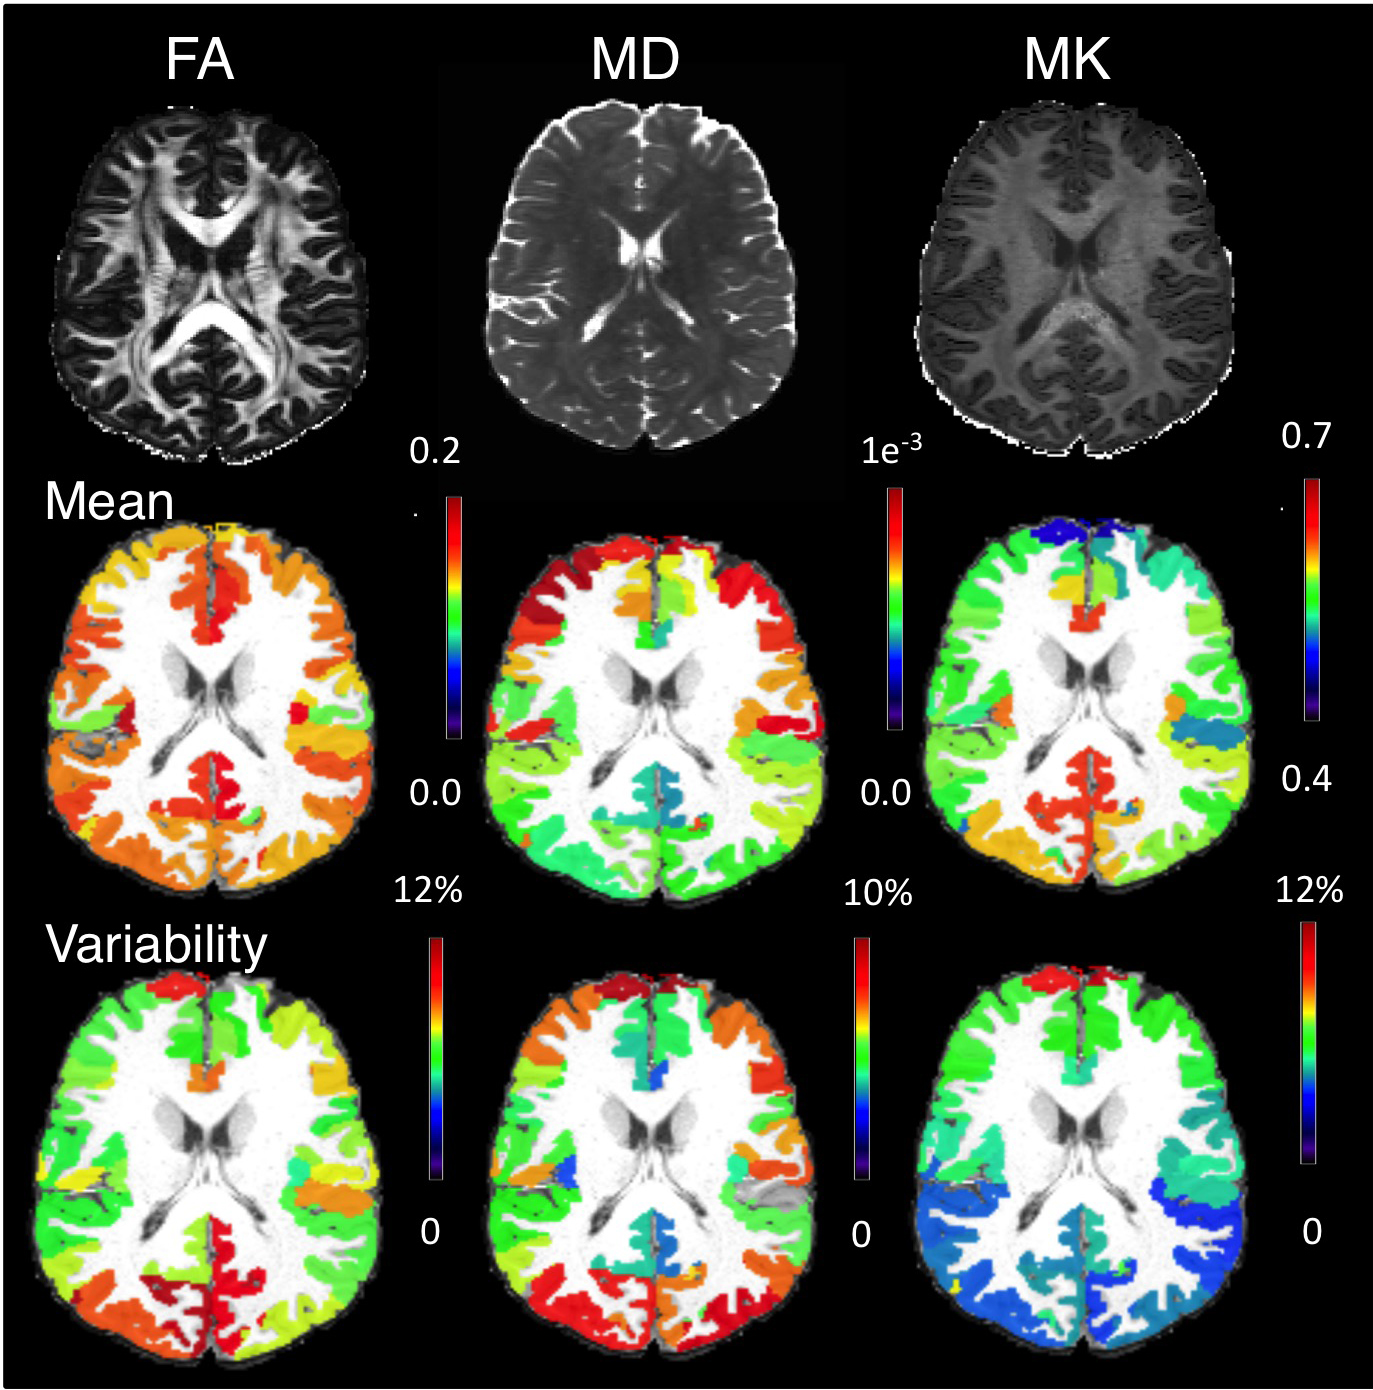
Fig. 1A shows T1-based cortical parcellation overlaid on the corresponding FA image. Among the 50 subjects, 48 subject data showed satisfactory parcellation by visual inspection. The examination of dMRI demonstrated marked regional differences in diffusion metrics. Fig. 2 shows the mean MD, FA, and MK values of each cortical region and the variability of these measurements normalized to the mean values within each region. The cuneus, posterior cingulate cortex, dorsal anterior cingulate cortex and middle occipital gyrus showed corresponding higher variability in FA values, while the superior occipital gyrus, cuneus, and angular gyrus regions showed higher variability in MD values. In contrast, only a few regions such as superior frontal gyrus and middle fronto-orbital gyrus showed relatively higher variability in MK values.
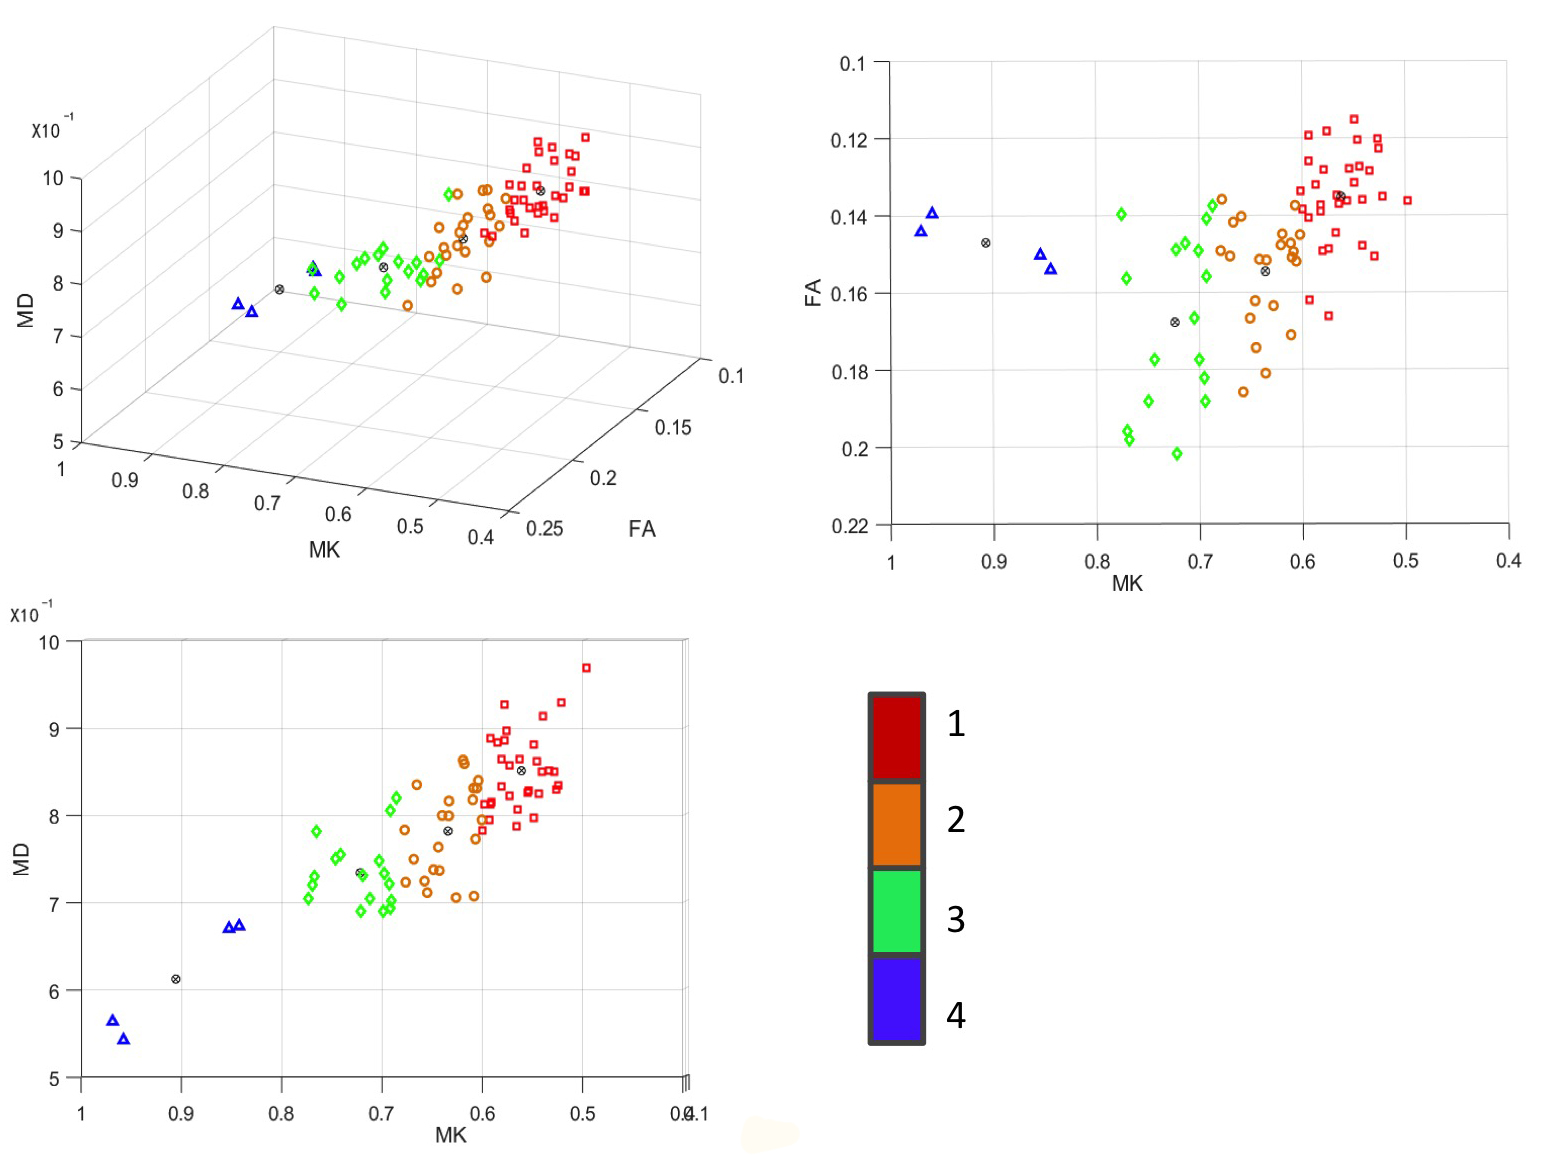
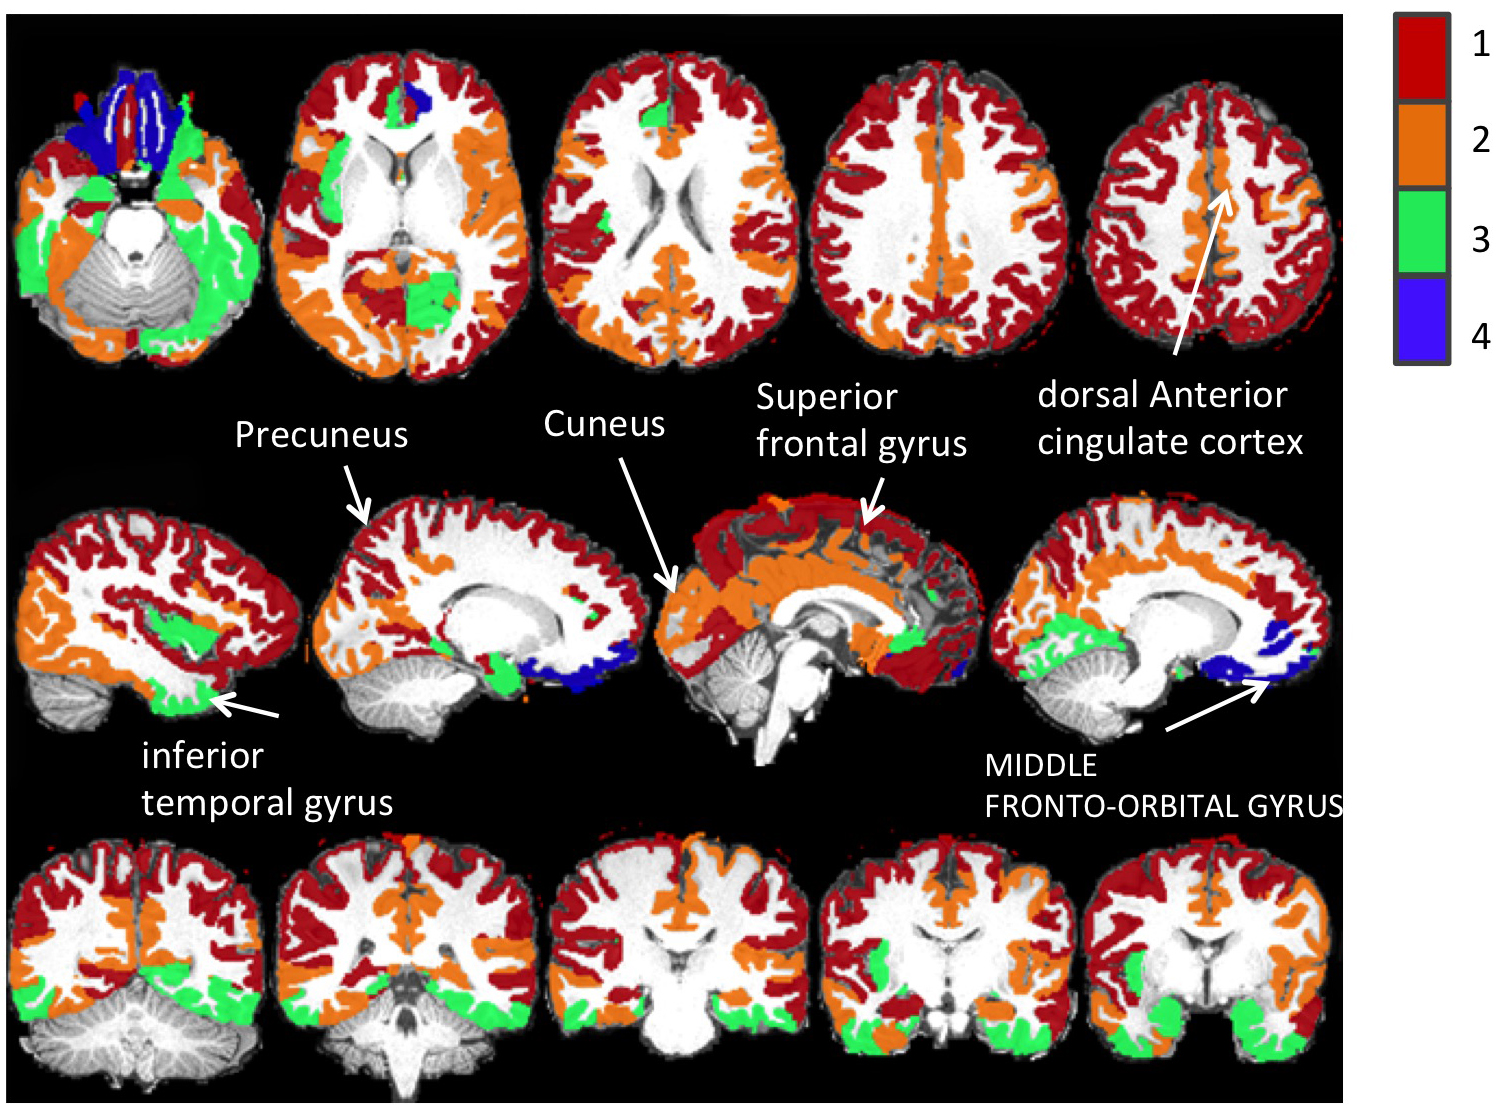
With K-mean clustering, the 74 cortical regions were separated into four groups. Fig. 3 and 4 show the distributions of the mean values of each region in the MD-FA-MK coordinates and in the brain, respectively. The regions show wider spread along MK and MD than along FA. The first group consists of the sensory, motor, frontal, and occipital cortices with relatively high MD, low FA, and high MK values. The second group consists of the cingulate, several temporal lobe cortical regions with medium high MD and MK values, these areas subserve diverse high order cognitive functions. The third group consists of several inferior cortical regions with low medium low MK, medium MD. The last group consists of several cortical regions close to the nasal cavities and is likely affected by distortions and susceptibility artifacts.
Discussions
Cortical parcellation based on T1 MRI permits a satisfactory segmentation of the cortex, however, small discrepancies still exist due to limited resolution and residual distortion. This may reduce our sensitivity to detect regional differences in cortical dMRI measurements. Even though the spatial resolution of HCP dMRI acquisition (1.25 mm isotropic) is a major improvement from commonly used 2-3 mm isotropic resolution, it remains a challenge to reconstruct cortical microstructures as seen in previous post-mortem studies. We used MD, FA, and MK as they represent unique and distinctive tissue diffusion properties, and our results of regional variations demonstrate the feasibility and potential to categorize cortical microstructure based on dMRI metrics in the normal population. We interpret higher or lower values of diffusion parameters as manifestations that the microarchitecture and function in these cortical areas are different. Further investigation is required to identify sensitive dMRI metrics for characterization of cortical microstructures.Conclusions
We present dMRI metric values of 74 parcellated cortical regions and their regional differences in healthy volunteers based on the well-characterized HCP dataset.Acknowledgements
No acknowledgement found.References
1. D’Arceuil H, Liu C, Levitt P, Thompson B, Kosofsky B, de Crespigny A. Three-dimensional high-resolution diffusion tensor imaging and tractography of the developing rabbit brain. Developmental neuroscience 2008;30:262–75.
2. Takahashi E, Dai G, Rosen G, Wang R, Ohki K, Folkerth R, Galaburda A, Wedeen V, Grant E. Developing Neocortex Organization and Connectivity in Cats Revealed by Direct Correlation of Diffusion Tractography and Histology. Cerebral Cortex 2011;21:200–211.
3. Leuze CW, Anwander A, Bazin P-L, Dhital B, Stüber C, Reimann K, Geyer S, Turner R. Layer-specific intracortical connectivity revealed with diffusion MRI. Cerebral cortex 2012;24:328–339.
4. Miller K, Stagg C, Douaud G, et al. Diffusion imaging of whole, post-mortem human brains on a clinical MRI scanner. NeuroImage 2011;57:167–181.
5. Setsompop, Kimmlingen, Eberlein, et al. Pushing the limits of in vivo diffusion MRI for the Human Connectome Project. NeuroImage 2013;80:220–33.
6. Glasser M, Coalson T, Robinson E, Hacker C, Harwell J, Yacoub E, Ugurbil K, Andersson J, Beckmann C, Jenkinson M. A multi-modal parcellation of human cerebral cortex. Nature 2016;536:171–178
7. McNab J, Polimeni J, Wang R, et al. Surface based analysis of diffusion orientation for identifying architectonic domains in the in vivo human cortex. NeuroImage 2013;69:87–100
8. Matthew, F.Glassera; Stamatios, N.Sotiropoulosb; J. AnthonyWilsonc et al. The minimal preprocessing pipelines for the Human Connectome Project. NeuroImage, 2013, 80,105-124
9. J. Veraart, D.S. Novikov, D. Christiaens, B. Ades-aron, J. Sijbers, and E. Fieremans Denoising of diffusion MRI using random matrix theory. NeuroImage, 2016, 142, 394-406
10. Veraart, J., Sijbers, J., Sunaert, S., Leemans, A. and Jeurissen, B., Weighted linear least squares estimation of diffusion MRI parameters: strengths, limitations, and pitfalls. NeuroImage, 2013, 81, 335-346.
11. Tang X.Y., Yoshida S., Hsu J., et al., Multi-contrast multi-atlas parcellation of diffusion tensor imaging of the human brain. PLoS One, 2014, 9(5):e96985.
Figures