3127
Comparison study of Visualization of Low Intensity Spots between Susceptibility Weighted Imaging and Quantitative Susceptibility Mapping Created from the Same Raw Phase1Department of Diagnostic Imaging and Nuclear Medicine, Kyoto University Graduate School of Medicine, Kyoto, Japan, 2Human Brain Research Center, Kyoto University Graduate School of Medicine, Kyoto, Japan, 3Siemens Healthcare Japan K. K., Tokyo, Japan
Synopsis
This study was conducted to evaluate the contrast of microbleeds between SWI and QSM created from the identical raw phase of SWI. QSM was created by using STI Suite. The contrast between low intensity spot on SWI and the surrounding brain parenchyma was significantly higher in QSM than SWI.
Introduction
Many molecular compounds such as hemosiderin can significantly affect the tissue susceptibility and the resultant resonance frequency shift in brain MRI. Quantitative susceptibility mapping (QSM) has been used to provide quantitative information of tissue susceptibility by solving the non-local relationship between magnetic perturbation and susceptibility [1]. QSM is usually created from multi-TE gradient sequence for better estimation of susceptibility and increase of SNR.
Susceptibility weighted imaging (SWI) has been widely used to visualize venous blood, microbleeds in clinical practices. SWI is created by combining both magnitude and phase in the gradient echo data as follows: phase mask was created from high-pass filtered phase image, and magnitude images were multiplied by filtered phase mask by 4 times. In clinical settings, SWI, and minimum intensity projection (minIP) of SWI, and filtered phase were often used for evaluation. SWI shows nice visualization of details of brain anatomical structure as well as iron and calcium deposition thanks to its high-resolution contrast. On the contrary, it is rare to see QSM in clinical practices.
Toward better understanding of QSM and SWI, especially in clinical practices, it is important to compare QSM and SWI from the identical image source. The purpose of this study is to evaluate the contrast of microbleeds between SWI and QSM created from the identical raw phase of SWI.
Materials and Methods
- Subjects
Patients with low intensity spots detected on SWI were retrospectively included in this study. This study was approved by the institutional review board.
- MR imaging
Patients underwent MR imaging at 3T MR scanners (MAGNETOM Skyra or Prisma, Siemens Healthcare GmbH, Erlangen, Germany) with a 32- or 64- channel head coil. The imaging protocol of SWI were as follows: axial acquisition; TR/TE, 28 ms/20 ms; flip angle, 15°; FOV, 320×230 mm; resolution, 0.72×0.72 mm; slice thickness, 1mm; acquisition time, 4 m 44 s; GRAPPA 2×.
- QSM calculation
QSM calculation was conducted by using the STI Suite. Raw phase image of the SWI sequence was used and phase mask images were generated from magnitude images by threshold for background phase removal. For phase unwrapping and background phase removal, a SHARP method with a variable radius of the spherical kernel at the brain boundary (V-SHARP) was conducted, then QSM was calculated from each local tissue phase by solving an inverse problem using the iLSQR method (an algorithm for sparse linear equations and sparse least squares) [2].
- ROI analysis
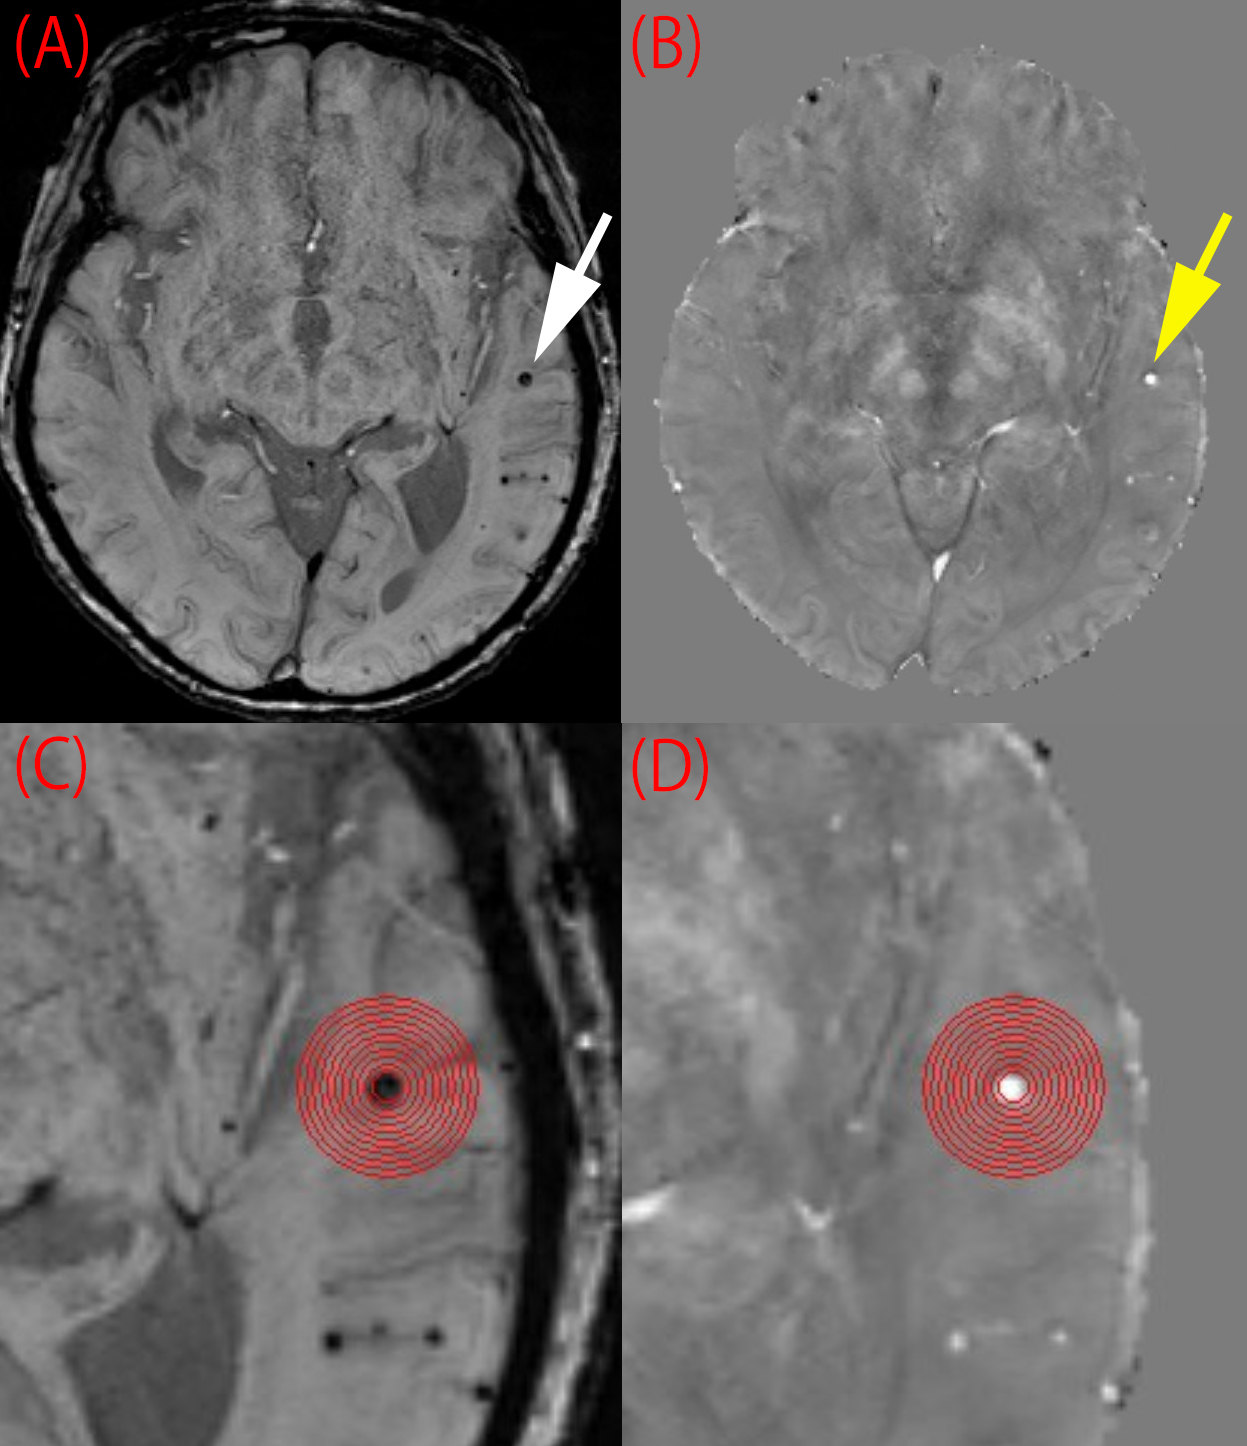
One low intensity spot on SWI was chosen for one patient. A circular ROI was placed by covering a low intensity spot (ImageJ, https://imagej.nih.gov/ij/). Concentric circular ROIs whose radius increases in 0.7 mm increment from the low intensity spot ROI were also created to evaluate the surrounding brain parenchyma which do not include low intensity spot on SWI (Fig 1).
Contrast of between low intensity spot and surrounding parenchyma was evaluated for each concentric ROI as follows:
|Low Intensity Spot -Surrounding Parenchyma|/ Entire ROI
Note that entire ROI corresponds to the ROI which include both low intensity spot on SWI and surrounding parenchyma. The same ROIs were applied on QSM. Contrast of low intensity spot on SWI and surrounding parenchyma were evaluated between SWI and QSM in this manner.
Results
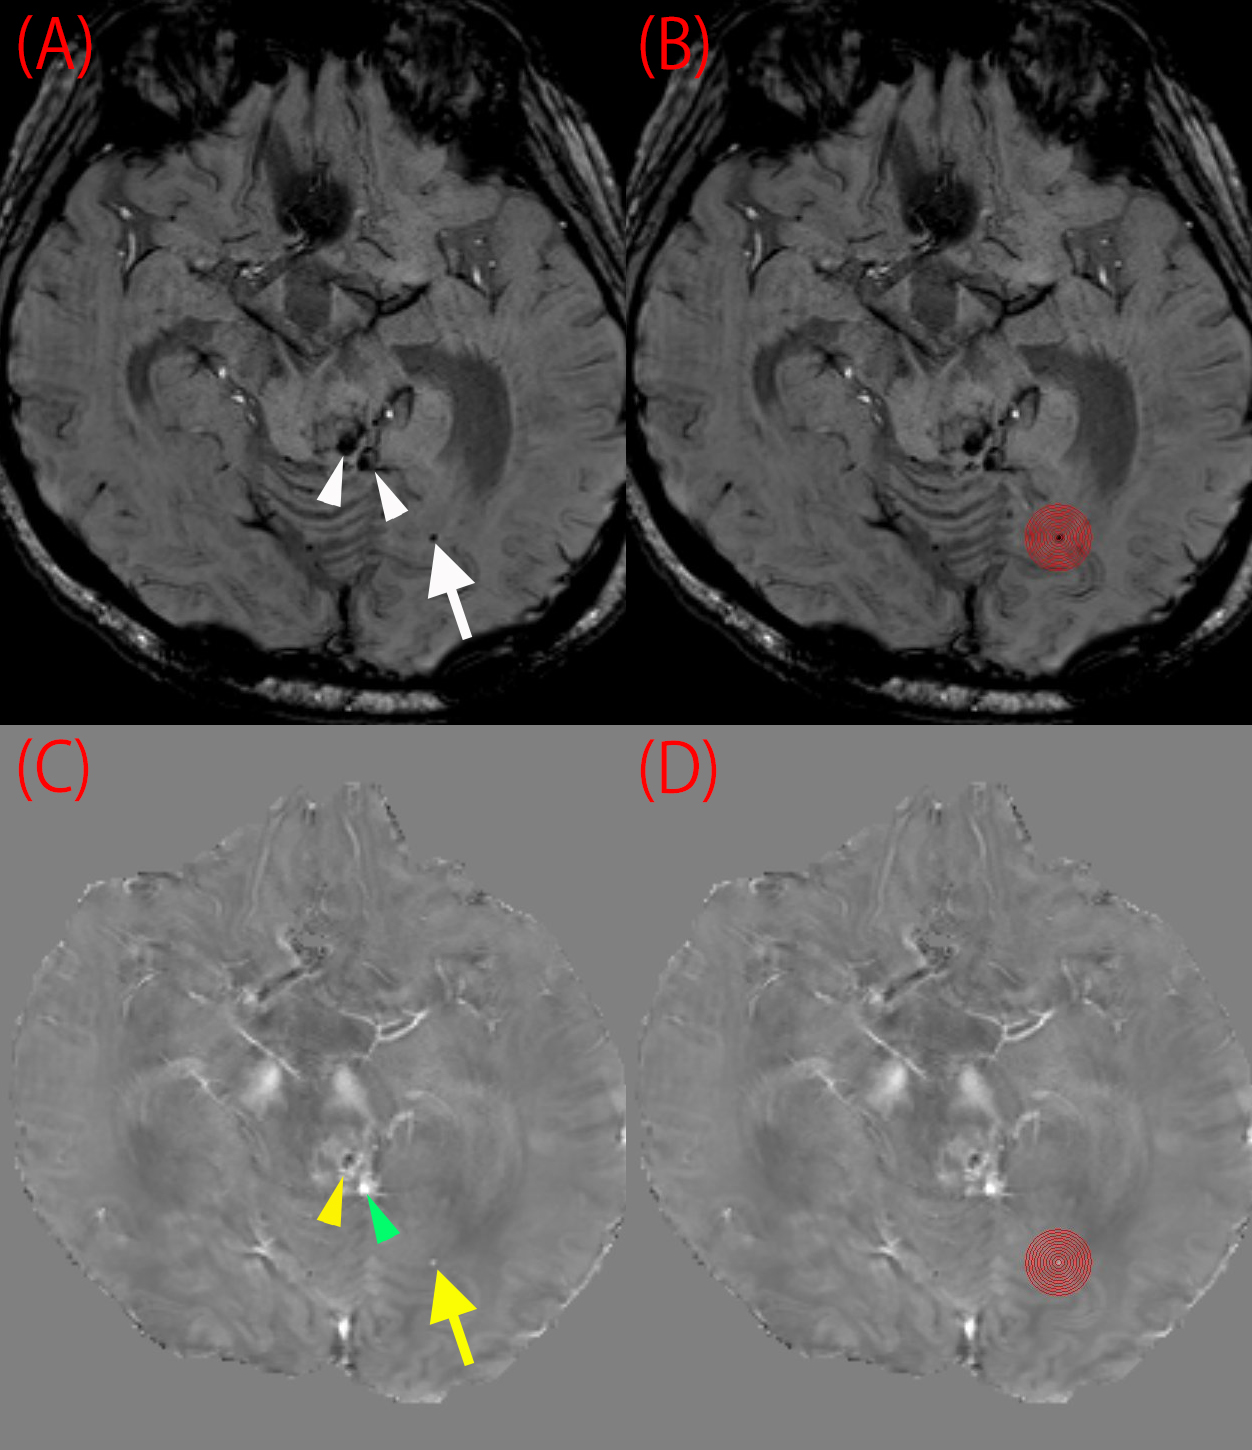
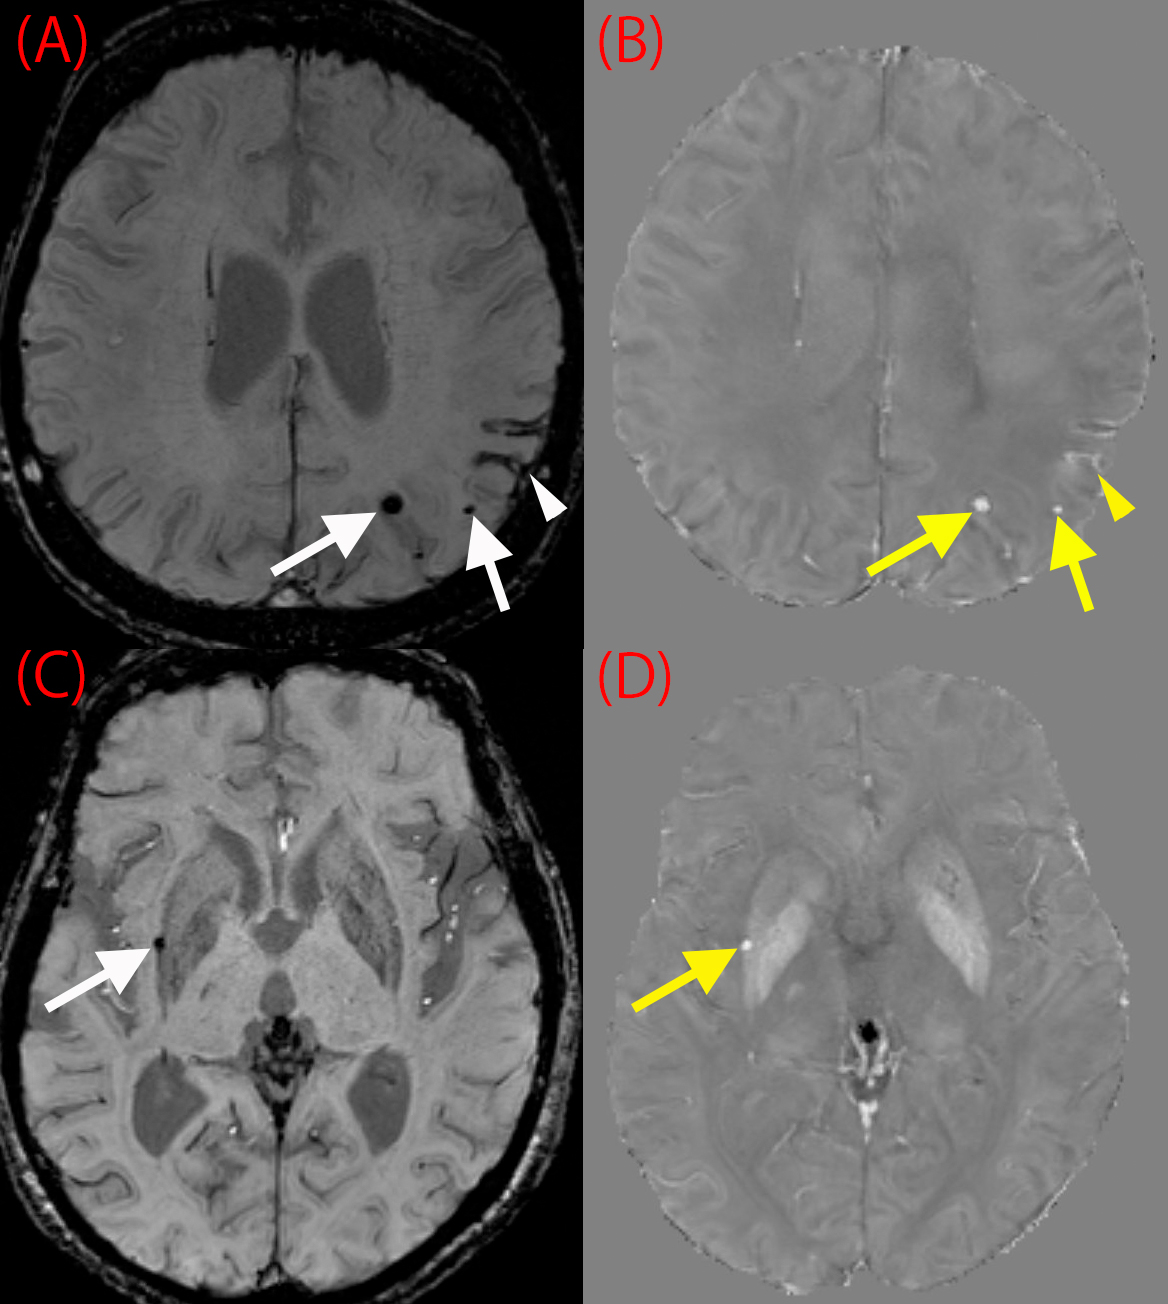
Low intensity spots on SWI were found in 15 patients of total 30 patients (Fig 2, Fig 3). The area of the circular ROI was 4.65 ± 2.84 mm2. Susceptibility value of low intensity spots on SWI calculated from QSM was 0.16 ± 0.15 ppm.
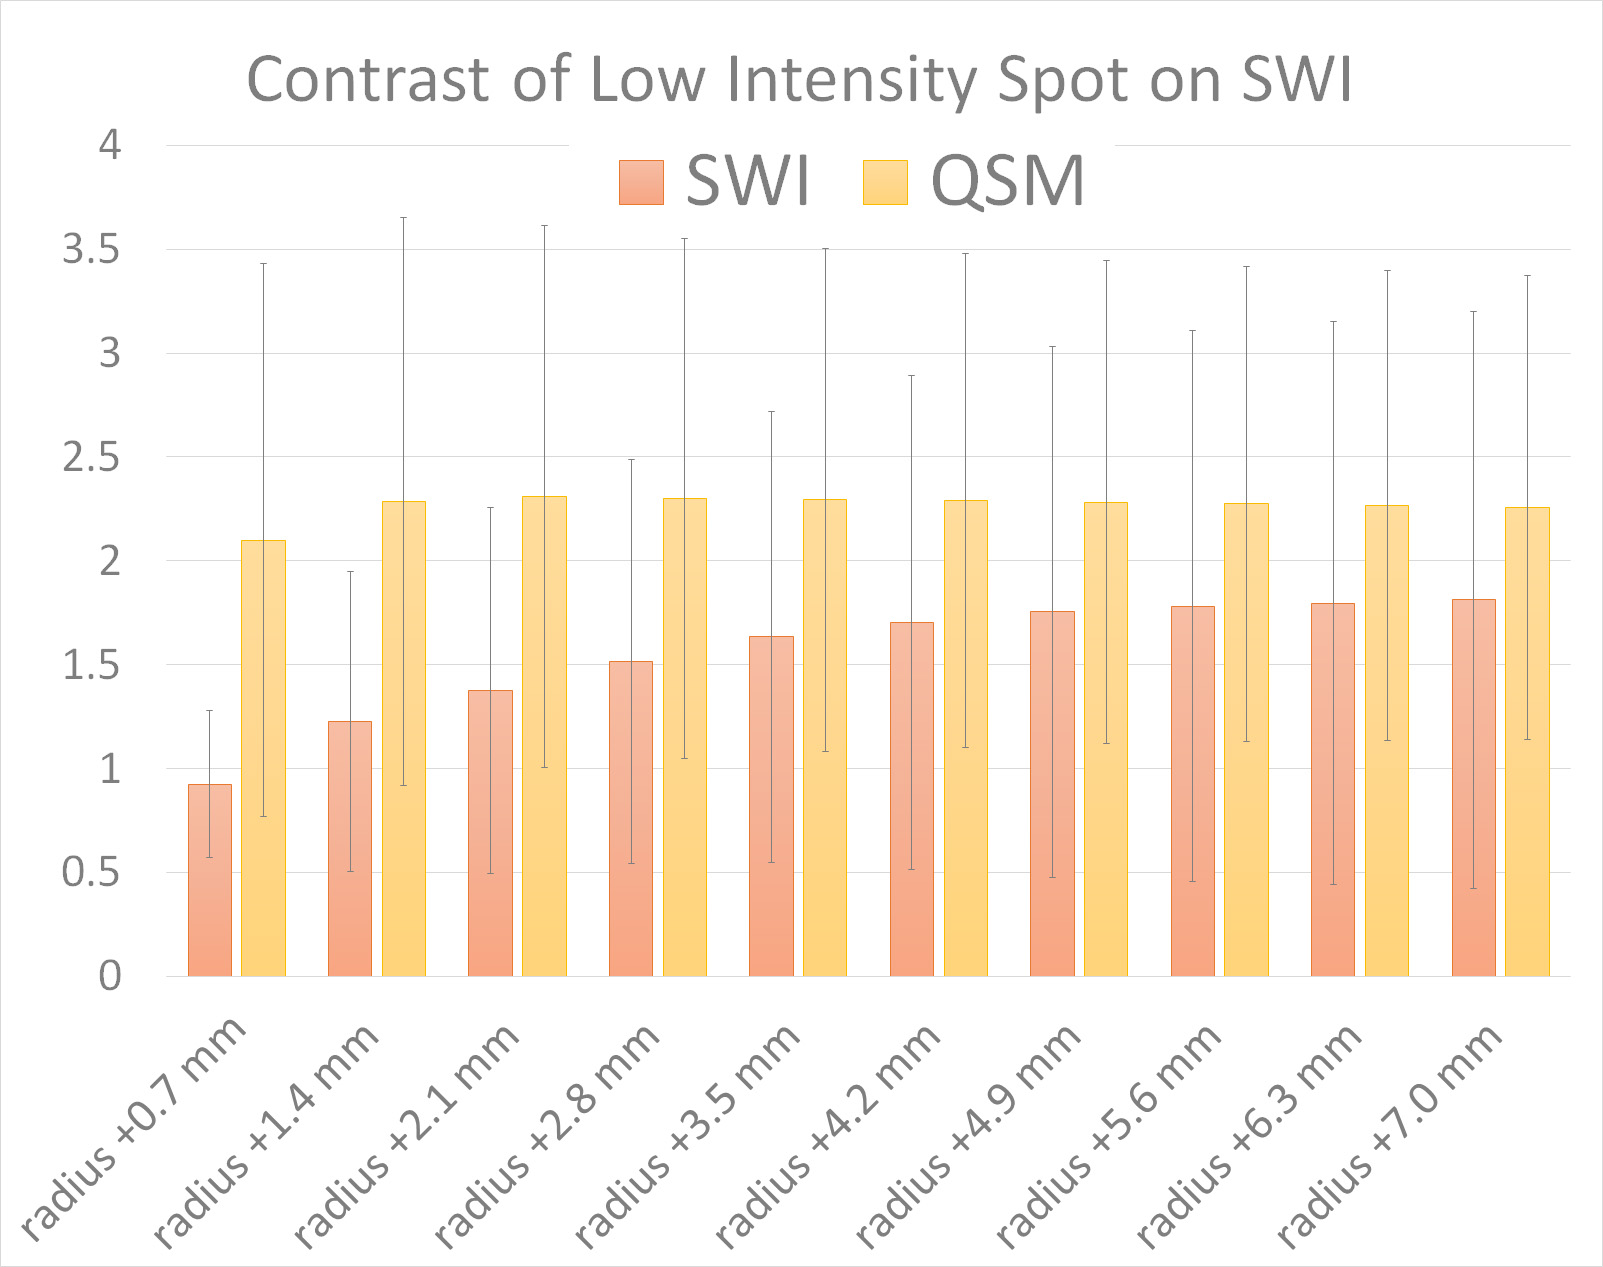
Contrast of low intensity spot on SWI of SWI was lower than that of QSM in each concentric ROI (Fig 4). Statistical significance was seen in the circular ROI, radius +0.7 mm (SWI, 0.92 ± 0.36; QSM, 2.10 ± 1.33; P=0.011) and the circular ROI, radius +1.4 mm (SWI, 1.23 ± 0.72; QSM, 2.29 ± 1.36; P=0.038).
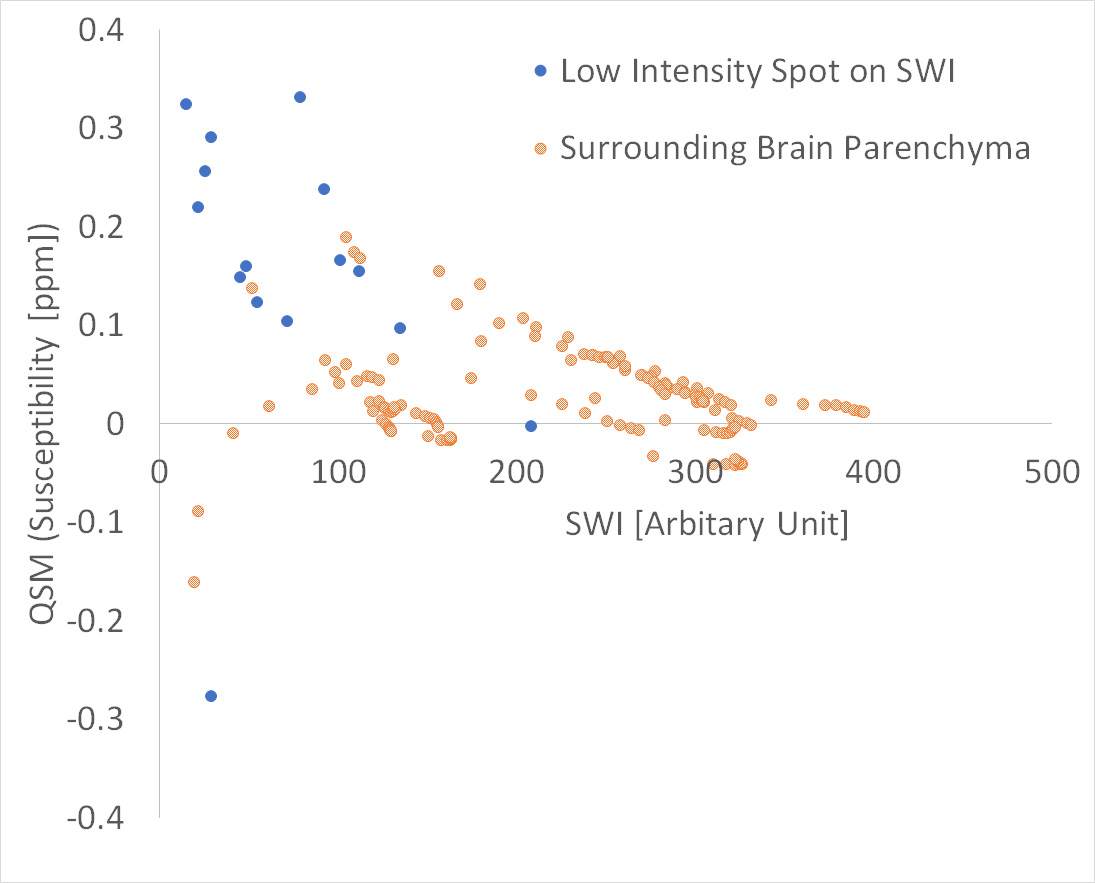
Scattered plots of values of low intensity spot on SWI and the surrounding parenchyma are shown in Fig 5. SWI and QSM of low intensity spot on SWI without negative susceptibility were weakly correlated (R² = 0.25), and if negative susceptibility values are included, R² = 0.06.
Discussion
The contrast between low intensity spot on SWI and the surrounding brain parenchyma was significantly higher in QSM than SWI. QSM is expected to show susceptibility values of vessels as well as brain parenchyma [3][4], high resolution gradient echo image has a potential for evaluation of vessels. Detection of microbleeds or low intensity spots on SWI are important in evaluation of cerebrovascular disease, hypertension and dementia, and better contrast between surrounding tissue is preferable. QSM shows better contrast compared with SWI, therefore, QSM will help radiologists to detect microbleeds.
Acknowledgements
We are grateful to Mr. Katsutoshi Murata and Mr. Hirokazu Kawaguchi, Siemens Healthcare Japan K. K. for their kind help.References
1. Liu C, Li W, Tong KA, Yeom KW, Kuzminski S. Susceptibility-weighted imaging and quantitative susceptibility mapping in the brain. J Magn Reson Imaging. 2015 Jul;42(1):23-41.
2. Li W, Avram AV, Wu B, Xiao X, Liu C. Integrated Laplacian-based phase unwrapping and background phase removal for quantitative susceptibility mapping. NMR Biomed. 2014 Feb;27(2):219-27.
3. Xu B, Liu T, Spincemaille P, Prince M, Wang Y. Flow compensated quantitative susceptibility mapping for venous oxygenation imaging. Magn Reson Med. 2014 Aug;72(2):438-45.
4. Wu D, Liu S, Buch S, Ye Y, Dai Y, Haacke EM. A fully flow-compensated multiecho susceptibility-weighted imaging sequence: The effects of acceleration and background field on flow compensation. Magn Reson Med. 2016 Aug;76(2):478-89.
Figures