3126
Thalamus in schizophrenia revisited: a partial-volume estimation study1Service of General Psychiatry, Department of Psychiatry, Centre Hospitalier Universitaire Vaudois (CHUV) and University of Lausanne (UNIL), Lausanne, Switzerland, 2Center for Psychiatric Neuroscience, Department of Psychiatry, Centre Hospitalier Universitaire Vaudois (CHUV) and University of Lausanne (UNIL), Lausanne, Switzerland, 3Department of Radiology, Centre Hospitalier Universitaire Vaudois (CHUV) and University of Lausanne (UNIL), Lausanne, Switzerland, 4Medical Image Analysis Laboratory (MIAL), Centre d'Imagerie BioMédicale (CIBM), Lausanne, Switzerland, 5Advanced Clinical Imaging Technology, Siemens Healthcare AG, Lausanne, Switzerland, 6Signal Processing Laboratory (LTS 5), École Polytechnique Fédérale de Lausanne (EPFL), Lausanne, Switzerland
Synopsis
The thalamus has a central role in the pathophysiology of schizophrenia. Formed by several nuclei, it is mainly constituted by a mixture of grey and white matter and, thus, its MR signal is heavily affected by the partial volume (PV) effect. We hypothesize that tissue segmentation based on a PV model will better depict subtle changes in schizophrenia patients than total thalamus volume or local tissue volume measurements that do not consider PV. Results show statistically significant changes in gray matter and white matter average concentration from PV model within the thalamus in schizophrenia patients (SCHZ) compared to healthy controls (HC).
Introduction
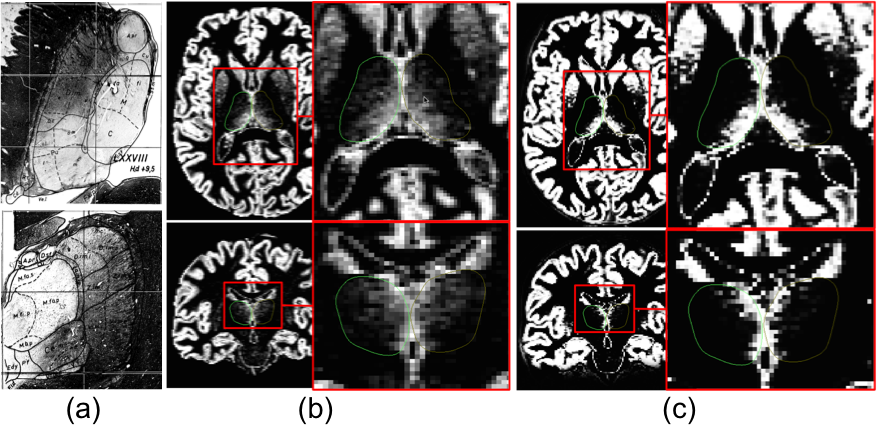
Schizophrenia is a neurodevelopmental disease arising from complex interactions between genetic and environmental factors that cause brain disconnectivity within core brain networks including the thalamus. Some structural Magnetic Resonance Imaging (MRI) studies revealed reduced thalamic volume in SCHZ compared to HC, other studies did not find volume differences, and some studies even found increased volumes in SCHZ1. Accurate volume estimation and segmentation of the thalamus based on T1-weigthed MRI is challenging, because its intensity contrast does not allow for clear thalamic borders distinction. Moreover, the thalamus is a mixture of grey matter (GM) and white matter (WM) tissues (Figure 1a). In this work, we aim at studying the thalamus in SCHZ patients by taking into account its partial volume (PV) characteristics. We apply a recent PV tissue segmentation prototype2 that has been previously validated in healthy and clinical populations (such as Alzheimer’s disease2 and Multiple Sclerosis3,4).Material and Methods
Twenty-four SCHZ were recruited from the Service of General Psychiatry (Lausanne University Hospital, Switzerland) (40.4±9.01yo; 18/6 males/females) and 27 HC (37.7±7.95yo; 18/9 males/females). MRI was performed on a 3-Tesla scanner (MAGNETOM Trio a Tim system, Siemens Healthcare, Erlangen, Germany) equipped with a 32-channel head coil. Each scanning session included a magnetization-prepared rapid acquisition gradient echo (MPRAGE) T1-weighted sequence with 1 mm in-plane resolution and 1.2 mm slice thickness, covering 240×257×160 voxels, and a diffusion spectrum imaging (DSI) sequence (q4half scheme, maximum b-value 8000 s/mm2, TR/TE=6100/144ms, voxel size 2.2x2.2x3mm3). DSI were pre-processed for head motion, eddy current and EPI distortion artifacts correction using the FMRIB's toolbox. The gFA values were computed from the orientational distribution functions (QBOOT).
Thalamus segmentation – Thalamus segmentation was done with an in house-pipeline5. Briefly, images were processed with Freesurfer v5.0.0 to obtain the thalamus mask which was afterwards refined to remove voxels within the ventricles (with CSF-probability greater than 5%, computed by SPM8) or overlapping the internal capsule (with gFA-value, calculated from DSI, higher than 0.55)5. Total volumes of right and left thalamus were derived from both initial Freesurfer and refined masks.
Tissue segmentation – Images were first skull-stripped7 and bias-corrected8. Then, we used a PV estimation method1,3 that models voxel intensity as the sum of GM and WM global characteristic intensities weighted by their respective local concentrations, CGM and CWM, with Gaussian noise. The PV algorithm was then applied with the default parameters2. Average concentration maps within the thalamus were then computed (<CGM>, <CWM>).
For comparison purposes, we also applied a state-of-the-art tissue segmentation (SPM8-New Segment). We then multiply the obtained GM and WM tissue probability maps (TPMs) with the voxel volume to obtain the average GM and WM volumes within the thalamus (<VGM>, <VWM>).
Although PV concentration and tissue probability maps both range between 0 and 1, they do not have the same meaning: voxels with a high posterior probability to belonging to a tissue type might have only an average concentration of that tissue. Moreover, TPMs in SPM are derived from prior probabilities given by statistical atlases of brain tissues while no atlas priors are used in the PV method.
Group comparison statistics – Statistical analysis were performed in SPSS. Paired t-tests were applied on PV concentration vs. SPM maps. General Linear Models were estimated with outcome measures (<CGM>, <CWM>, <VGM>, <VWM>) as dependent variables, group membership as a fixed factor (HC vs. SCHZ) and age and gender as covariates.
Results
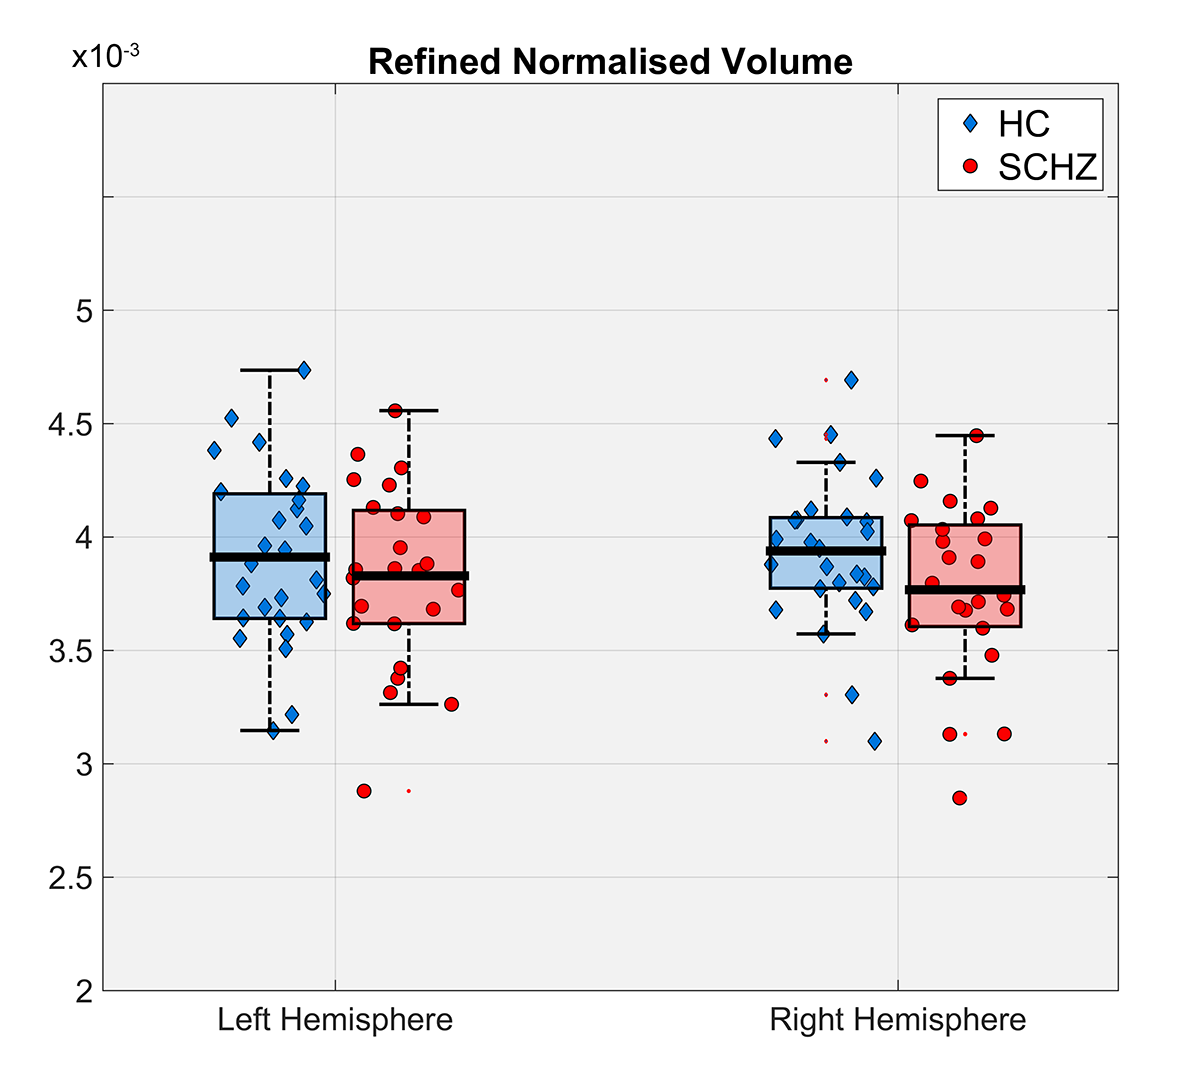
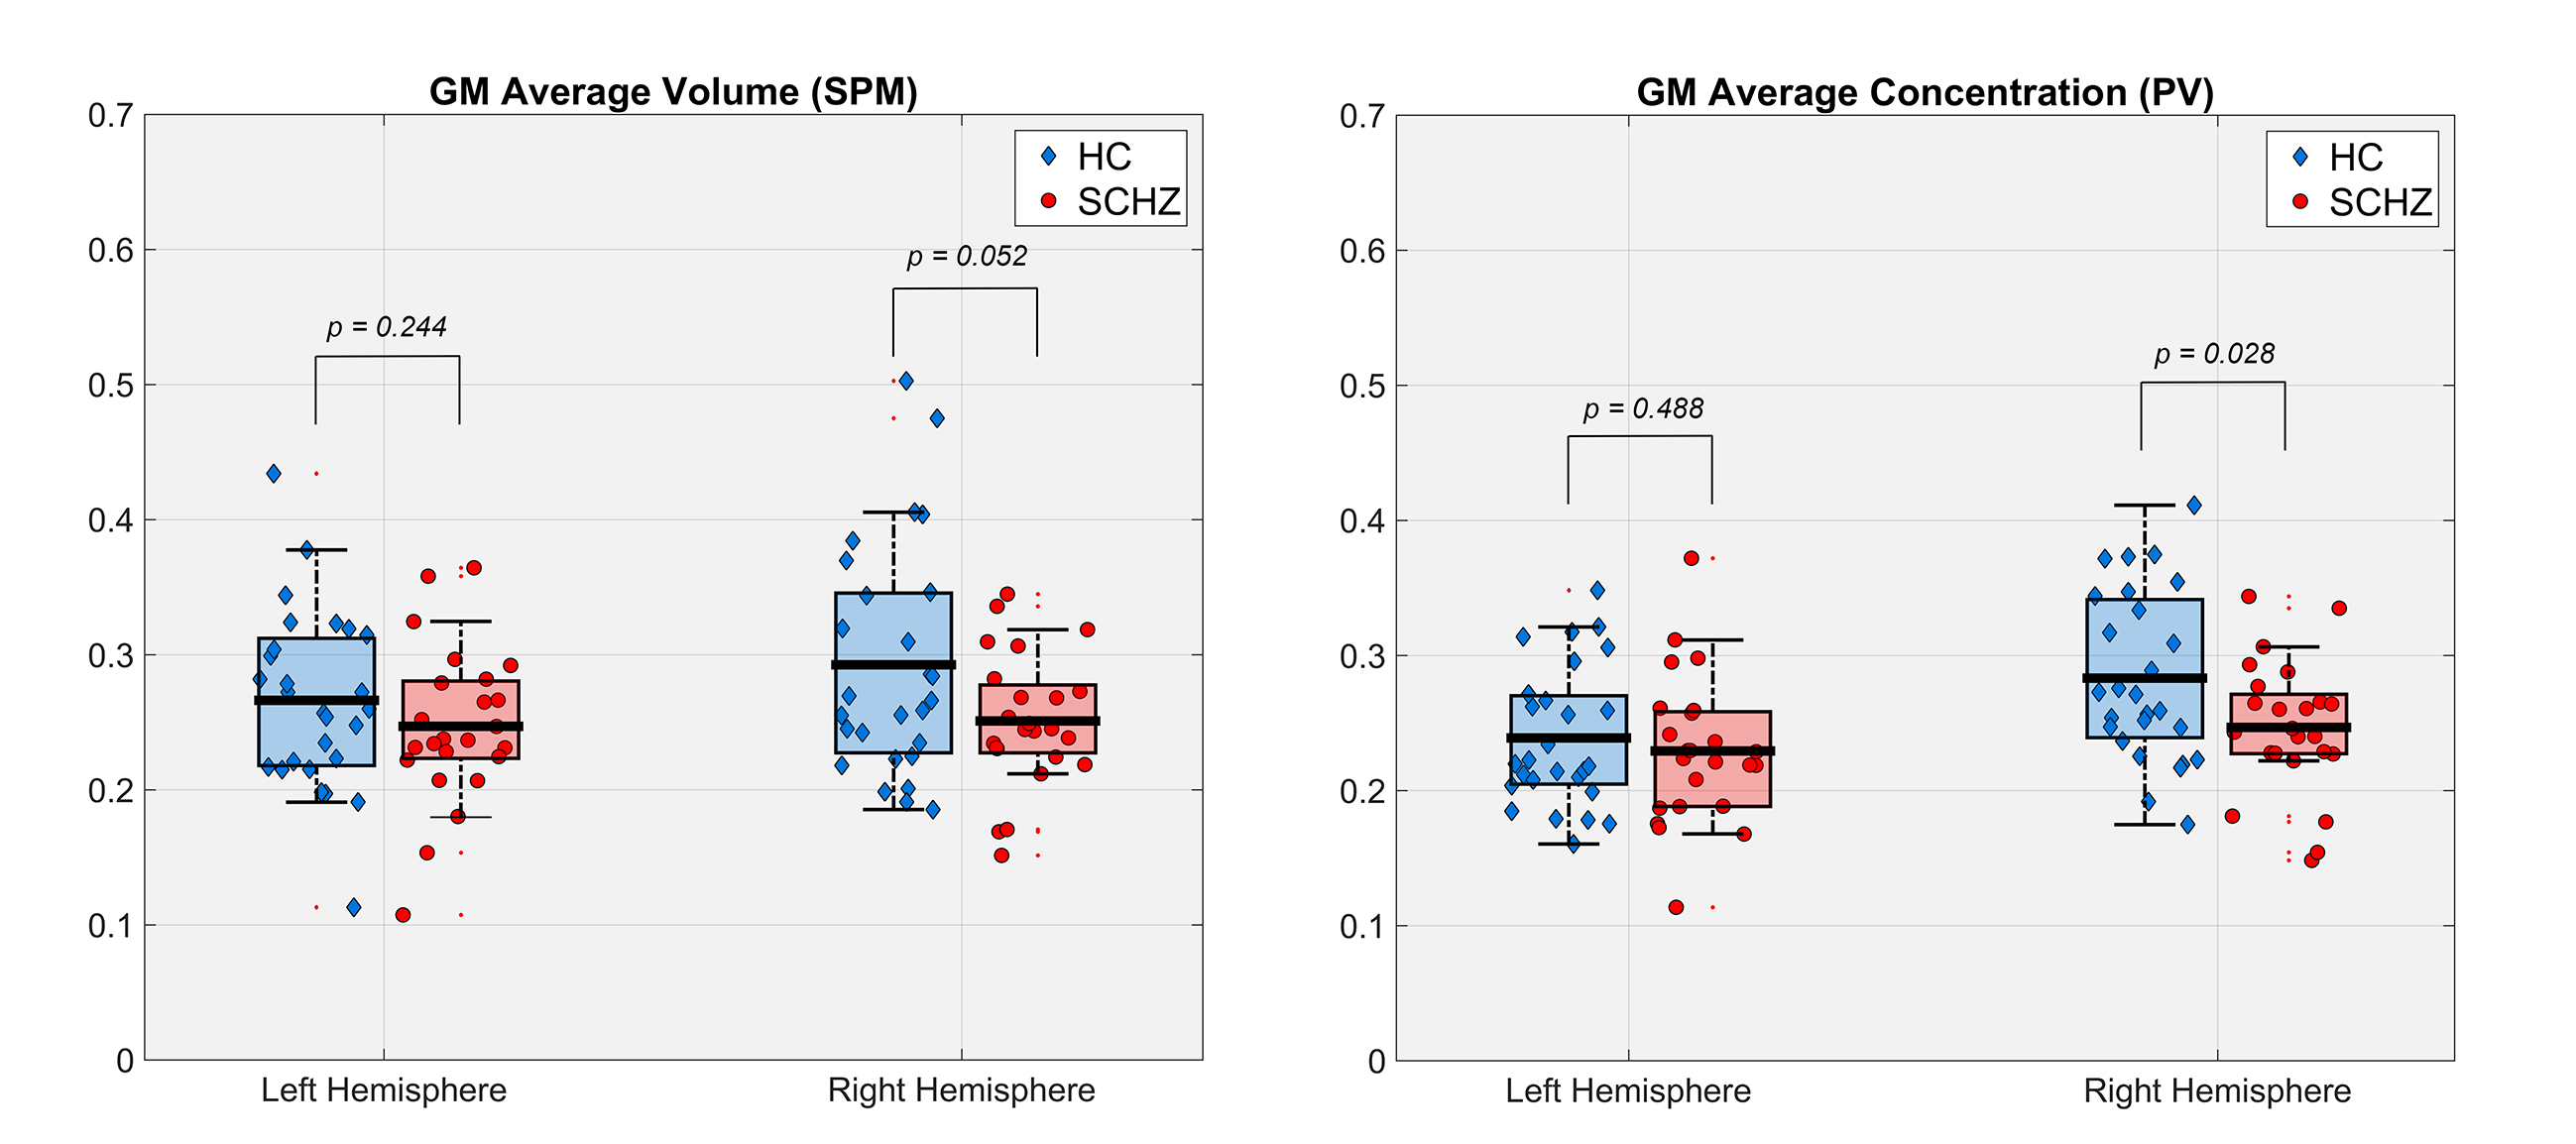
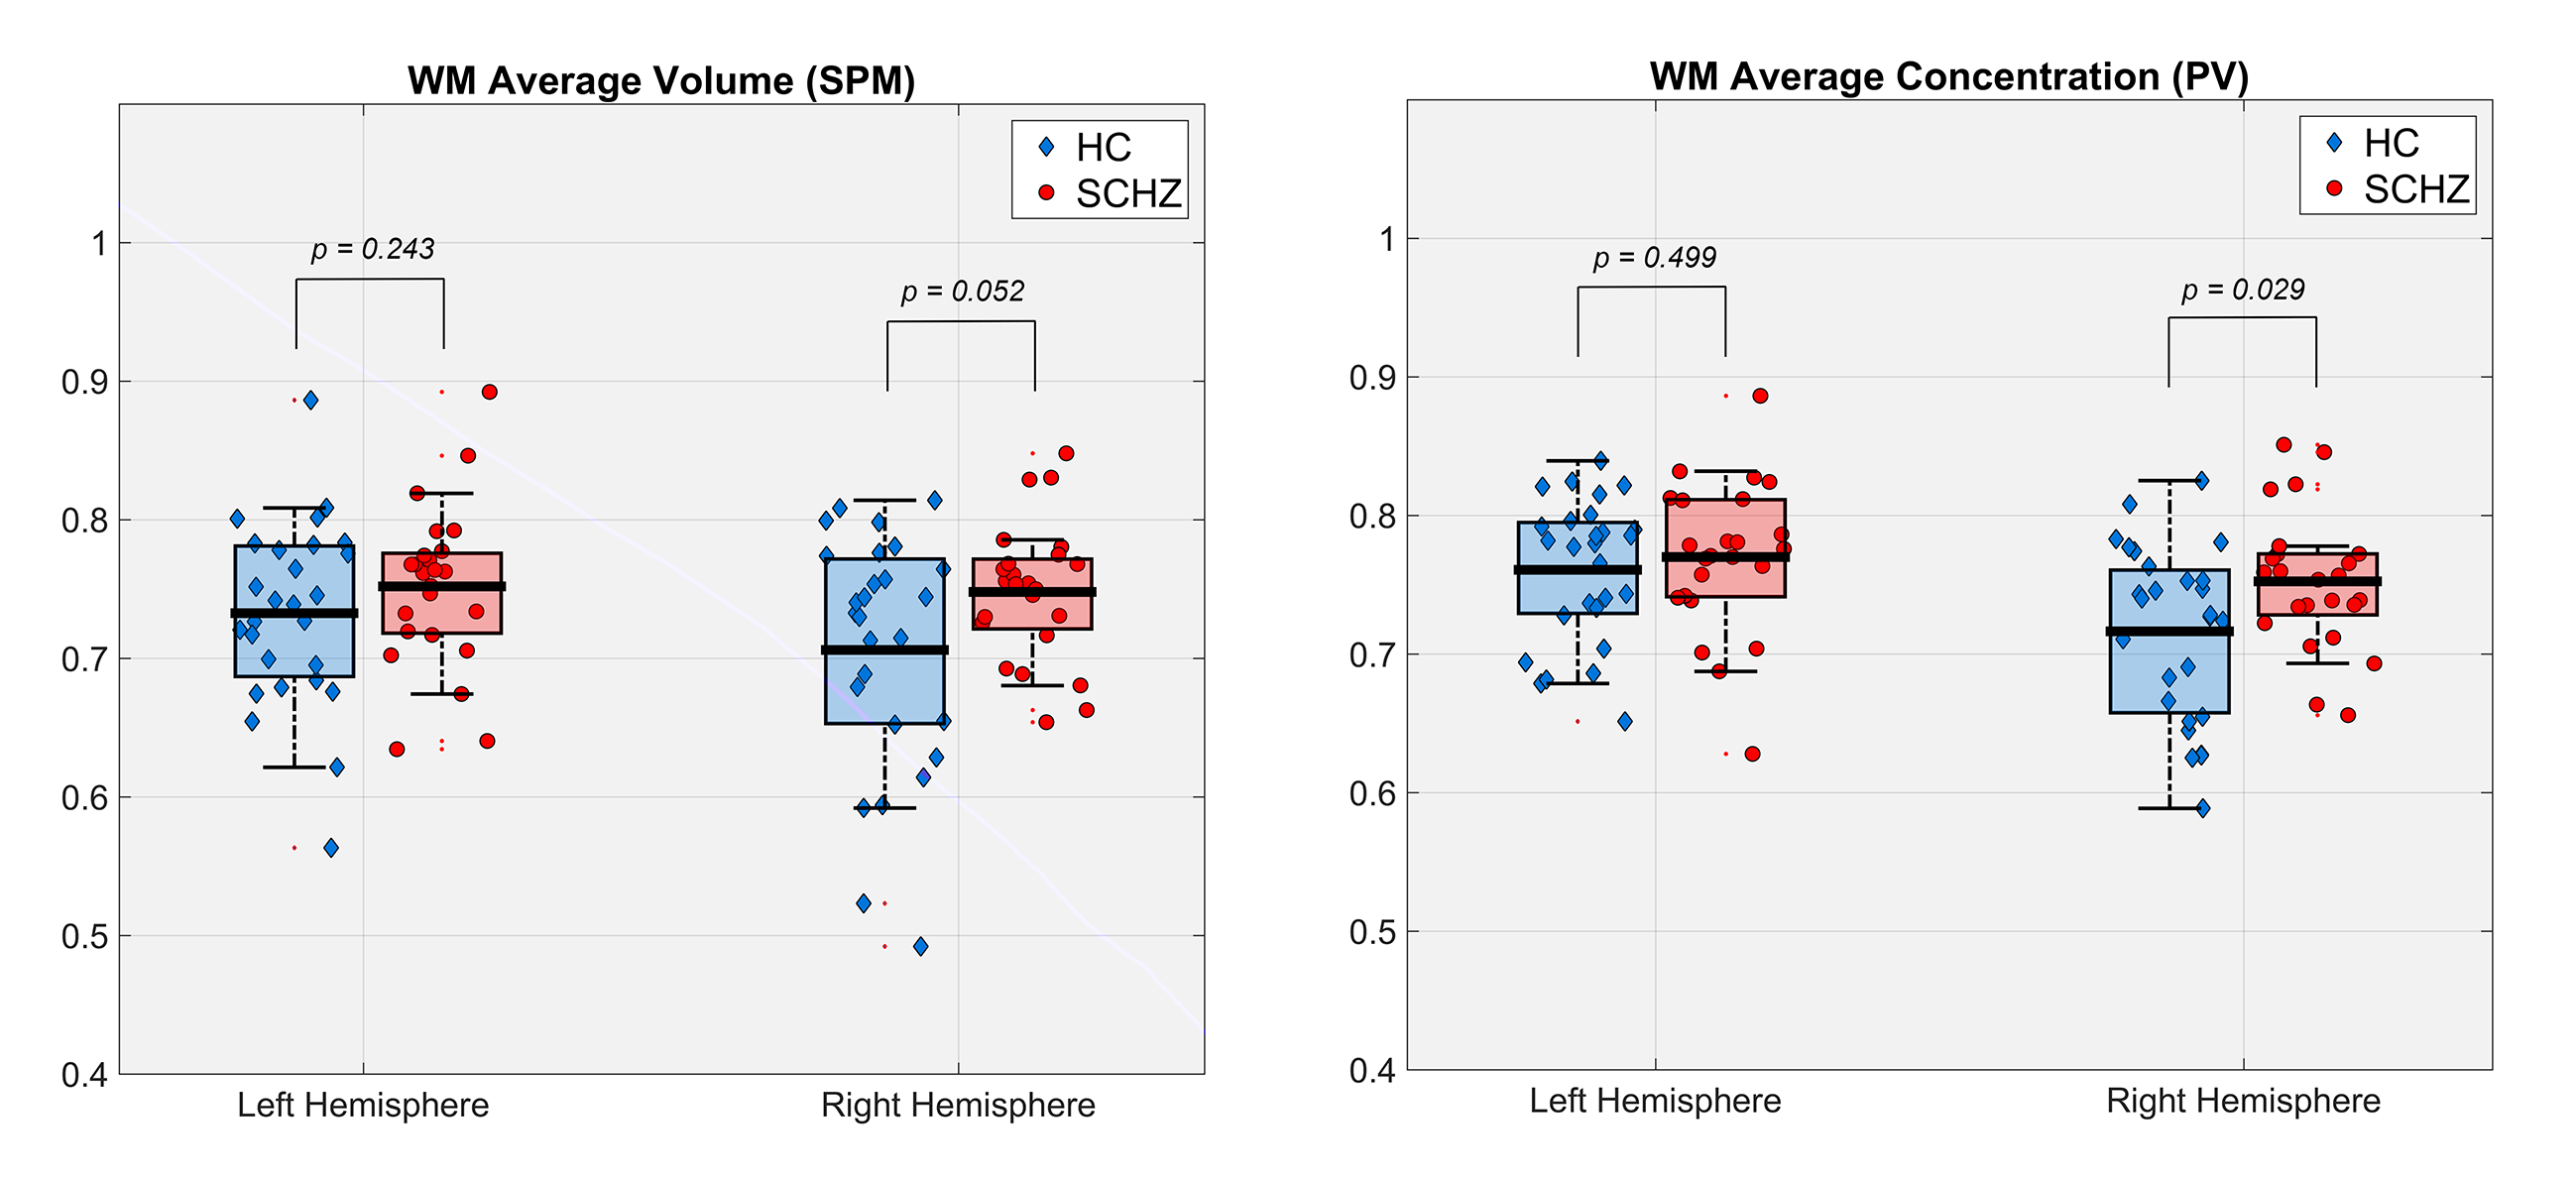
Figure 1 illustrates the outputs of the thalamus segmentation (green and yellow contours), the (b) PV concentrations and (c) TPMs from SPM. Figure 2 represents the total right and left thalamus volume between HC and SCHZ, no significant differences were found between groups (neither using the original Freesurfer volume estimation), though a trend of decreased volume on the right thalamus can be observed. Figures 3 and 4 show the comparison of GM and WM volumes within the thalamus with using either our PV (<CGM>, <CWM>) concentrations or the SPM average volumes (<VGM>, <VWM>). Pair-wise analysis showed statistical differences (p=.035) between (<CGM> and <VGM> on the right thalamus. Group differences were statistically significant only for concentration PV estimations in the right thalamus (<CGM>, p=.029, <CWM>, p=.028).Discussion and Conclusion
In this work we analyze PV modeling within the thalamus in SCHZ compared to HC. We show that the estimated PV tissue concentrations are closer to the observed GM/WM histological pattern than the posterior probability of belonging to a tissue type (Figure 1). Moreover, despite the limitation by sample size, we showed that GM and WM tissue concentrations derived from PV modelling have statistically significant differences between HC and SCHZ.Acknowledgements
The work is supported by the Centre d’Imagerie BioMédicale (CIBM) of the University of Lausanne (UNIL), the Swiss Federal Institute of Technology Lausanne (EPFL), the University of Geneva (UniGe), the Centre Hospitalier Universitaire Vaudois (CHUV), the Hôpitaux Universitaires de Genève (HUG), and the Leenaards and Jeantet Foundations. This work is also supported by the National Center of Competence in Research (NCCR) “SYNAPSY - The Synaptic Bases of Mental Diseases” financed by the Swiss National Science Foundation (n° 51AU40_125759). EN is supported by the Swiss National Science Foundation SNSF-205321-157040 and EM is supported by SNSF-310030-156874. TR, YA and ZR are supported by interdisciplinary fund of the Faculty of Biology and Medicine of the Lausanne University. P.S.B. is financially supported by Leenaards Foundation.References
1. Pergola et al, « The role of the thalamus in schizophrenia from a neuroimaging perspective”, Neuroscience and Biobehavioral Reviews, 2015.
2. Roche et al, « Partial Volume Estimation in Brain MRI Revisited”, MICCAI 2014.
3. Bonnier et al, « A New Approach for Deep Gray Matter Analysis Using Partial-Volume Estimation», Plos One, 2016.
4. Fartaria et al, « Segmentation of Cortical and Subcortical Multiple Sclerosis Lesions based on Partial Volume Modeling”, MICCAI 2017.
5. Battistella et al, « Robust thalamic nuclei segmentation method based on local diffusion magnetic resonance properties», Brain Structure and Function, 2017.
6. Schaltenbrand Atlas for Stereotaxy of the Human Brain, 1977.
7. Schmitter et al, “An evaluation of volume-based morphometry for prediction of mild cognitive impairment and Alzheimer's disease “, NeuroImage Clinical, 2015.
8. Tustison et al, “N4ITK: improved N3 bias correction”, IEEE Transactions on Medical Imaging, 2010.
Figures