3124
Fast and robust unsupervised identification of MS lesion change using statistical detection of changes (SDC) algorithm1Weill Cornell Medical College, New York, NY, United States
Synopsis
The objective of this study was to develop a robust automated lesion change detection algorithm for MS. Our preliminary results in 30 patients show that our SDC algorithm achieves much higher sensitivity and specificity (99%/76%) compared to that obtained with off-the-shelf LPA algorithm (76%/27%).
INTRODUCTION
MS patients are monitored regularly using MRI. Currently, radiologists compare hundreds of images to detect changes on consecutive scans, which is time-consuming. A fully automated lesion segmentation algorithm is desired (1). Lesion changes can be sensitively detected on subtraction images by humans (2-3) or with the help of automated algorithms relying on the signal difference and geometric constraints (4). Here we propose a robust and fast statistical detection of changes (SDC) algorithm to optimally detect lesion change using the Neyman-Pearson detector in statistics.METHODS
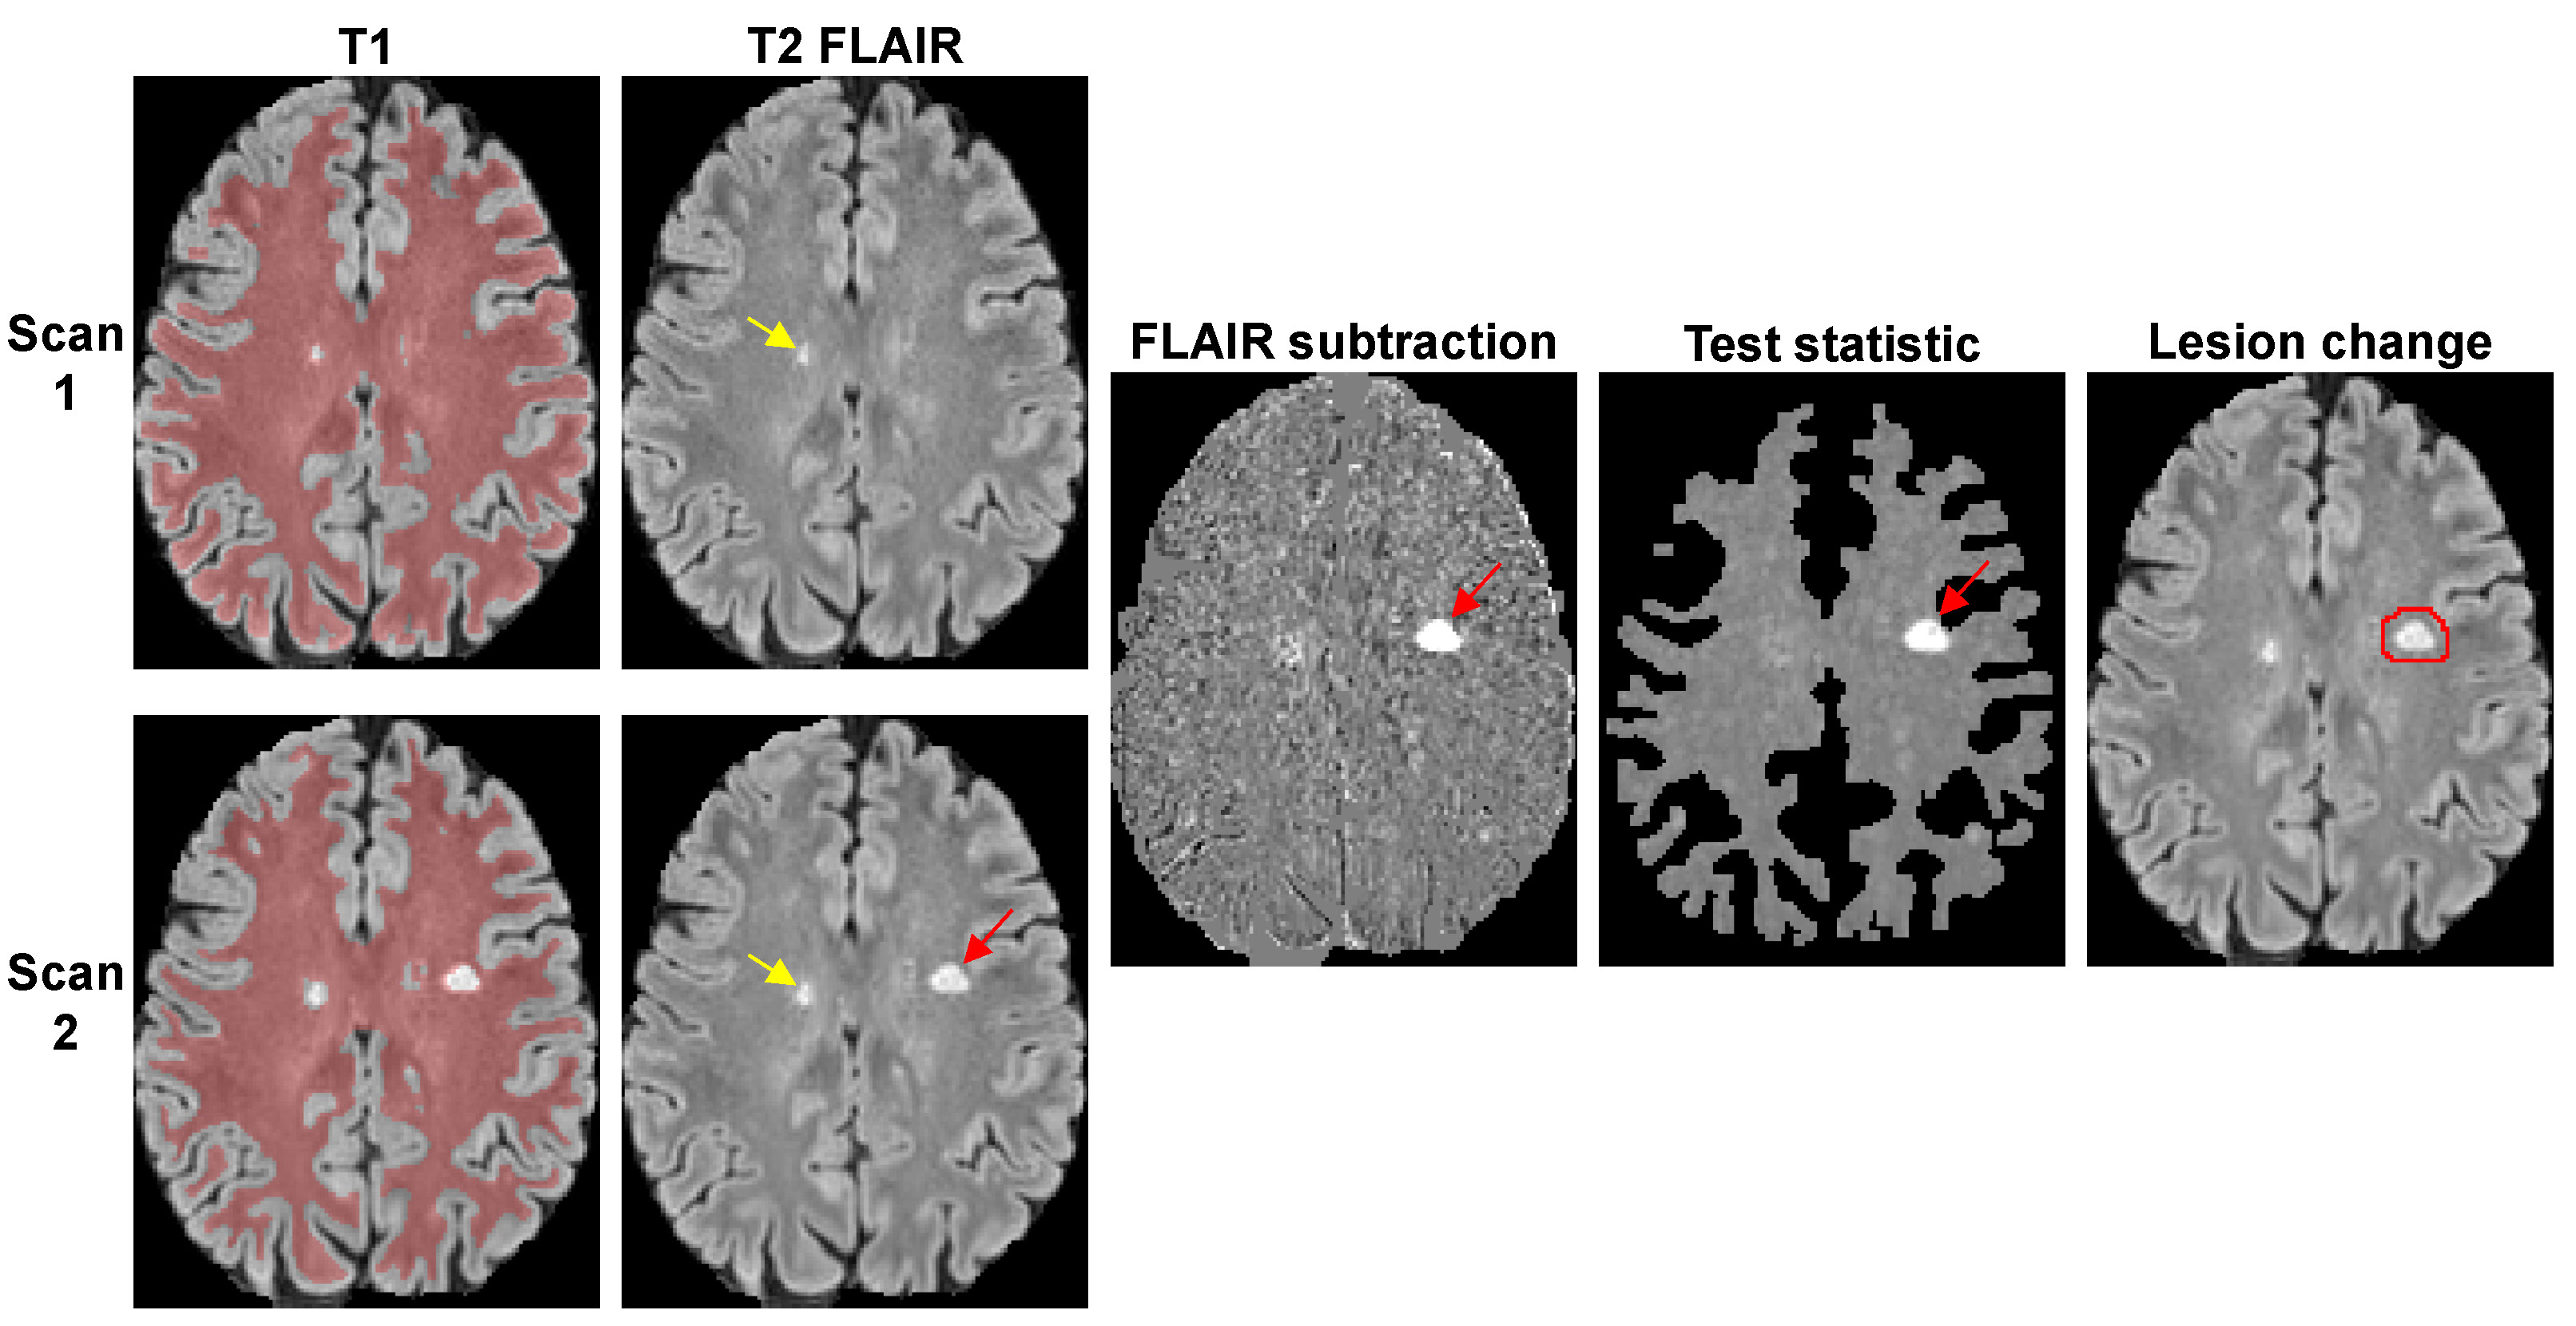
Lesion detection algorithm. Given two images I1 and I2, the signal change d=I2-I1 at voxel i is assumed to have Gaussian noise with mean µ and standard deviation σ, and SDC is formulated as a composite hypothesis test between two hypotheses: H0 ~ N(0,σ2) and H1 ~ N(µ,σ2), where N is the normal distribution and µ≠0 is unknown mean. σ can be estimated from the brain WM mask extracted from T1-weighted image with exclusion of large lesions (Fig.1). Assuming µ>0 (positive change), the test statistic can be derived from the log-likelihood ratio test: ti = $$$\sum_{j=1}^N$$$ dij where N is the number of observations at voxel i. The test statistic is then compared with a threshold γ chosen to control the probability of false positives: PFP = P(t ≥ γ | H0). This test provides the best detection power for a given PFP regardless of the unknown µ (uniformly most powerful detector) (5).
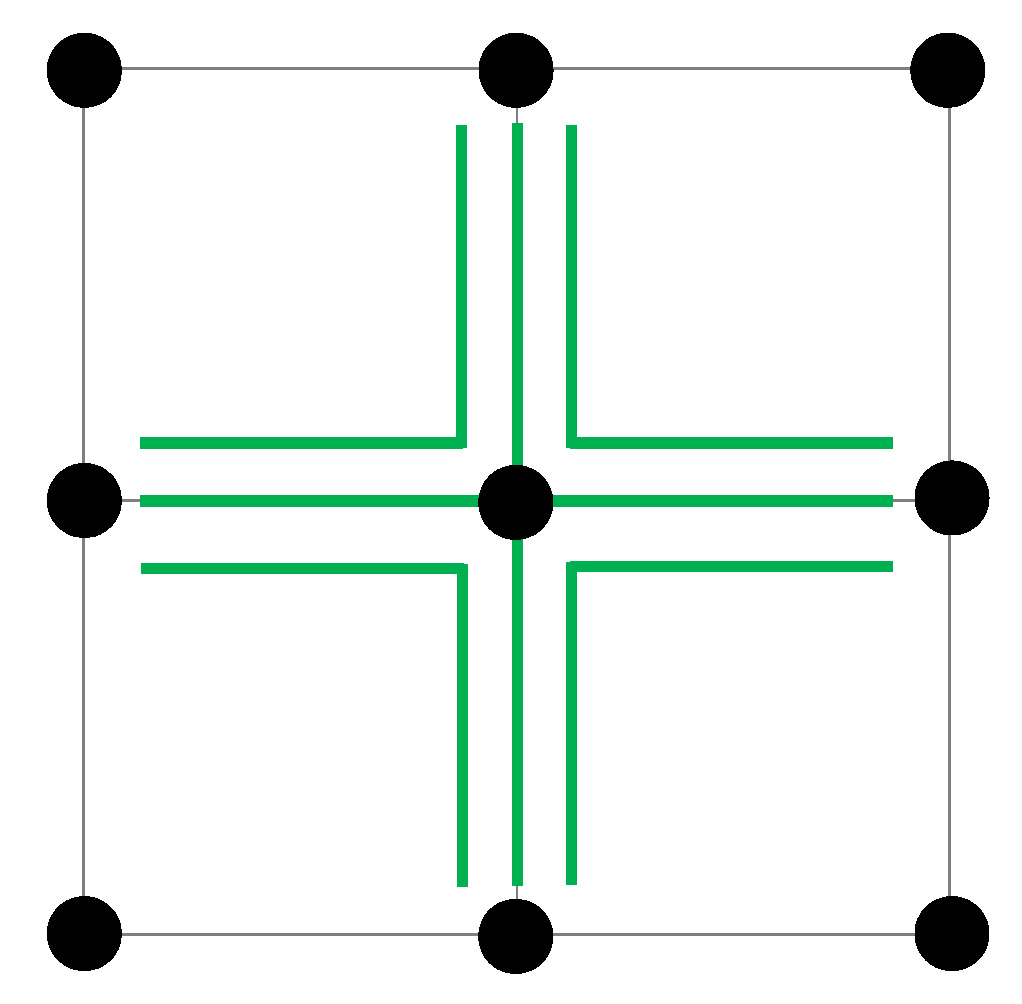
Since only one observation di is available per voxel, we propose to compute the test statistic ti = max(tk,k $$$\in$$$ Ti) where Ti denotes a 3-neighborhood system of voxel i (Fig.2) purposely chosen to match the currently accepted minimum lesion size requirement of 3 mm (3 voxels in 1 mm isotropic images) (6). Intuitively, this test statistic encodes in probabilistic terms the expectation that a bright voxel on the subtraction image is more likely considered “changed” if at least two of its neighbor voxels also have relatively high signals.
MRI experiments. Thirty MS patients underwent 3T MRI twice (interval 267±104 days, range 15-410 days). FLAIR images were automatically co-registered in the halfway space (7). The test statistic for FLAIR subtraction image was computed and thresholded to generate the change mask (Fig.1). A false positive rate PFP of 0.0001 was chosen to achieve high lesion sensitivity, which means that about 50/500,000 WM voxels may be incorrectly labeled as “changed”. To reduce the number of false positives, constraints were imposed on lesion size (≥3 voxels), location (lesions within 2 voxels of CSF border has to be connected to a lesion outside), and intensity on 2nd FLAIR (>2 standard deviations above mean).
For comparison, LPA (http:// www.applied-statistics.de) (8) was used to compute the lesion masks for FLAIR images with mask subtraction as a change mask. Lesion changes less than 3 voxels were excluded.
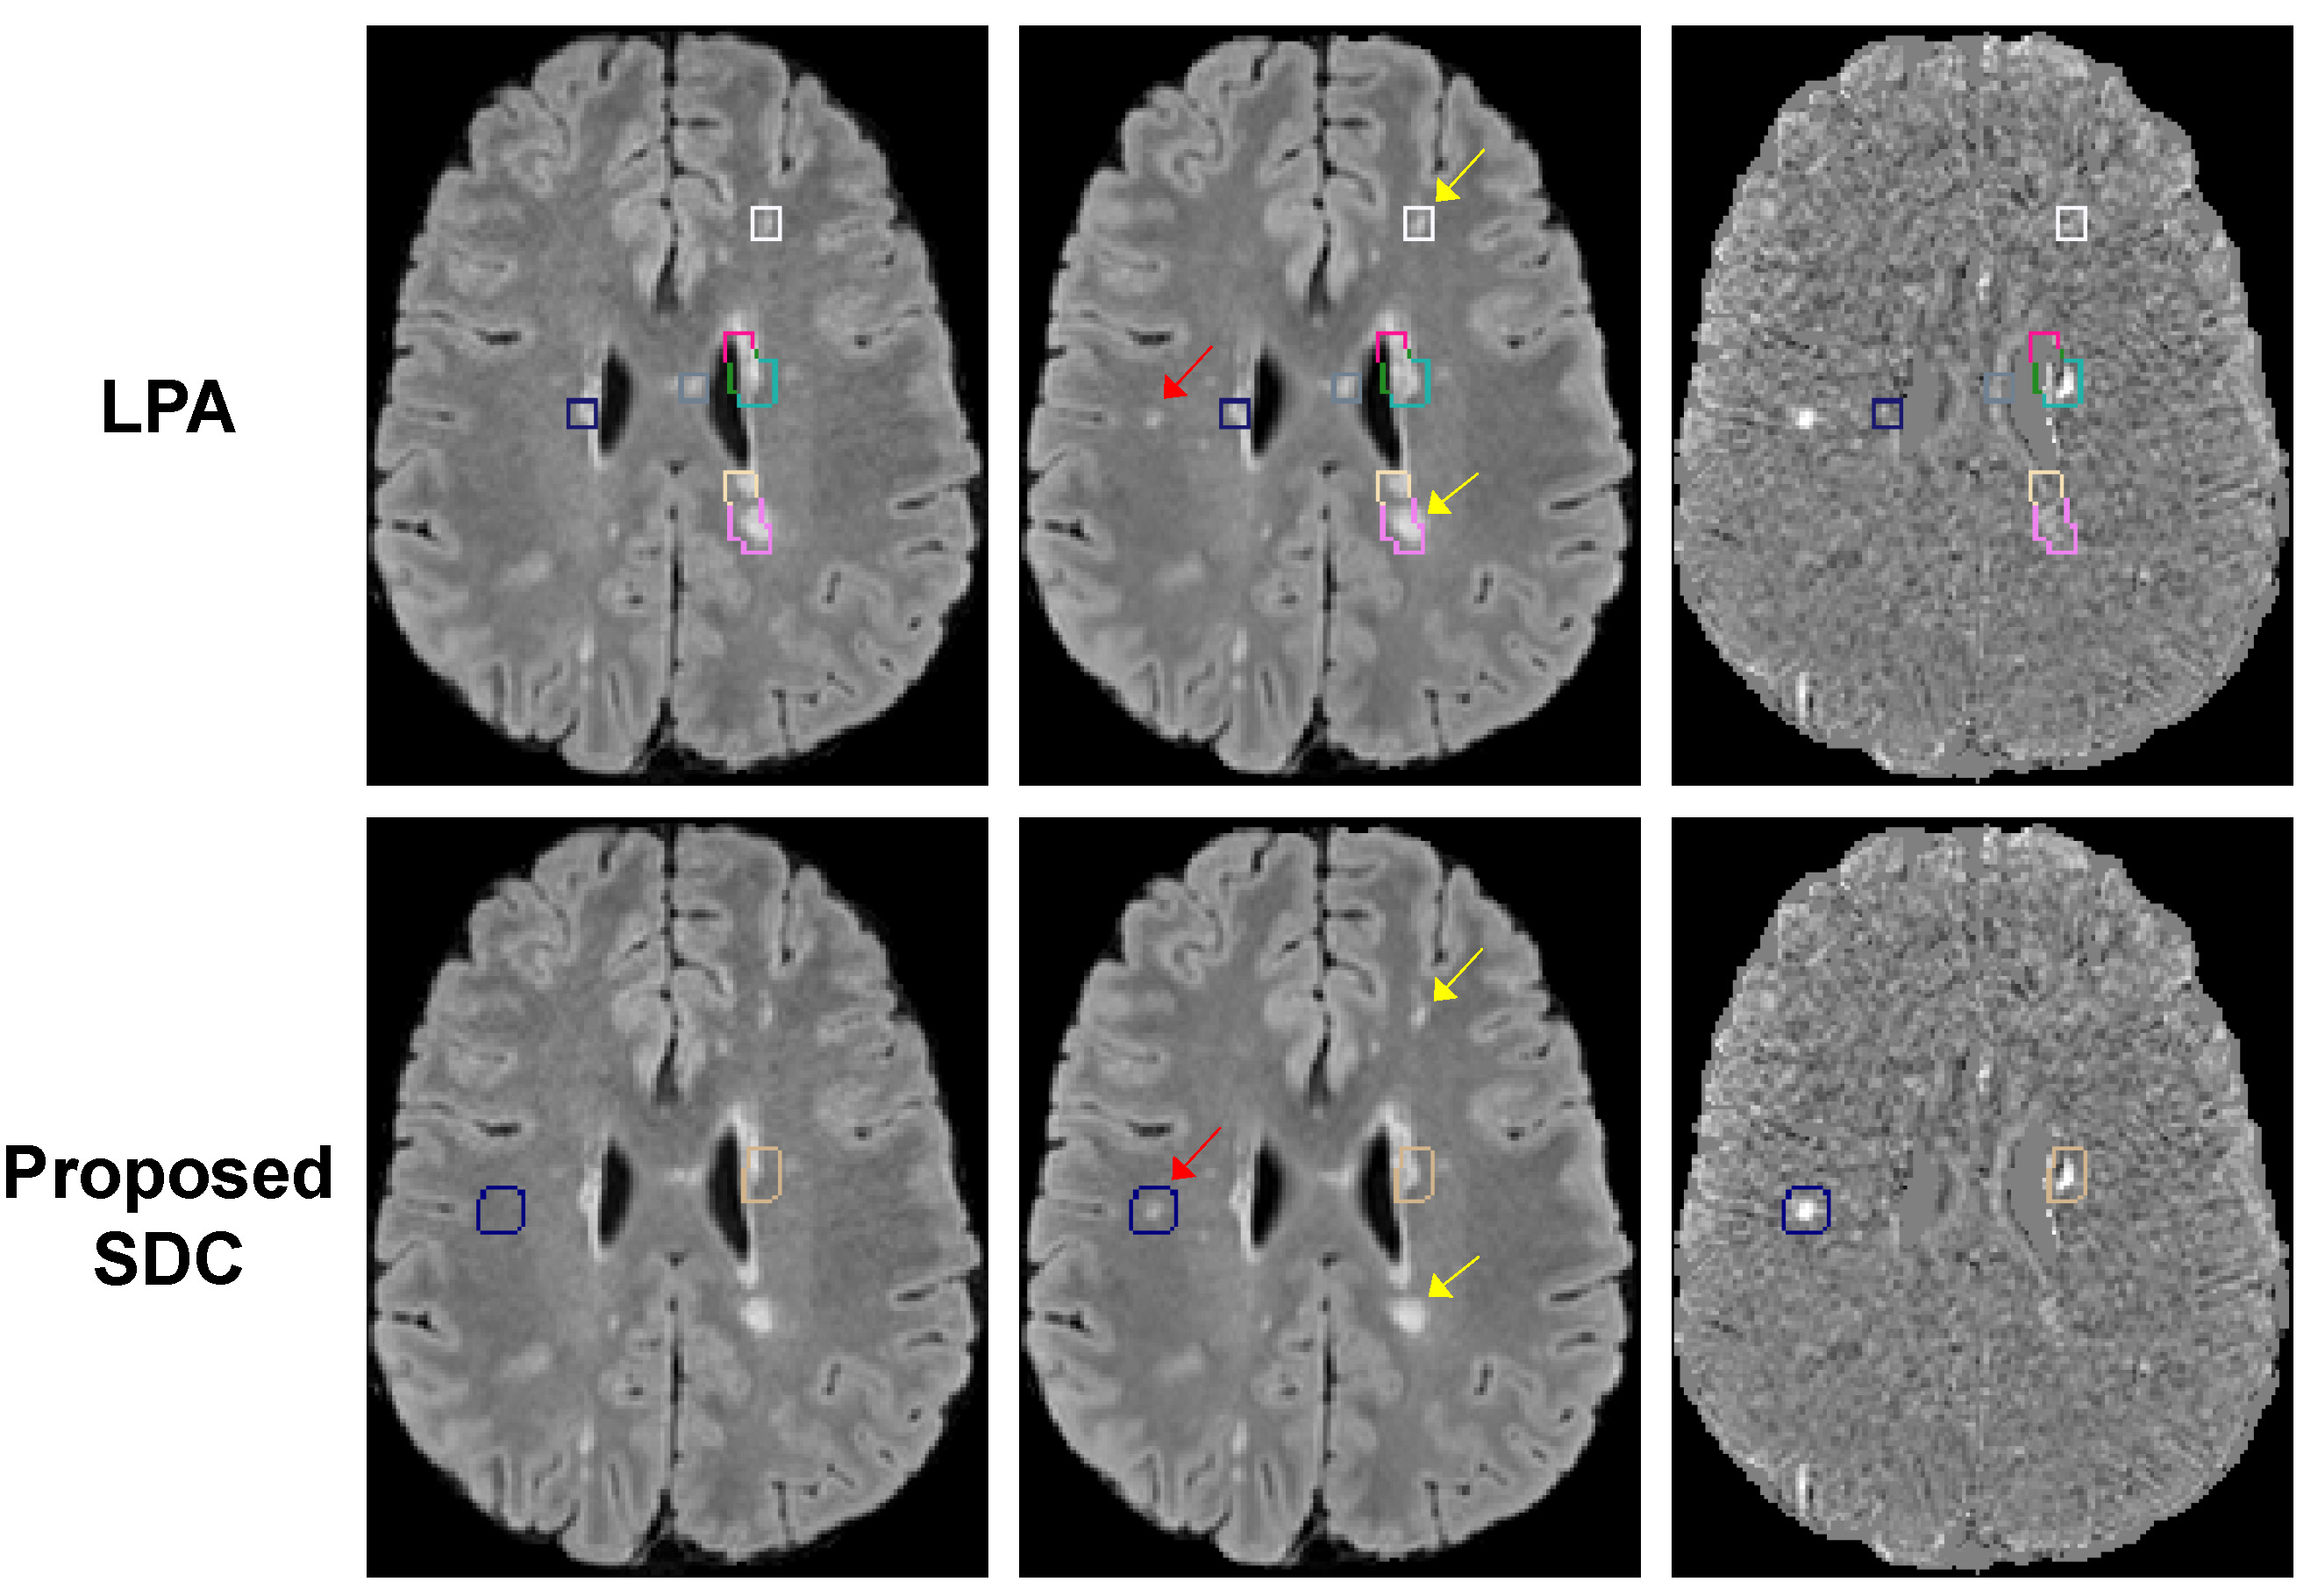
Statistical analysis. A neuroradiologist reviewed FLAIR and subtraction images with overlaid color boxes encompassing the detected lesion changes (Fig.3). These were labeled as “true positive” or “false positive”. The reader also reviewed the images outside of these boxes to count the number of missed lesion changes (“false negative”) and unchanged lesions (“true negative”).
RESULTS
Figure 3 shows an example of lesion detection obtained with LPA and proposed SDC algorithms. LPA was oversensitive and generated a much higher number of false positives than SDC. LPA also missed small lesions. Over 30 subjects, our SDC algorithm detected 344 lesion changes or 11±7 per subject on average (range 4-33), while LPA detected 1506 changes or 50±38 per subject (range 5-152). Despite a much-reduced number of detected changes, the SDC algorithm missed only 1 lesion vs. 24 misses by LPA. Our SDC algorithm achieved a sensitivity/specificity of 99%/76%, which outperformed LPA (76%/27%).DISCUSSION
Our preliminary data show that the proposed SDC algorithm can be a valuable computer-assisted tool to improve MS lesion detection and reduce reader’s fatigue. While only positive change (lesion growth) was considered, the detection of negative change can be done by swapping the order of source images. Further evaluation on patient data is warranted, particularly in those with large brain anatomy changes between scans which can interfere with subtraction.CONCLUSION
The proposed SDC detection algorithm has high sensitivity/specificity and performs better than LPA algorithm.Acknowledgements
This study was supported in part by grants from the NIH (R01NS090464) and the National MS Society (RG-1602-07671).References
1. Carass A, Roy S, Jog A, Cuzzocreo JL, Magrath E, Gherman A, Button J, Nguyen J, Prados F, Sudre CH, Jorge Cardoso M, Cawley N, Ciccarelli O, Wheeler-Kingshott CA, Ourselin S, Catanese L0, Deshpande H0, Maurel P0, Commowick O, Barillot C, Tomas-Fernandez X, Warfield SK, Vaidya S, Chunduru A, Muthuganapathy R, Krishnamurthi G, Jesson A, Arbel T, Maier O, Handels H, Iheme LO, Unay D, Jain S, Sima DM, Smeets D, Ghafoorian M, Platel B, Birenbaum A, Greenspan H, Bazin PL, Calabresi PA Crainiceanu CM Ellingsen LM, Reich DS, Prince JL, Pham DL. Longitudinal multiple sclerosis lesion segmentation: Resource and challenge. Neuroimage. 2017 Mar 1;148:77-102.
2. Moraal B, Wattjes MP, Geurts JJ, Knol DL, van Schijndel RA, Pouwels PJ, Vrenken H, Barkhof F. Improved detection of active multiple sclerosis lesions: 3D subtraction imaging. Radiology. 2010 Apr;255(1):154-63.
3. van
Heerden J, Rawlinson D, Zhang AM, Chakravorty R, Tacey MA, Desmond PM, Gaillard
F. Improving Multiple Sclerosis Plaque Detection Using a Semiautomated Assistive Approach. JNR Am J Neuroradiol. 2015 Aug;36(8):1465-71.
4. Battaglini M, Rossi F, Grove RA, Stromillo ML, Whitcher B, Matthews PM, De Stefano N. Automated identification of brain new lesions in multiple sclerosis using subtraction images. J Magn Reson Imaging. 2014 Jun;39(6):1543-9.
5. Kay SM. Fundamentals of Statistical Signal Processing, Volume II: Detection Theory. Prentice Hall, 1998.
6. Filippi M, Rocca MA, Ciccarelli O, De Stefano N, Evangelou N, Kappos L, Rovira A, Sastre-Garriga J, Tintorè M, Frederiksen JL, Gasperini C0, Palace J1, Reich DS2, Banwell B3, Montalban X, Barkhof F; MAGNIMS Study Group. MRI criteria for the diagnosis of multiple sclerosis: MAGNIMS consensus guidelines. Lancet Neurol. 2016 Mar;15(3):292-303.
7. Jenkinson M, Beckmann CF, Behrens TE, Woolrich MW, Smith SM. FSL. Neuroimage. 2012 Aug 15;62(2):782-90.
8. Paul Schmidt. Bayesian inference for structured additive regression models for large-scale problems with applications to medical imaging. PhD thesis, Ludwig-Maximilians-Universität München, January 2017. URL http://nbn-resolving.de/urn:nbn:de:bvb:19-203731.
Figures