3122
Diffusion MRI in muscles at high b-values: towards a quantification of microscopic organelles1PMC, CNRS – Ecole Polytechnique, F-91128, Palaiseau, France, 2AgroResonance - UR370 QuaPA, F-63122, Saint Genès Champanelle, France
Synopsis
We present an application of diffusion MRI at high b-values to a non-invasive quantification of micron-sized organelles such as mitochondria. The experiments were conducted ex vivo on pork muscle and analyzed with a bi-exponential tensorial model, which allows us to estimate the mitochondria content in the muscle. Even though a more systematic comparison between mesoscale diffusion and microscale histology is deserved, this work is a proof of concept and a prerequisite for developing in vivo methods for quantifying the content of various organelles in muscles, e.g. for studying mitochondrial dysfunction in aging.
Introduction
We present an application of diffusion MRI at high b-values to a non-invasive quantification of micron-sized organelles such as mitochondria and intramyocellular lipid (IMCL) droplets. Although monitoring the mitochondrial content is of great clinical interest for diagnosis of various diseases related to dysfunctions of mitochondria, their current studies are mainly performed by histology with advanced microscopy (such as TEM) that prohibits in vivo measurements. We aim at probing the capacities of diffusion MRI to resolve this challenging problem.Material
The experiments were conducted ex vivo on pork muscle with a temperature regulation at 8°C. The sample of size 16 mm was divided in 32x32 (0.5mm)3 voxels. The protocol was a PGSE sequence at 400MHz with Δ=11.8ms and δ=6.3ms, performed for six non-collinear gradient directions. A fat suppression scheme1 was employed to reduce the contribution from lipids. The b-values ranged from 0 to about 32000 s/mm2 and the noise/signal ratio was estimated at below 0.005.Method
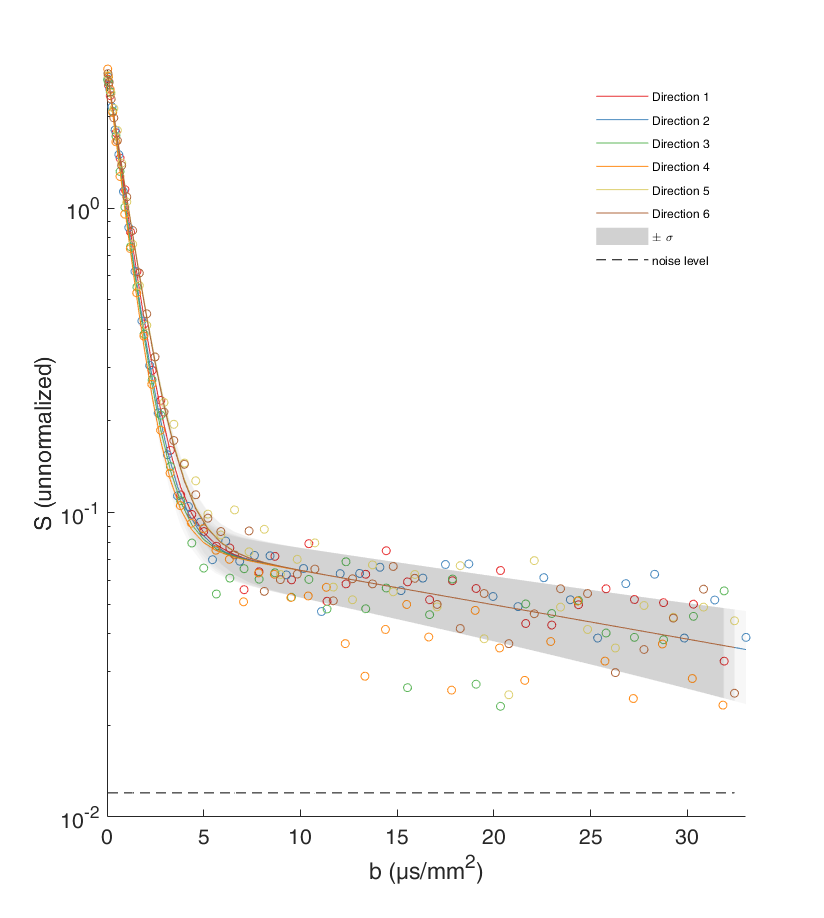
The signal has a “fast” contribution from the intracellular water almost freely diffusing in large (~50µm) muscle cells, and a “slow” contribution from restricted diffusion of mitochondrial water and possibly from residual lipids in IMCL2. We employ thus a bi-exponential tensorial fit
$$S=S_0\cdot \left[(1-\rho)\exp\left(-b\sum_{i,j}e_iD^f_{i,j}e_j\right)+\rho \exp(-bD^s)\right], \quad(1)$$
where S0 is the reference signal, 1-ρ is the volume fraction of the intracellular water, Df is the apparent diffusion tensor for the intracellular water inside the anisotropic fibrillar structure of the muscle cells, ei is the unit direction of the gradient, and Ds is the apparent diffusion coefficient of the “slow” component. In a first approximation, mitochondria can be treated as isolated micron-sized compartments, in which the motional narrowing regime is expected, with
$$D_s=\frac{2\zeta_{-1}L^4}{D\delta(\Delta-\delta/3)}, \quad (2)$$
where L is the size of the compartment, and ζ-1 is a numerical shape-dependent coefficient3. Since this signal is very sensitive to the size L, only relatively small organelles (whose size is inferior to 7µm) can provide a non-negligible signal at high b-values that excludes e.g. blood vessels. As mitochondria are filled with around 65% of water4, the mitochondria volume fraction (MVF) would be given by $$$MVF=1.5\cdot \rho$$$ , if the contribution from the IMCL was fully eliminated. In practice, $$$1.5\cdot\rho$$$ is the upper bound of the MVF.
Results
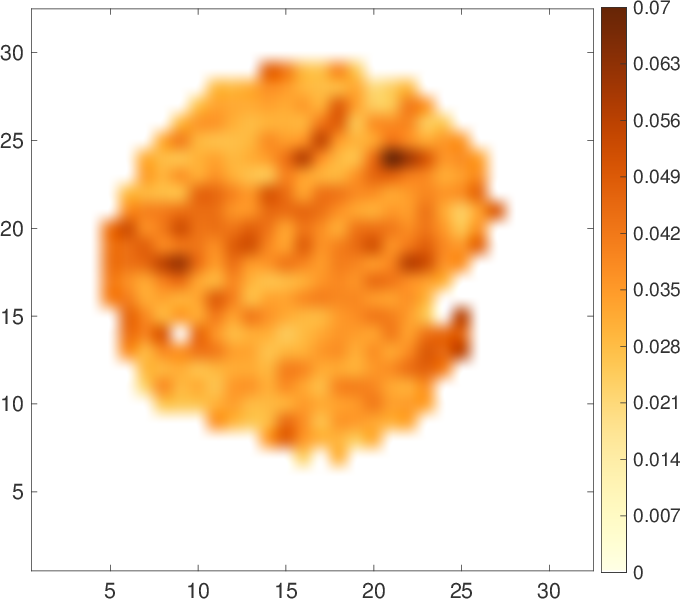
Figure 1 shows an example of data fitted by Eq. (1). Note that the slowly decreasing part of the curve is much higher than the estimated noise level (SNR > 5). If this residual signal comes only from the mitochondrial water, one can access the map of the MVF (Fig. 2). The map shows some darker areas, which would correspond to the slow-oxidative fibers, whereas the brighter areas would correspond to the fast-glycolytic fibers. The obtained values of the MVF range between 3% and 6% (see Ref. [5] for comparison with mouse and dolphin). The bi-exponential tensorial fit reveals anisotropy of the medium with a nearly constant main eigenvector of Df over the whole sample that corresponds to the muscle fibers direction. The corresponding eigenvalue is around $$$1.3\cdot 10^{-9}m^2/s$$$ , which is consistent with the diffusion coefficient of water at 8°C: $$$D=1.6\cdot 10^{-9}m^2/s$$$ (the slight difference being attributed to intracellular crowding). Approximating mitochondria by spheres (with ζ-1=8/175) the slow diffusion coefficient $$$D^s\approx 2\cdot 10^{-11}m^2/s$$$ yields via Eq. (2) an estimate of the effective radius, $$$L\approx 2\mu m$$$ , which is twice higher as compared to the standard values. This quantitative discrepancy can be attributed to (i) the effect of the ignored low permeability of the mitochondrial membranes (given that mitochondria are deformed and their membranes are altered by post mortem proteolytic systems6,7) which would lead to a faster signal attenuation and thus to a greater value of Ds than expected from Eq. (2); (ii) non-spherical shape of mitochondria; (iii) the use of the intrinsic water diffusion coefficient D that ignores molecular crowding; and (iv) residual contribution of IMCL and noise (the SNR being around 5).Discussion
The mitochondria are the natural candidates to explain the observed residual signal at high b-values, given that the contribution of lipids was reduced by the fat suppression scheme. Even if this reduction was not perfect, the observed value of Ds is much higher than the diffusion coefficient of lipids2, $$$D^{lip}\approx 6.6\cdot 10^{-12}m^2/s$$$ , so that diffusion of lipids alone cannot explain the observed experiment. Even though a more systematic comparison between mesoscale diffusion and microscale histology is deserved, this work is a proof of concept and a prerequisite for developing in vivo methods able to quantify the content of various organelles in muscle, e.g. for studying mitochondrial dysfunction in aging.Acknowledgements
NM and DG acknowledge the support under Grant No. ANR-13-JSV5-0006-01 of the French National Research Agency.References
[1] Gomori JM, Holland GA, Grossman RI, Gefter WB, and Lenkinski RE., Fat suppression by section-select gradient reversal on spin-echo MR imaging. Work in progress. Radiology 168, 493-495 (1988).
[2] Cao P, Fan S-J, Wang AM, Xie VB, Qiao Z, Brittenham GM, and Wu EX. Diffusion Magnetic Resonance Monitors Intramyocellular Lipid Droplet Size In Vivo. Magn. Reson. Med. 73, 59-69 (2015).
[3] Grebenkov DS. NMR Survey of Reflected Brownian Motion. Rev. Mod. Phys. 79, 1077 (2007).
[4] Williams ML. Water content and metabolic activity of mitochondria from fetal rat liver. Biochim. Biophys. Acta 118, 221-229 (1966).
[5] Pathi B et al. The formation and functional consequences of heterogeneous mitochondrial distributions in skeletal muscle. J. Exp. Biol. 215 (11), 1871-1883 (2012).
[6] Abbott MT, Pearson AM, Price JF, and Hooper GR. Ultrastructural changes during autolysis of red and white porcine muscle. J. Food Science 42 (5), 1185–1188 (1977).
[7] Ouali A, Gagaoua M, Boudida Y et al. Biomarkers of meat tenderness: present knowledge and perspectives in regards to our current understanding of the mechanisms involved. Meat Science 95 (4), 854–870 (2013).
Figures