3121
Isotropic diffusion weighted 3D oscillating gradients at 7T1Oslo University, Oslo, Norway, 2Berstein Center for Computational Neuroscience, Berlin, Germany, 3German Centre for Neurodegenerative Diseases (DZNE), Bonn, Germany
Synopsis
The diffusion MRI represents a signal obtained from the relatively large voxel size consisting of complex tissue microstructure. Modern diffusion MRI strategies typically work with one parametric dimension associated with either b-value or diffusion time. In turn, spatial anisotropy of biological tissue demands to take into account a high angular resolution. In order to simplify the interpretation of the diffusion signal, we introduce isotropic diffusion weightings. Essentially, we sample the diffusion signal by 3D oscillating gradient method. Novel biomarkers such as surface-to-volume ratio and mean neurite diameter are presented.
Introduction
Time dependent diffusion1,2 attracts a renewed interest in the diffusion MRI community due to the possibility to obtain enriched information about the tissue microstructre. The demand to evaluate the diffusion processes along two parametric dimensions of q-space and t(ime)-space force us to search a novel approach in sampling of the diffusion signal. Isotropic diffusion weighing3 (IDW) allows us to bring this problem into a practical way including clinical applications4,5. As an example, we consider an application of the IDW sequences for the estimation of a surface-to-volume (S2V) ratio at the short diffusion time limit1 in the human brain at 7T.Method and Materials
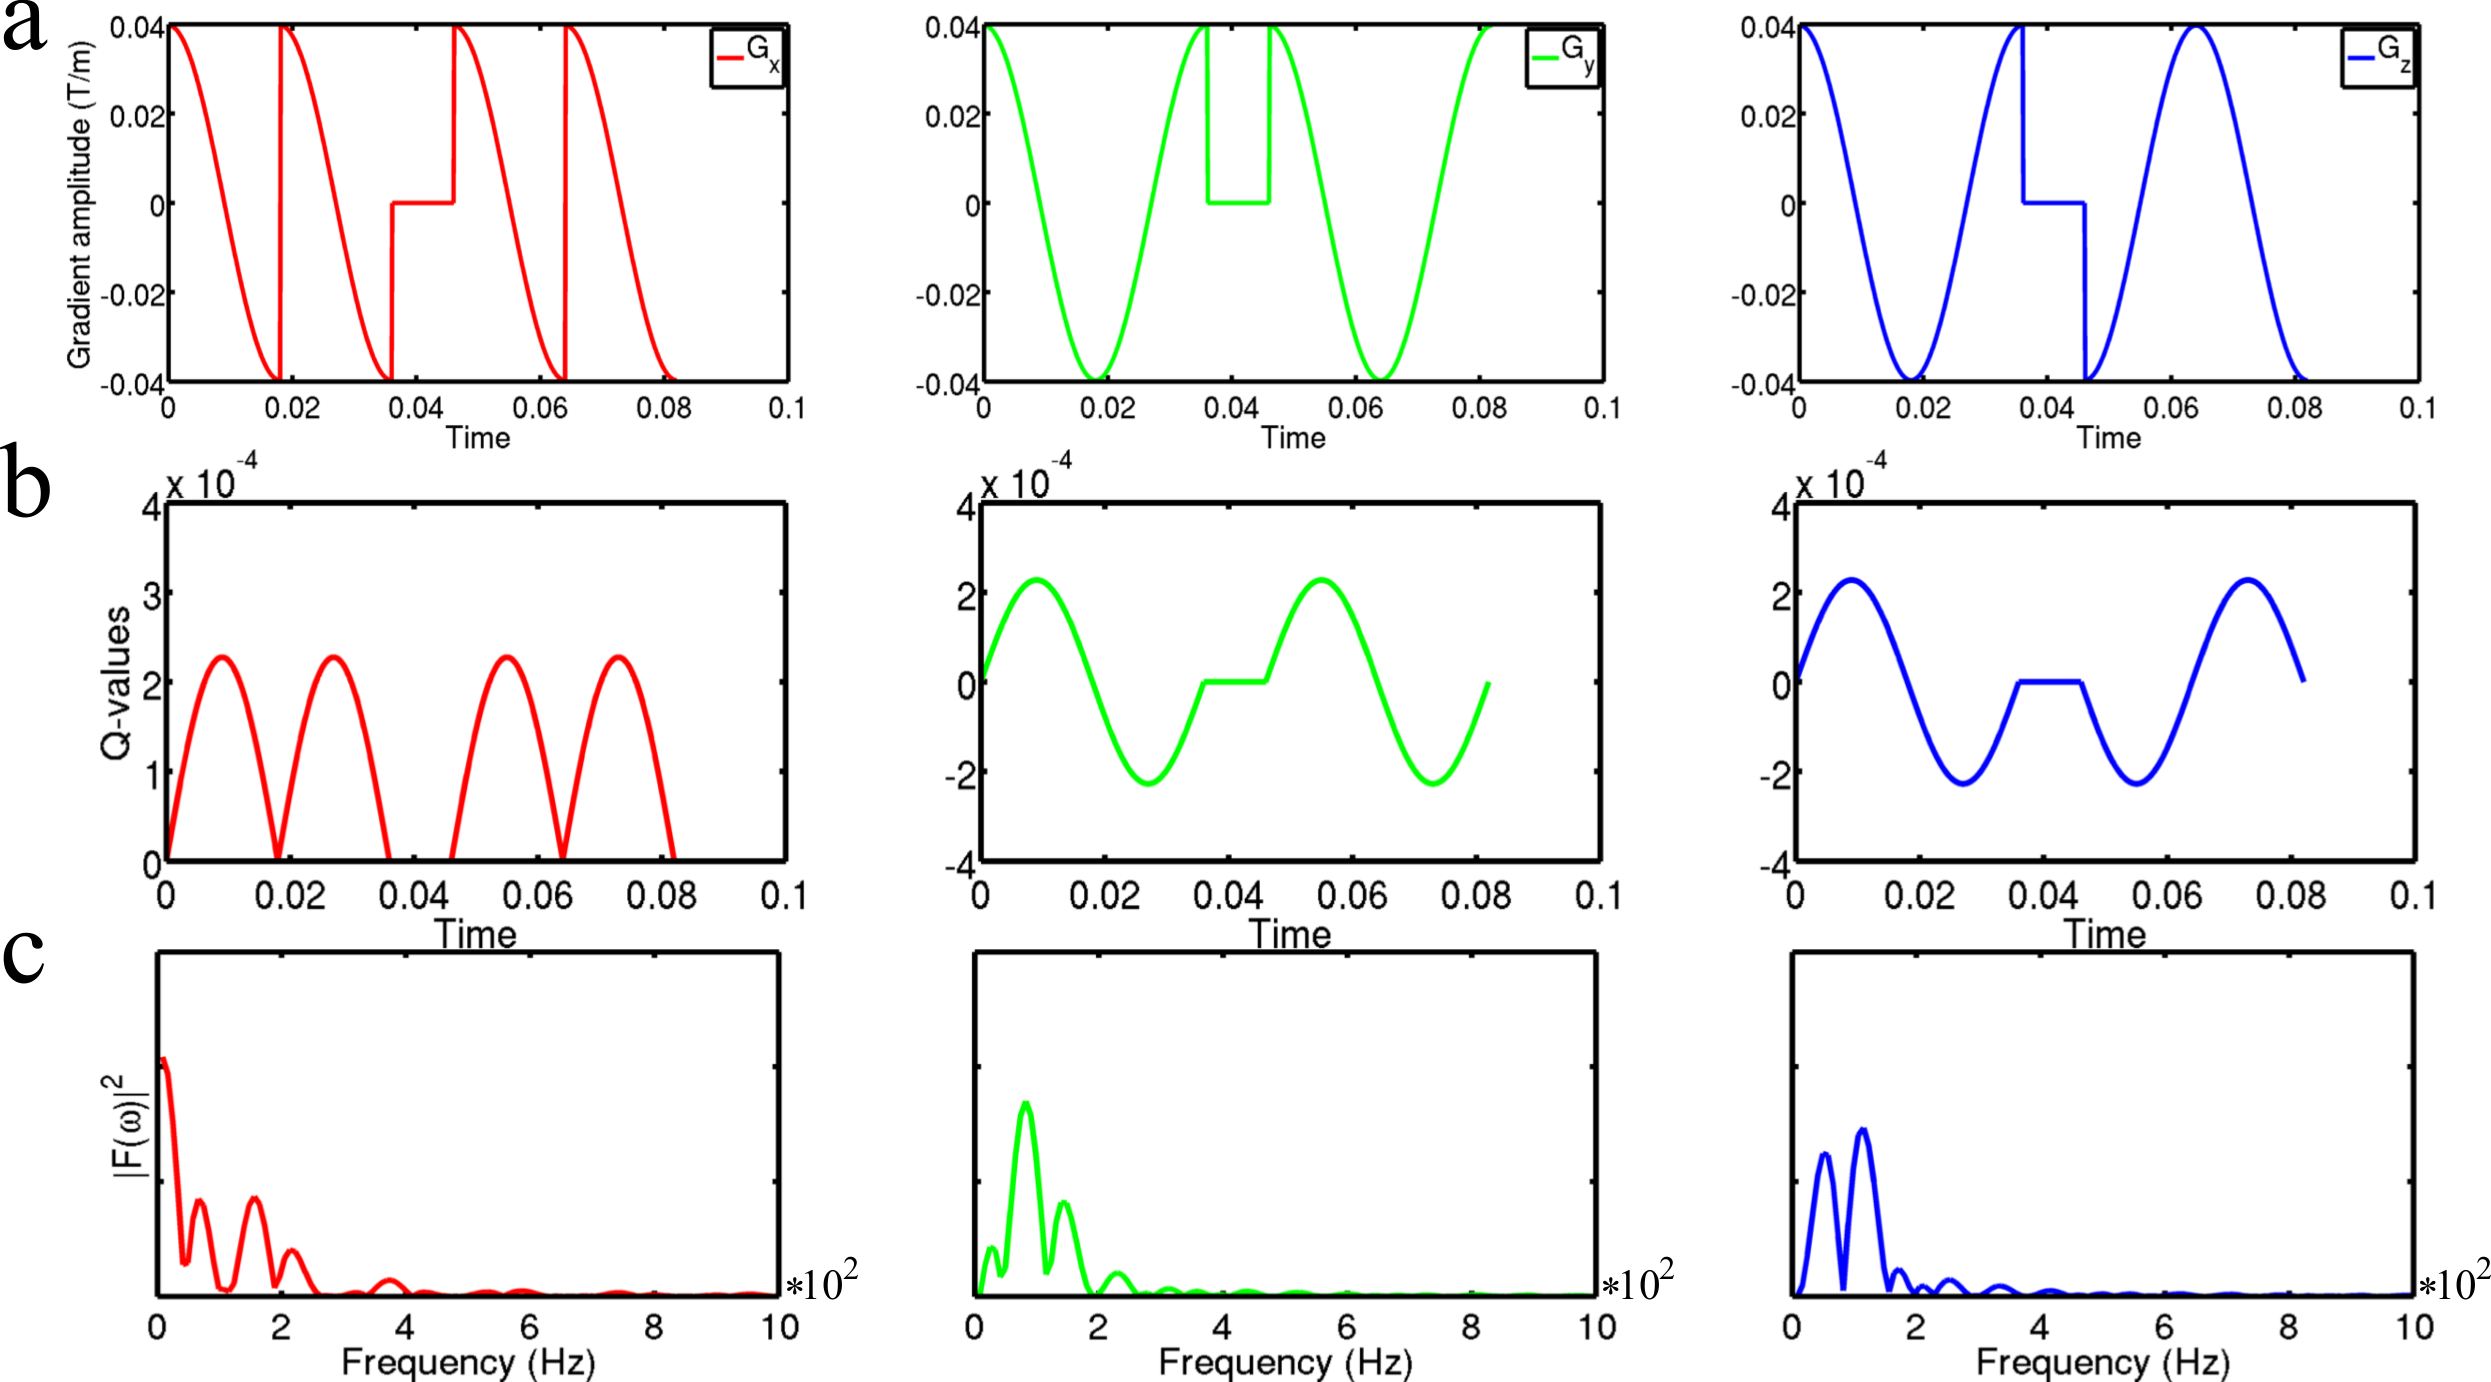
In order to provide an accurate IDW sequence example we used the FAMEDcos3 sequence with equal diffusion times along all Cartesian axes. This sequence is based on the application of harmonic functions with phase jumps in order to satisfy the condition of mutual gradient orthogonality (see Fig. 1). The chosen diffusion times were 72, 76, 80, 84, 88, and 92 ms with b-values equal to 0, 200, and 400 ms/mm2. Acquired diffusion data were corrected for eddy-current and susceptibility-based distortions using the eddy utility from FSL6, averaged over 4 acquisitions, and smoothed with the Gaussian kernel of 1.5mm3 in order to decrease the Gibbs ringing artefacts. The acquired spatial resolution was isotropic 1.8mm3. The short diffusion time limit is described by Mitra's formula1:
$$D(t) = D_0(1- \frac{4}{3d \sqrt{π}} \frac{S}{V} \sqrt{D_0 t})$$
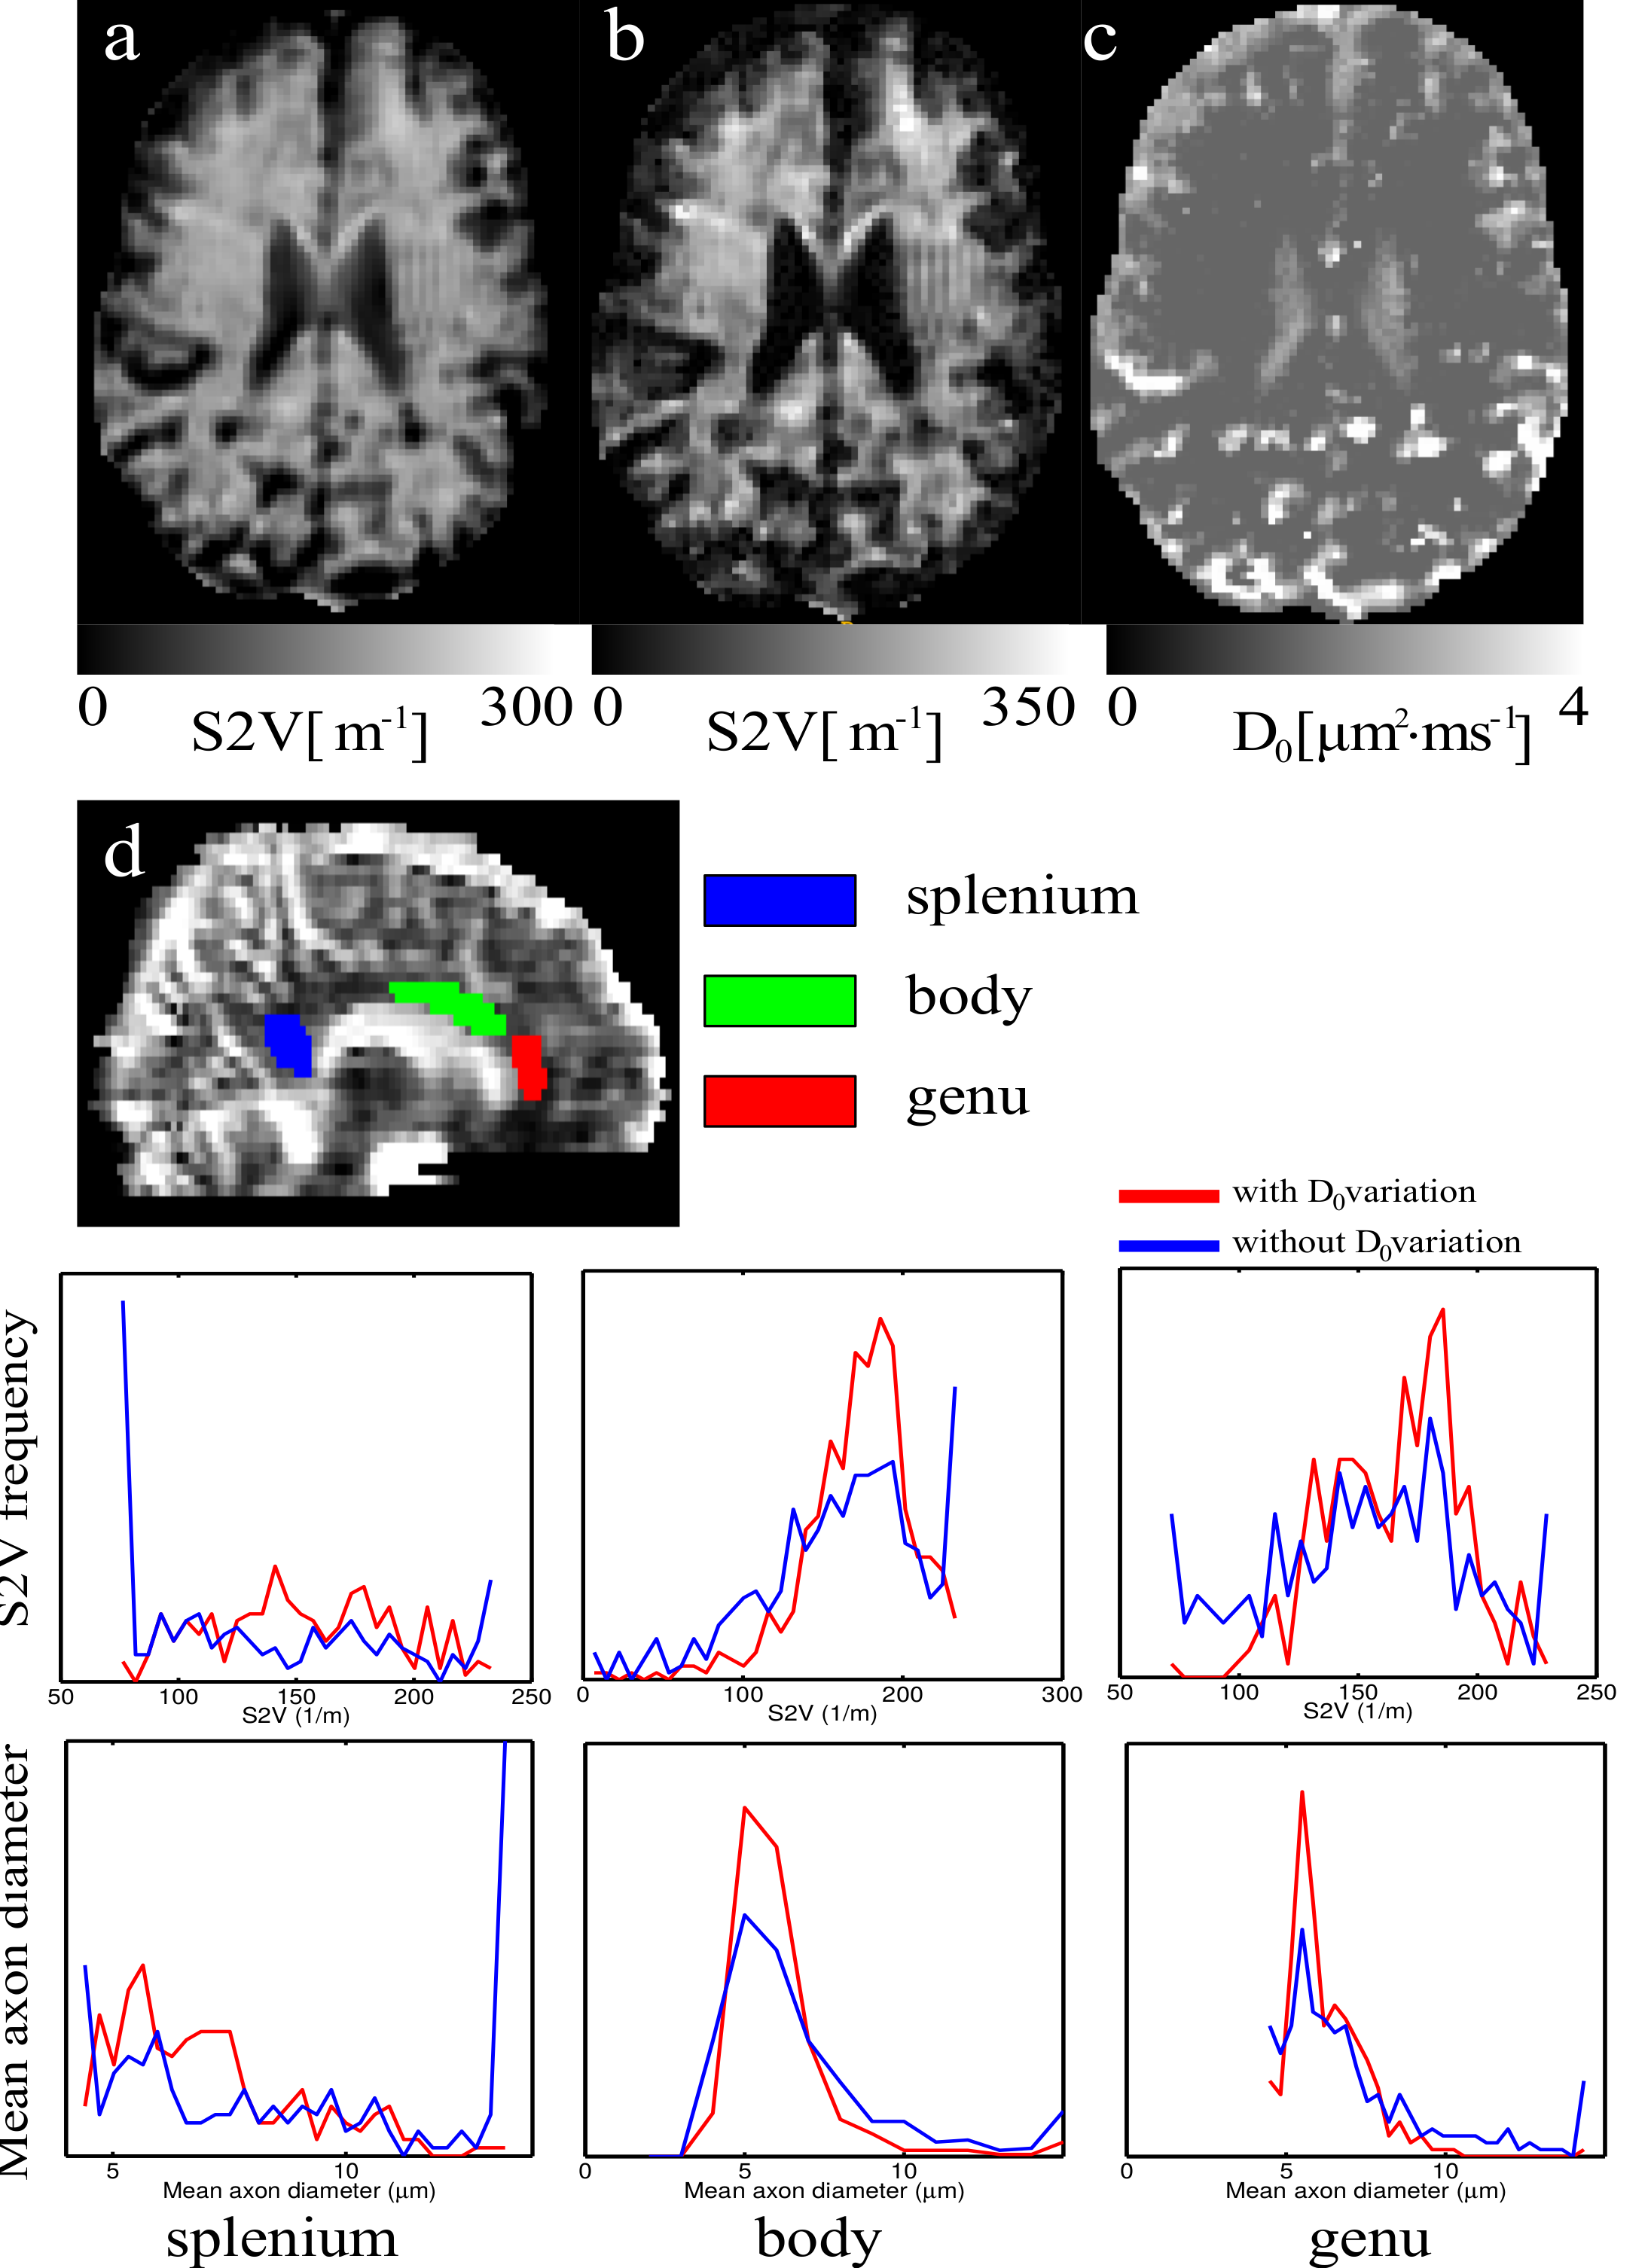
where D0 is the diffusion coefficient of a free water, d = 3 is the spatial dimension. In order to estimate diffusion coefficients for each diffusion time we used a two step algorithm: linear robust fit and constrained optimisation. Next, the estimated diffusion coefficients were used for S2V evaluation by fitting of Eq. (1) with and without D0 variations. Non-varying D0 was fixed and equal to 3 µm2/ms. We performed measurements on a healthy volunteer (29 years old) at a Siemens MAGNETOM 7T scanner. The volunteer gave written informed consent prior to participation. The study was approved by the local ethical committee.
Results
In Figures 2a,b,c we present the resulting S2V values estimated by two different methods, with and without D0 variations. In order to evaluate the mean axon diameter we show histograms from three regions of the corpus callosum: genu, body and splenium (Fig. 2d). The mean axon diameter is proportional to the 1/S2V values.Discussion
Application of FAMEDcos presented a variant of the 3D oscillating gradients. In turn, it allowed us to evaluate the tissue parameters such as the S2V and mean neurite diameters in vivo at 7T. For this proof of principles we have chosen a narrow range of t- and b-values. For a more practical implementation, one needs to elaborate the changes in the sequence in order to achieve both shorter/longer diffusion times and higher b-values by recalling numerical optimisation7. Alternatively, a IDW variant with reduced gradient slew rate demands such as FAMED8, may be employed. At the same time, the obtained averaged metrics S2V and associated mean isotropic neurite diameters are in good agreement with know histological parameters, in particular, if D0 is varied when we fitting S2V via Eq. (1). In the future, we are going to perform more accurate frequency selections of 3D oscillating gradients that to be able to apply sophisticated biophysical diffusion models such as, for example, LEMONADE9.Conclusion
In the present work we have demonstrated an application of isotropic diffusion weighted MRI in the form of 3D oscillating gradients. As a consequence, new information about tissue organisation and novel biomarkers are accessible for research and clinical diagnostics.Acknowledgements
Authors thank PD Dr Valerij G. Kiselev for critical and fruitful discussions.References
- Mitra et al., Diffusion propagator as a probe of the structure of porous media. Phys Rev Lett 68 (1992) 3555.
- Novikov et al., Quantifying brain microstructure with diffusion MRI: Theory and parameter estimation. arXiv: 1612.02059v1 (2016).
- Vellmer et al., Comparative analysis of isotropic diffusion weighted imaging sequences. JMR 275 (2017) 137.
- Westin et al., Q-space trajectory imaging for multidimensional diffusion MRI of the human brain. Neuroimage 135 (2016) 345.
- Maximov et al., Fast isotropically weighted intravoxel incoherent motion brain imaging at 7T. NMR Biomed (submitted).
- Andersson and Sotiropoulos, An integrated approach to correction for off-resonance effects and subject movement in diffusion MR imaging. Neuroimage 125 (2016) 106.
- Sjolund et al., Constrained optimization of gradient waveforms for generalized diffusion encoding. JMR 261 (2015) 157-168.
- Vellmer et al., Anisotropic diffusion phantoms based on microcapillaries. JMR 279 (2017) 1-10.
- Novikov et al., Mapping orientational and microstructural metrics of neuronal integrity with in vivo diffusion MRI. arXiv:1609.09144 (2016).
Figures