3117
Stromal collagen content correlates with fast diffusivity signal fraction in breast lesions1Department of Physics, NTNU – Norwegian University of Science and Technology, Trondheim, Norway, 2Clinic of Radiology and Nuclear Medicine, St. Olavs University Hospital, Trondheim, Norway, 3Department of Pathology, University of California San Diego School of Medicine, San Diego, CA, United States, 4Department of Circulation and Medical Imaging, NTNU – Norwegian University of Science and Technology, Trondheim, Norway, 5Department of Cancer Research and Molecular Medicine, NTNU – Norwegian University of Science and Technology, Trondheim, Norway, 6Department of Surgery, St. Olavs University Hospital, Trondheim, Norway, 7Department of Radiology, University of California, San Diego, La Jolla, CA, United States, 8Department of Neurosciences, University of California, San Diego, La Jolla, CA, United States, 9Department of Clinical and Molecular Medicine, NTNU – Norwegian University of Science and Technology, Trondheim, Norway
Synopsis
The deviation from a monoexponential of the DW-signal decay towards higher b-values (>1000s/mm2) reflects the complex tissue microstructure. The biexponential decay model assumes that the signal is composed of two components with different diffusivity, possibly originating from two physically separated tissue components. In this study, we estimate the collagenous and non-collagenous extracellular contents in sixteen breast lesions using hematoxylin-eosin-saffron stained histological specimens and compare with pre-surgical in vivo DW-MRI data. Our results show that the signal fraction of the faster diffusivity component correlated significantly with collagen content, suggesting that collagen contributes to the DWI signal decay
Introduction
Diffusion weighted imaging (DWI) is becoming an important tool in detection and characterization of breast cancer. Drawing conclusions about the tissue microstructure from the b-value dependence of the DWI signal is difficult due to the non-unique relationship between microstructure and observed signal decay.1 In the biexponential decay model,2 the signal is modelled as the sum of two separate components with different diffusivity:
$$\frac{S_{b}}{S_{0}}=f_{fast}\exp(-bD_{fast})+f_{slow}\exp(-bD_{slow})$$
where ffast and fslow are the signal fraction of the fast and the slow component and $$$f_{fast}+f_{slow}=1$$$. Although
this function can fit the data well for low-to-high b-values (e.g.
b=200–3000s/mm2), this alone does
not validate an interpretation of the signal arising from actual physical
compartments like extracellular and intracellular space. The purpose of this
work was to study the possible correlation of ffast in breast lesions with the fraction of extracellular
space as obtained from histologic samples. In particular, we are interested in
studying the effect of stromal collagen.
Methods
This study was approved by our institutional ethics committee and included 16 patients with written informed consent (2 benign, 13 malignant and 1 DCIS). The final diagnosis was based on histopathologic examination of the resected lesions.
The patients had an MRI scan prior to surgery (Siemens Skyra 3T, 16-channel breast coil). DW-MRI with a Stejskal-Tanner SE-EPI sequence was acquired with: TR/TE=10600/88ms, matrix 90x90, in-plane res: 2x2mm, slice-thickness 2.5mm, 7 b-values in 6 directions: 0, 200, 600, 1200, 1800, 2400, 3000s/mm2. For distortion correction,3 an additional b0 image with reversed phase encoding was acquired. Finally, DCE-MRI was performed with geometrically matched slices.
DWI images were corrected for motion, geometric distortion, eddy current artefacts and noise. Lesion volumes were outlined by 3D-ROIs in the b600 trace image, with visual guidance from the post-contrast DCE images. Biexponential fitting was done on the averaged ROI signal from the trace image, excluding b0 to avoid perfusion effects.
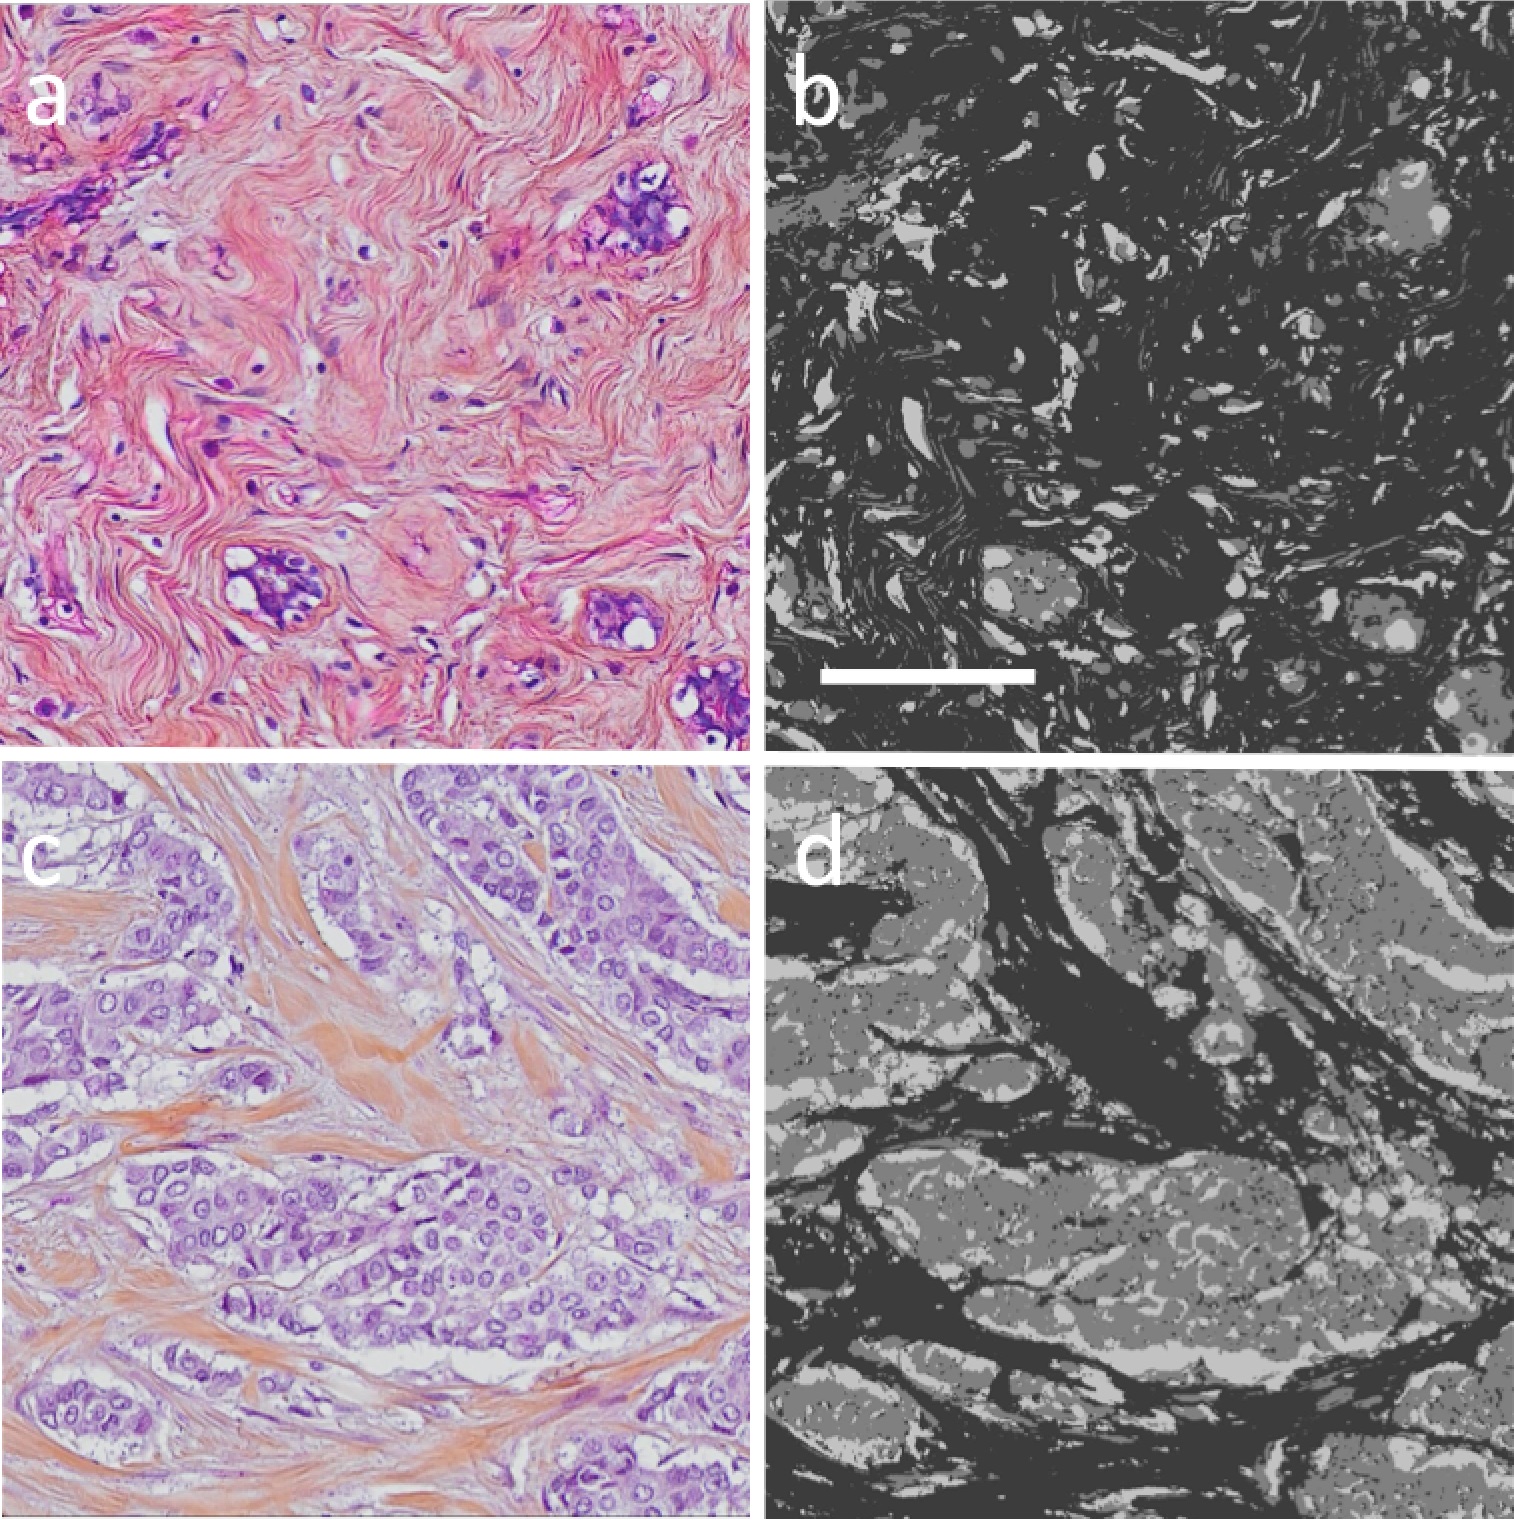
Formalin-fixed, paraffin-embedded tissue from the resected lesions were sectioned at 4μm thickness and stained with hematoxylin-eosin-saffron (HES). Digital whole slide images (WSIs) were acquired using a microscope slide-scanner (20x objective, Olympus VS120).
HES stains cell nuclei dark blue/purple and cytoplasmic proteins pink. Saffron stains collagen yellow and gives the fibers a yellowish tone with traces of pink. The separation in colors makes it possible to distinguish cellular areas (nuclei and cytoplasm) from areas containing collagen. The cellular and collagen content of each lesion were estimated by segmentation of the WSI within the lesion ROI using an in-house developed automated software based on color deconvolution,4 with stain vectors obtained from one of the images. The segmented image consists of an intracellular area (IC), an extracellular collagen area (ECcollagen) and a non-collagen extracellular area (ECnon-collagen), representing non-collagen stroma along with free space compartments (Examples in Figure 1).
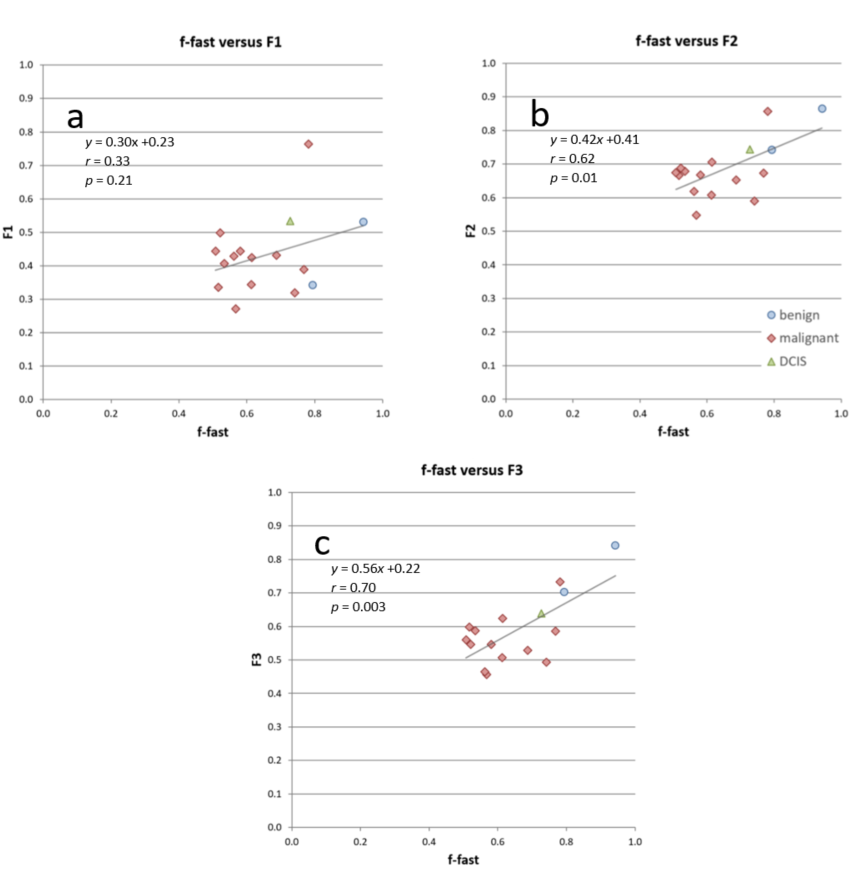
To study the effect of stromal collagen content on ffast, the extracellular area (EC) was defined in three alternative ways:
$$EC_{1}=EC_{non-collagen}$$
$$EC_{2}=EC_{non-collagen} + EC_{collagen}$$
$$EC_{3}=EC_{collagen}$$
and calculated the corresponding extracellular area fractions $$$F_{n}=\frac{EC_{n}}{IC+EC_{n}}$$$, with n=1,2,3.
Results
Histological analysis: Median(interquartile range) intracellular area: 33(27–37)%, stromal collagen area 41(39–48)% and non-collagen extracellular area: 22(17–28)%. Significant, moderate correlation (Pearson’s r) was found between F2 and ffast (r=0.62, p=0.01), and F3 and ffast (r=0.70, p=0.003), while correlation between F1 and ffast was low and non-significant (r=0.33, p=0.21). Scatter plots of the extracellular compartments and ffast are shown in Figure 2.Discussion
Excluding collagen from the extracellular space yielded low non-significant correlation with ffast, while including collagen gave moderate correlation for both F1 and F2. This indicates that stromal collagen contributes to signal decay in DWI. By definition, the correlation between the extracellular fraction and ffast is identical to the correlation between the intracellular fraction and fslow. Hence, this study also illustrates that a measurement of the correlation between cellularity and fslow is sensitive to how the extracellular compartment is defined. Some previous studies have chosen to exclude the collagen compartment from such analysis.5
Histological sample preparation may cause some deformation and loss of tissue and might introduce an artificial increase in ECnon-collagen compared to tissue in vivo. Another limitation of the study is the low sample size and limited range of EC-values, which was partly due to a low number of benign lesions. This is caused by a low proportion of benign lesions being surgically removed. In follow-up, the data set should be extended with more benign lesions and samples of healthy fibroglandular tissue.
In conclusion, stromal collagen in breast lesions as measured from histology correlates with the signal fraction of the fast diffusion component, suggesting that the stromal collagen space contributes to the DWI signal decay.
Acknowledgements
The Liaison Committee between the Central Norway Regional Health Authority and NTNU funded this project.References
1. Kiselev VG, Il'yasov KA. Is the "biexponential diffusion" biexponential?. Magn. Reson. Med. 2007;57:464-469.
2. Kärger J, Pfeifer H, Heink W. Principles and applications of self- diffusion measurements by nuclear magnetic resonance. Adv Magn Reson. 1988;12:1-89.
3. Holland D, Kuperman JM, Dale AM. Efficient correction of inhomogeneous static magnetic field-induced distortion in Echo Planar Imaging. Neuroimage. 2010;50(1),175-183.
4. Ruifrok AC, Johnston DA. Quantification of histochemical staining by color deconvolution. Anal Quant Cytol Histol. 2001;23(4):291-299.
5. Tamura T, Usui S, Murakami S, et al. Comparisons of multi b‐value DWI signal analysis with pathological specimen of breast cancer. Magn Reson Med. 2012;68(3):890-897.
Figures