3115
Towards the assessment of myelination using time-dependent diffusion MRI indices.1Université Côte d'Azur, Inria, Valbonne, France, 2Institut du Cerveau et de la Moelle épinière – ICM, Centre de NeuroImagerie de Recherche – CENIR, Paris, France, 3Sorbonne Universités, UPMC Univ Paris 06, Inserm U1127, CNRS UMR 7225, Paris, France, 4Inria, CEA, Université Paris-Saclay, Paris, France
Synopsis
We study the sensitivity of time-dependent diffusion MRI indices or qτ-indices to demyelination in the mouse brain. For this, we acquire in vivo four-dimentional diffusion-weighted images -varying over gradient strength, direction and diffusion time- and estimate the qτ-indices from the corpus callosum. First order Taylor approximation of each index gives fitting coefficients α and β whose variance we investigate. Results indicate that, cuprizone intoxication affects mainly index coefficient β by introducing inequality of variances between the two mice groups, most significantly in the splenium and that MSD increases and RTOP decreases over diffusion time τ.
Introduction
Time-dependent diffusion is increasingly becoming popular among the diffusion MRI (dMRI) community1, 2, 3, 4 . We propose, for the very first time to our knowledge, to explore the potential of the time-dependent diffusion microstructure indices (q$$$\tau$$$-indices) as accurate biomarkers in order to understand and efficiently treat myelin-related pathologies, in vivo and non invasively. Here, as a preliminary study, we use the cuprizone mouse model5, 6 to investigate the sensitivity of the q$$$\tau$$$-indices to demyelination in the corpus callosum. We acquire in vivo time-varying diffusion-weighted images using the sparse four-dimensional diffusion signal represented in terms of functional basis4, taking into consideration both the tree-dimensional q-space and diffusion time $$$\tau$$$.Methods
In this study, we consider the time-dependent dMRI indices4. These microstructure indices correspond to the three-dimensional q-space scalar indices7,8 evaluated over diffusion time $$$\tau$$$. That is, the time-dependent Return-To-Origin Probability (RTOP), Return-To-Axis Probability (RTAP), Return-To-Plane Probability (RTPP) and Mean Squared Displacement (MSD). These are referred to as q$$$\tau$$$-indices and are estimated using the sparse four-dimensional diffusion signal representation. For illustration, we focus on MSD and RTOP in this preliminary study.
Index coefficients approximation: To compare the q$$$\tau$$$-indices from the corpus callosum regions of the two mice groups, each index is formulated as a function of time $$$\tau$$$: $$$index(\tau)$$$. Then, in the logarithmic scale illustrated in Fig. 2, the first order Taylor approximation of $$$\log{}(index(\tau))$$$ fits a linear function of $$$\log{}\tau$$$, $$$\alpha\log{}\tau +\log{}\beta$$$ to $$$\log{}(index(\tau))$$$. For each q$$$\tau$$$-index, the coefficients $$$\alpha$$$ and $$$\log{}\beta$$$ are estimated by a least square approach then the exponent of the linear line is taken $$index(\tau) \simeq \exp(\alpha\log{}\tau+\log{}\beta+\mathcal{\Omega}(\log{}\tau)) = \beta \tau^\alpha\mathcal{\Omega}(\log{}\tau) \quad (1) $$
Given an index, $$$\alpha$$$ and $$$\log{}\beta$$$ respectively correspond to the slope and intercept of the linear system that best fits the index in the log scale.
In vivo acquisitions: We acquire in vivo diffusion images of the brains of controls and cuprizone-treated mice on a $$$11.7$$$ Tesla Bruker scanner. We use the q$$$\tau$$$-dMRI acquisition scheme4 defined in q$$$\tau$$$ space so as to account for both three-dimensional q-space and diffusion time $$$\tau$$$, but with drastically less q$$$\tau$$$-samples using the relaxed probabilistic model9 for down-sampling purpose. The data consist of $$$80 \times 160 \times 5$$$ voxels of size $$$0.1 \times 0.1 \times 0.5$$$ mm3 for a total of $$$515$$$ diffusion-weighted images from each mouse.
Data preparation: We use FSL’s eddy to correct the data from eddy currents and motion artifacts. We then manually create a mask from the fractional anisotropy (FA) map, as pictured in Fig. 1, to segment the corpus callosum and separate three regions of interest: genu, body and splenium.
Results and discussion
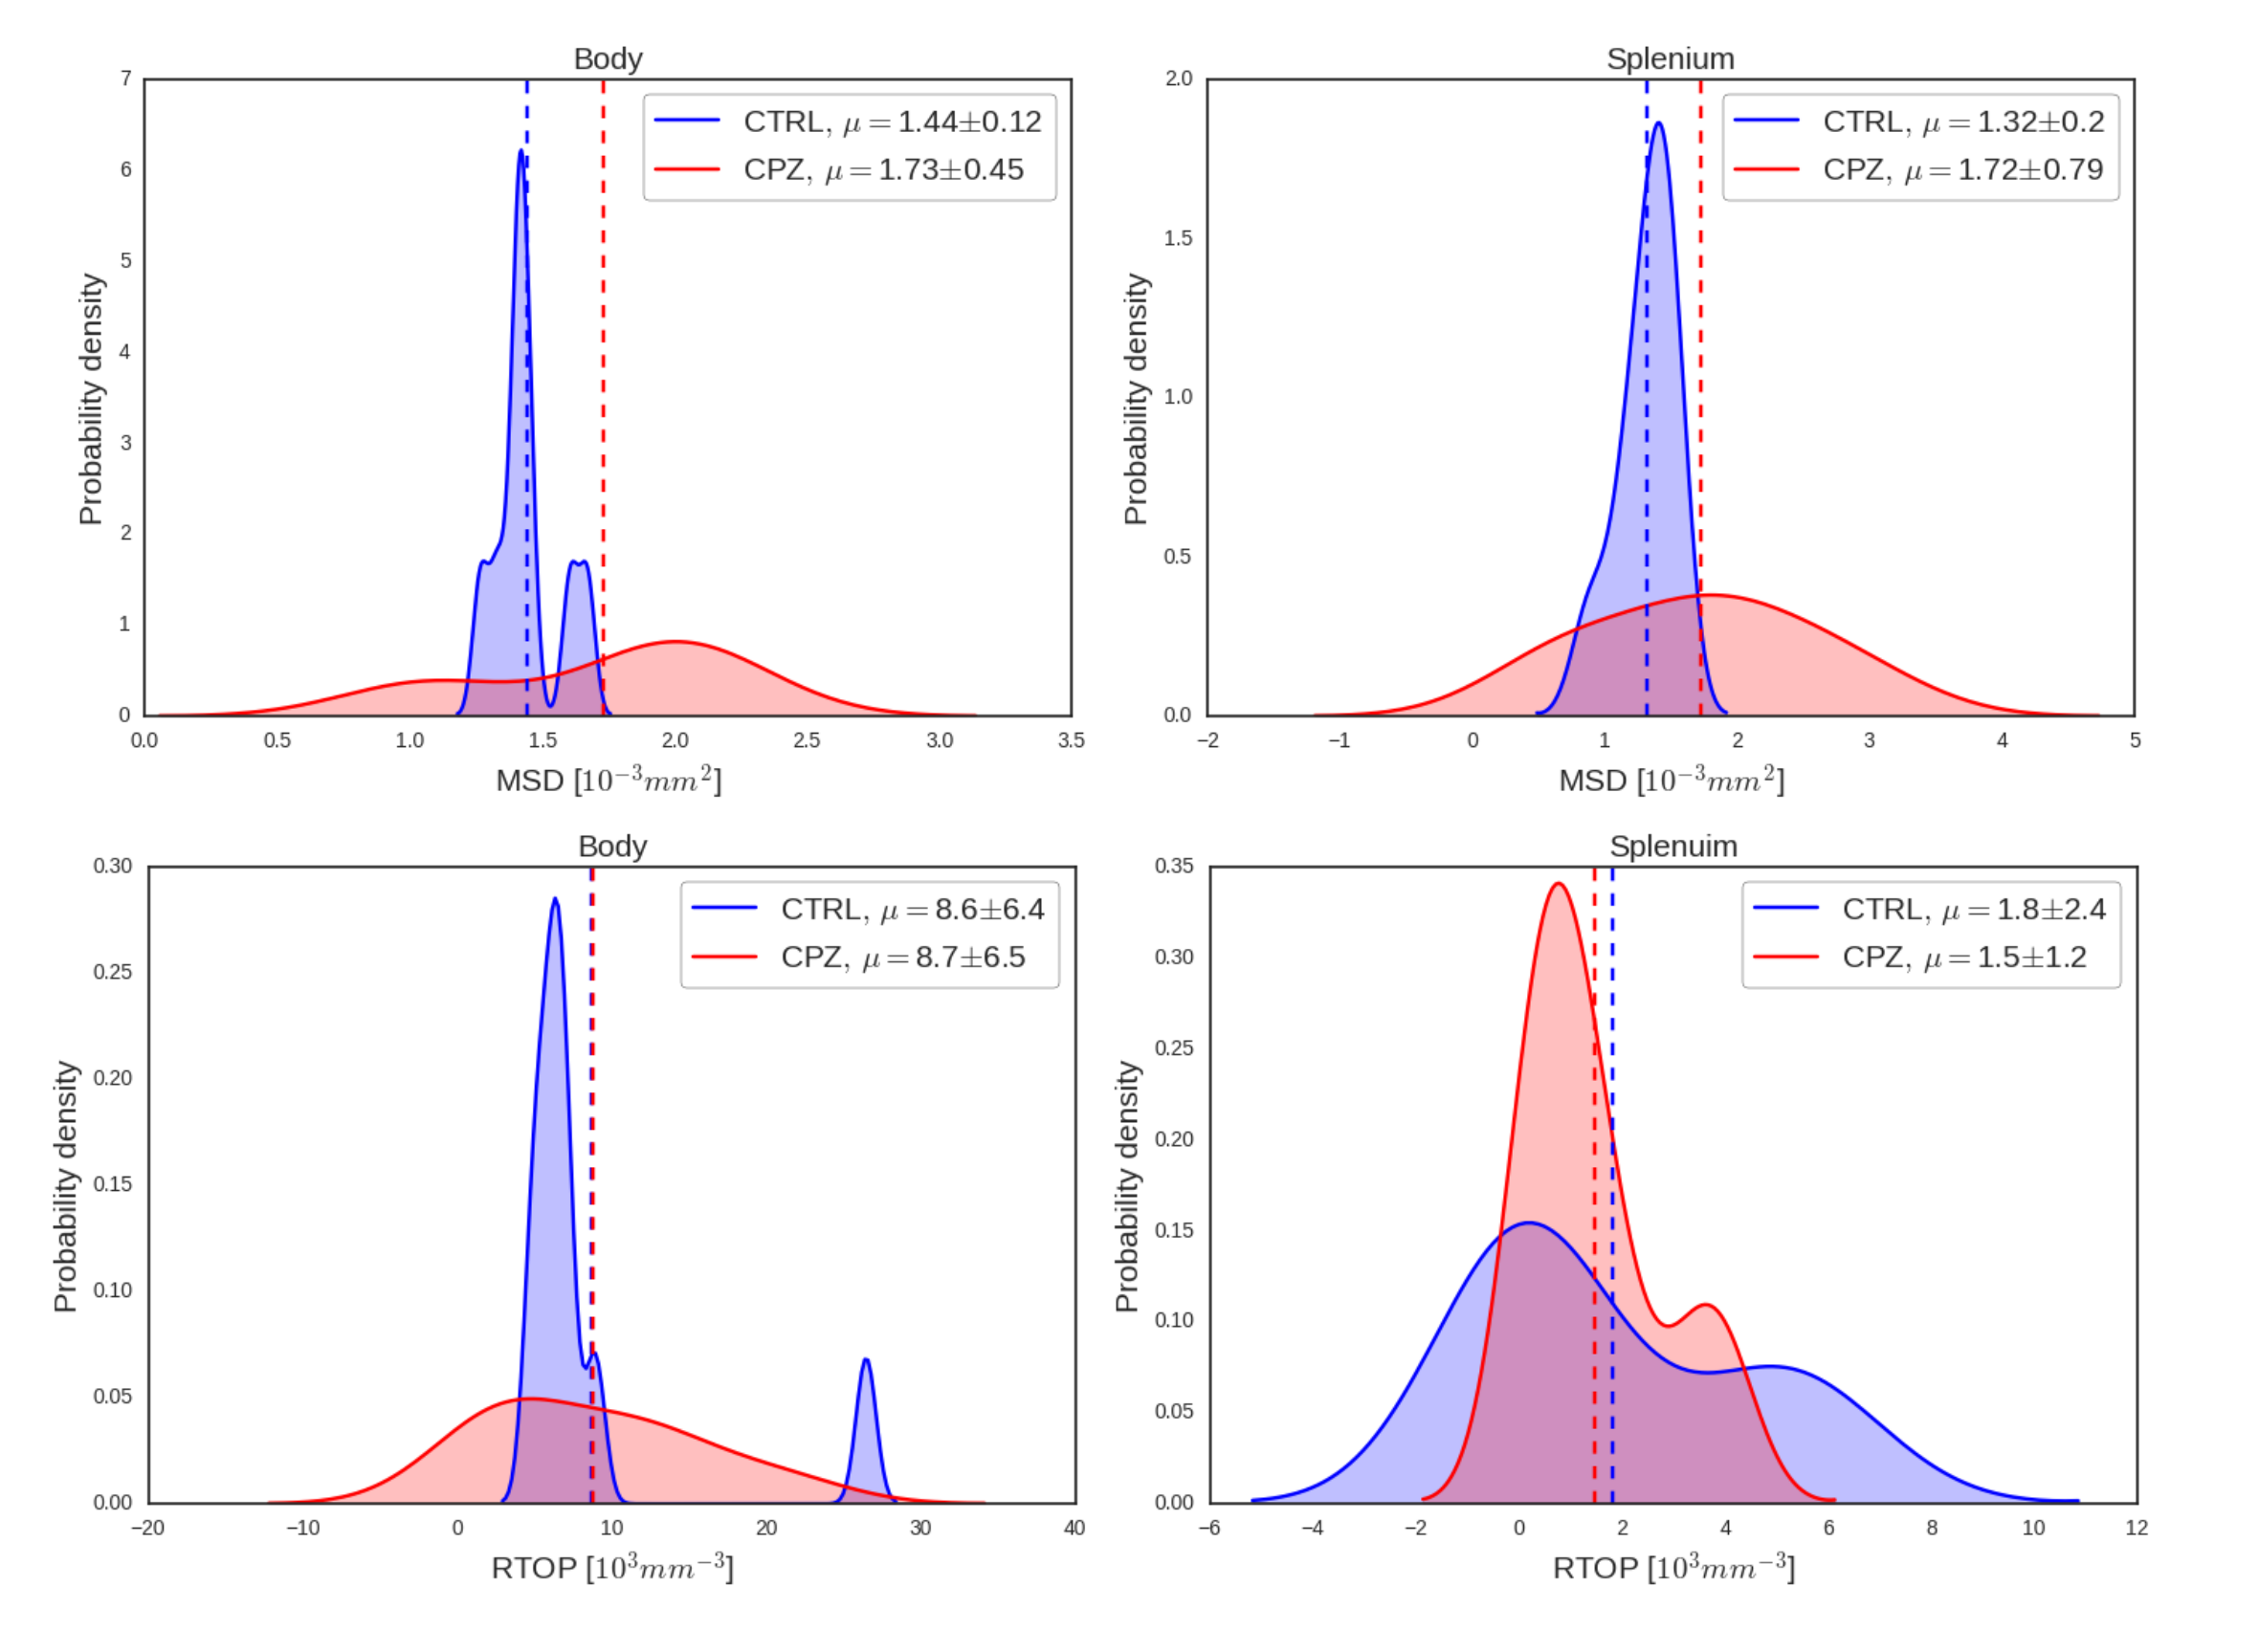
Fig. 2 indicates that, at short diffusion $$$\tau$$$, time-dependent q$$$\tau$$$-indices are approximated by the first order Taylor in the logarithmic scale. To assess cuprizone effects on q$$$\tau$$$-indices, our analysis focuses on the derived $$$\beta$$$ coefficients. Results concerning the slope $$$\alpha$$$ are discarded since $$$\alpha$$$ does not vary very notably between mice groups. As cuprizone induces myeline changes mainly in the corpus callosum, we test the homogeneity of variances of $$$\beta$$$ estimated from MSD and RTOP. In Fig. 3, for both q$$$\tau$$$-indices, difference of variances is significant in the splenium of the corpus callosum. It is the same in the body for MSD but no significant inhomogeneity is observed elsewhere. Fig. 4 supports this trend by showing large variances of $$$\beta$$$ between mice groups, more specifically in the splenium, considering both q$$$\tau$$$-indices. Overall, $$$\beta$$$ coefficients of indices determined from the splenium are the most impacted as expected because this region is the most readily affected by cuprizone10. Moreover, MSD increases and RTOP decreases over time, see Fig. 2. Indeed as diffusion $$$\tau$$$ increases, spins have more time to diffuse, traveling longer distances and reducing their chance to return at the origin7.
Conclusion
This abstract presents our preliminary results of the potential of time-dependent dMRI q$$$\tau$$$-indices as in vivo biomakers for myeline-related pathologies through the cuprizone mouse model. We focused on the cuprizone effects on the variance of $$$\beta$$$ coefficient derived from time-dependent MSD and RTOP indices. First order Taylor approximation of each q$$$\tau$$$-index gives fitting coefficients $$$\alpha$$$ and $$$\beta$$$ whose physical or physiological meanings are still unknown, however they can be used to quantify the changes caused by cuprizone-induced demyelination.Acknowledgements
This work was partly supported by ANR “MOSIFAH” under ANR-13-MONU-0 0 09-01, the ERC under the European Union’s Horizon2020 research and innovation program (ERC Advanced Grant agreement no 694665: CoBCoM), MAXIMS grant funded by ICM’s The BigBrain Theory Program and ANR-10-IAIHU-06.
References
1. Bihan, Denis Le. "Molecular diffusion, tissue microdynamics and microstructure." NMR in Biomedicine 8.7 (1995): 375-386.
2. Novikov, Dmitry S., et al. "Revealing mesoscopic structural universality with diffusion." Proceedings of the National Academy of Sciences 111.14 (2014): 5088-5093.
3. Fieremans, Els, et al. "In vivo observation and biophysical interpretation of time-dependent diffusion in human white matter." NeuroImage 129 (2016): 414-427.
4. Fick, Rutger HJ, et al. "Non-parametric graphnet-regularized representation of dMRI in space and time." Medical Image Analysis 43 (2018): 37-53.
5. Praet, Jelle, et al. "Cellular and molecular neuropathology of the cuprizone mouse model: clinical relevance for multiple sclerosis." Neuroscience & Biobehavioral Reviews 47 (2014): 485-505.
6. Jelescu, Ileana O., et al. "In vivo quantification of demyelination and recovery using compartment-specific diffusion MRI metrics validated by electron microscopy." Neuroimage 132 (2016): 104-114.
7. Özarslan, Evren, et al. "Mean apparent propagator (MAP) MRI: a novel diffusion imaging method for mapping tissue microstructure." NeuroImage 78 (2013): 16-32.
8. Fick, Rutger HJ, et al. "MAPL: Tissue microstructure estimation using Laplacian-regularized MAP-MRI and its application to HCP data." NeuroImage 134 (2016): 365-385.
9. Filipiak, Patryk, et al. "Spatio-Temporal dMRI Acquisition Design: Reducing the Number of q$$$\tau$$$ Samples Through a Relaxed Probabilistic Model." MICCAI 2017 Workshop on Computational Diffusion MRI (CDMRI 2017). 2017.
10. Steelman, Andrew J., Jeffrey P. Thompson, and Jianrong Li.
"Demyelination and remyelination in anatomically distinct regions of the
corpus callosum following cuprizone intoxication." Neuroscience research 72.1 (2012): 32-42.
Figures
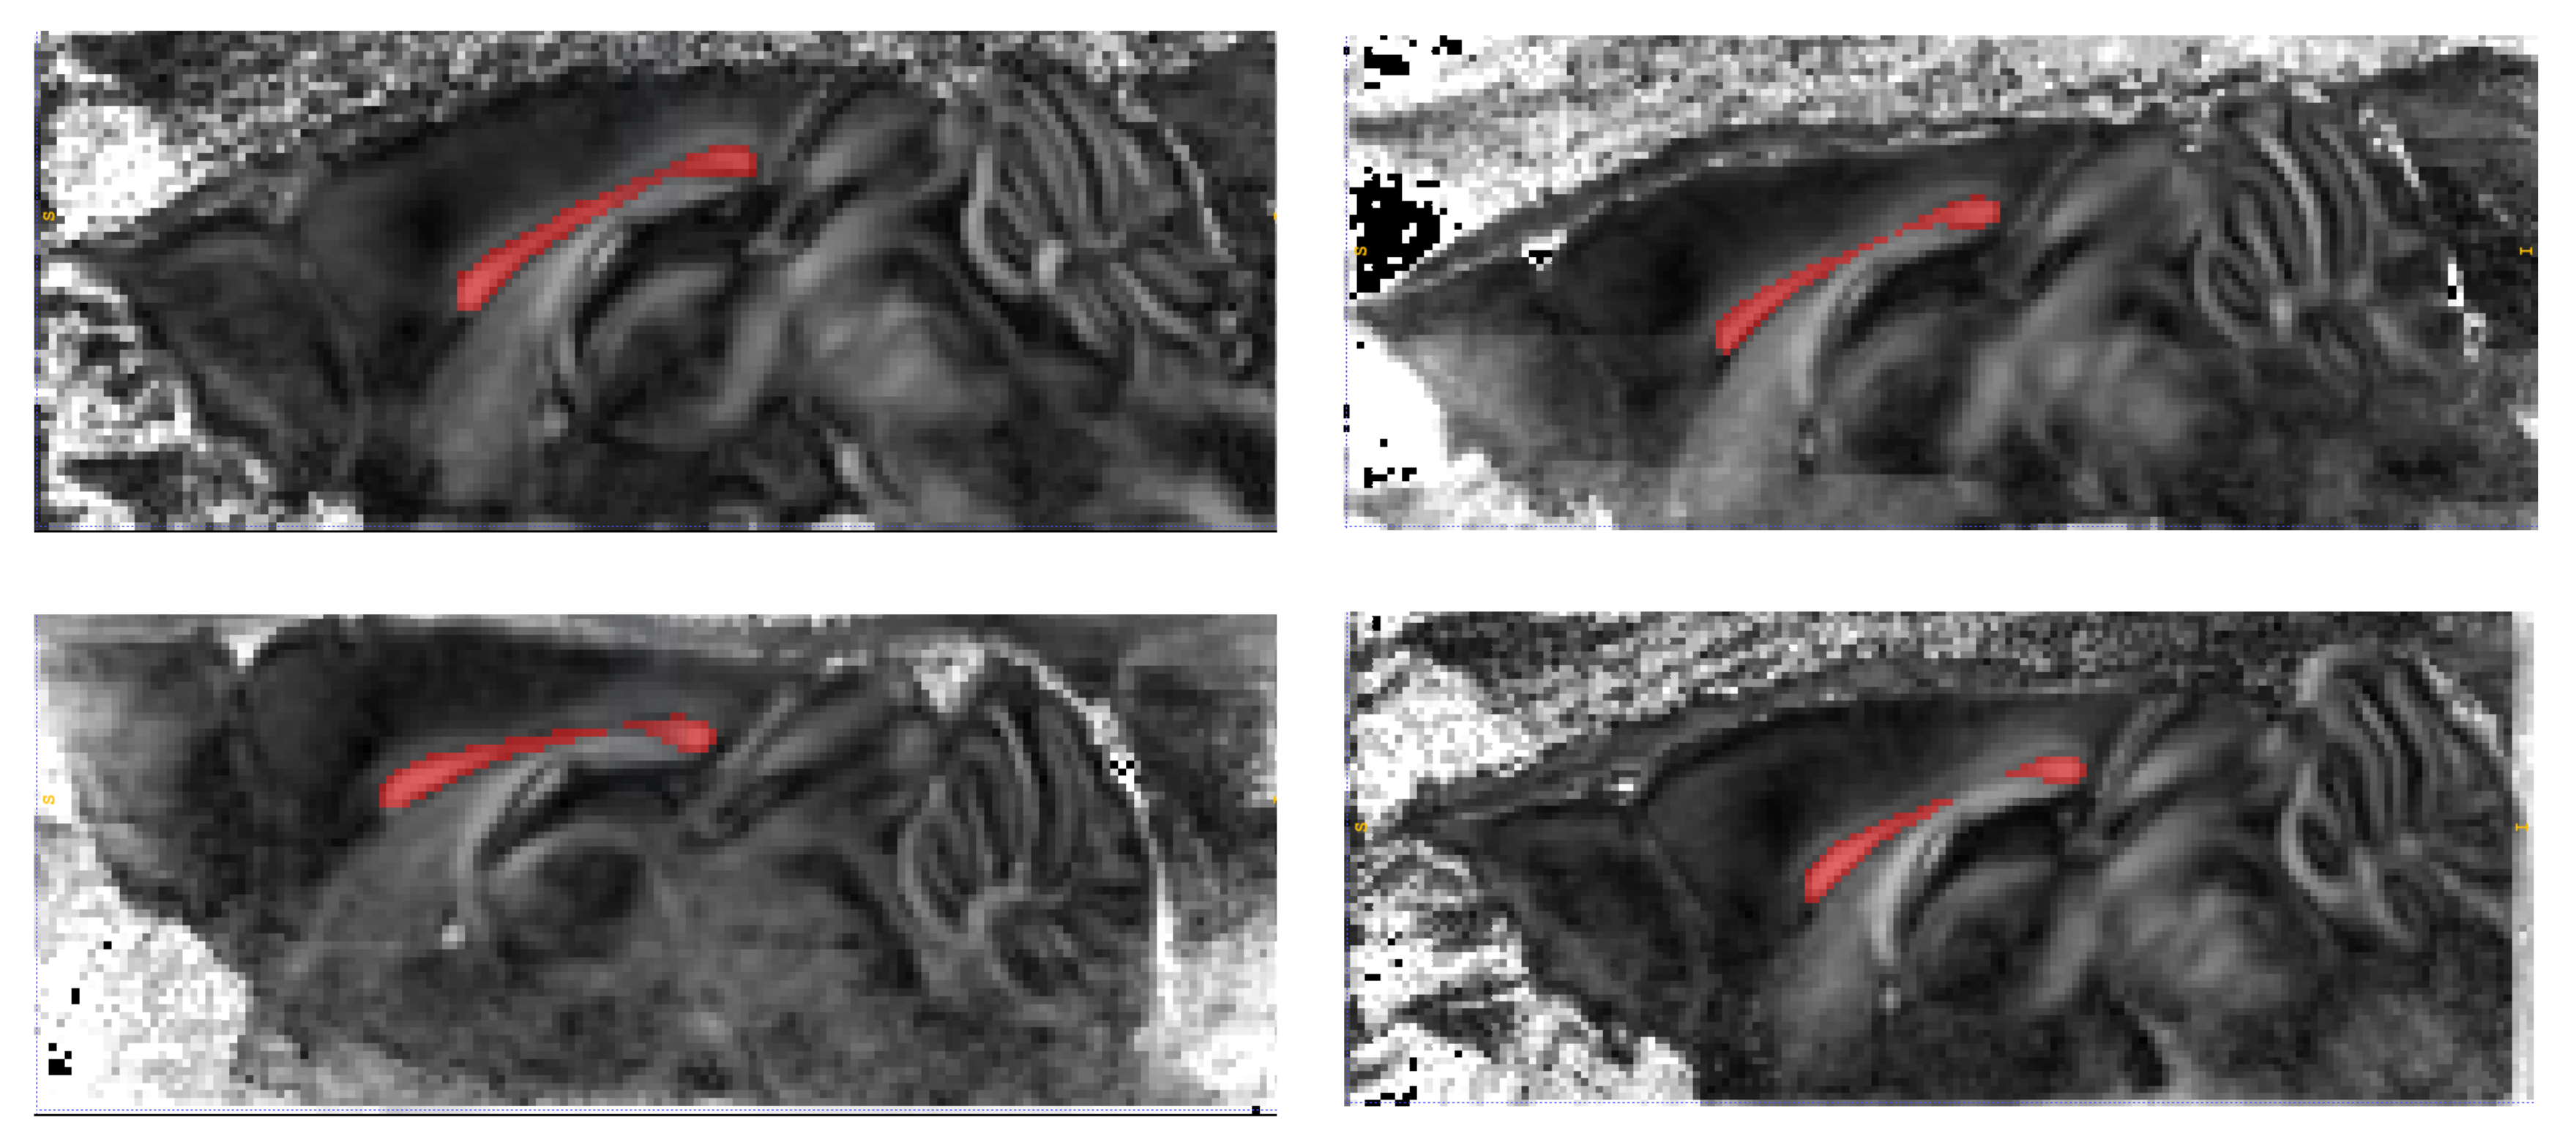
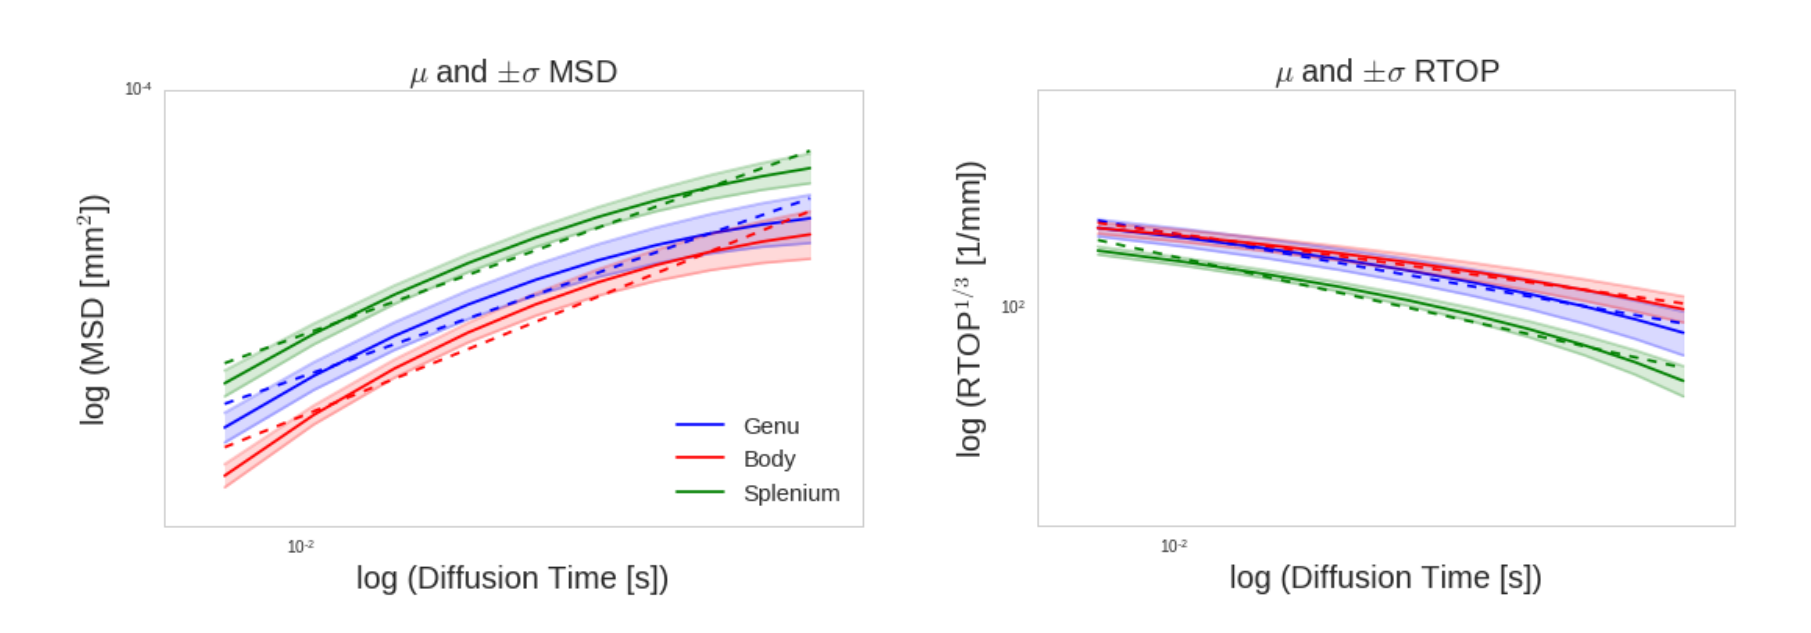
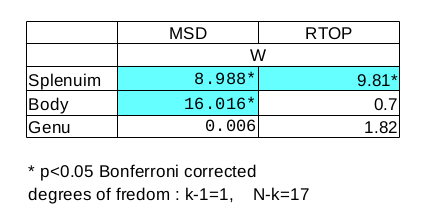
Figure 3. Levene's test for equality of variances of estimated β between controls and cuprizone-fed mice. After Bonferroni correction, significant results are highlighted in cyan (p<0.05).