3111
Exchange arising from myelin water revealed from temperature-dependent multiexponential T2 mappingNoam Shemesh1 and Mark D Does2
1Champalimaud Research, Champalimaud Centre for the Unknown, Lisbon, Portugal, 2Biomedical Engineering, Vanderbilt University, Nashville, TN, United States
Synopsis
The importance of myelin water exchange in relaxation and diffusion metrics extracted from tissues is still an open question. In particular, to what extent myelin water fraction (MWF) values derived from multiexponential T2 are due to exchange between myelin and intra/extra axonal spaces remains unclear. Here, fixed rat spinal cords were subject to temperature-dependent multiple spin echo experiments, aiming to probe how exchange modulates quantitative T2 maps in rat spinal cords. We find signatures for exchange from T2 shift patterns, which are tightly linked to the axon diameters in the spinal cord.
Introduction
Multiexponential T2 (MET2) provides exquisite contrast in white matter, and is capable of quantitatively reporting on the myelin water fraction. A crucial question in this context, is whether and how exchange between intra/extra axonal spaces and myelin contributes to the observed contrasts. Previous studies in rat spinal cord, have reported variations in MET2 across white matter tracts that are consistent with variations in inter-compartmental water change due to variations in axon diameter and myelin thickness1,2. Here, we probe this model system further through temperature-dependent multiexponential T2 experiments. We hypothesize that whereas a decrease in rotational correlation time due to temperature increase would be similar for all compartments and would result in a simple shift of T2 spectra to higher values, increased exchange rate (due to temperature) would be reflected as a more complex progress whereby both component T2 values and amplitudes shift and, in the limit, the spectrum of T2 components becomes mono-exponential.Methods
MRI experiments. All experiments involving animals were preapproved by the institutional committee according to EU and national law. Excised and chemically fixed rat spinal cords (n = 2) were imaged in 5 mm NMR tubes on a 16.4 T Bruker Aeon Ascend scanner equipped with a micro5 probe capable of generating up to 3 T/m isotropically. A single-slice multiple spin echo (MSE) sequence was executed with the following parameters: 55x55x1000 (µm)3 resolution, refocusing-to-excitation bandwidth ratio of 6.67, and 90 echoes acquired with 2.1 ms intervals from 2.7 ms, TR = 3000 ms and number of averages = 16. The experiments were conducted at ~23+/-1 C and then 37 +/-1 C, in each case the sample was allowed to equilibrate with the target temperature for at least 3h prior to imaging. Data analysis. Images underwent MP-PCA denoising over a moving 9x9 region and then and Gibbs unringing using in-house written code. These procedures only improve data quality without any adverse effects on image resolution or observed MET2 characteristics (ISMRM 2018, submitted). The processed images were then fit voxelwise to 100 spectral components with T2 values log-spaced between 2 and 190 ms. The spectra were smoothed by minimum-curvature constraint and extended phase graph analysis was used to account for potential B1+ inhomogeneity. Myelin water fractions (MWF) were computed as the fraction of spectral components with peak T2 smaller than 17 ms.Results
Figure 1 shows images at two different TEs for each temperature from one representative spinal cord (each row is plotted with the same grayscale). The data quality is excellent despite the very high spatial resolution. The decays from the seven major spinal cord tracts at 23C (filled symbols) and 37C (hollow symbols) are plotted in Figure 2 (split to two panels for convenience). In all tracts, multiexponential decays are clearly different. The ensuing T2 spectra at each temperature (Figure 3) reveal that when the temperature is increased, myelin water fraction substantially decreases in most tracts. Figure 4 shows the MWF and OWF maps at the two temperatures, revealing the spatial coherence of these trends. Finally, the change in MWF and OWF is given in Figure 5. The dCST clearly evidences the largest change in MWF with temperature with ~40% decrease, while the VST clearly evidences the smallest T2 changes in MWG, with ~5% decrease.Discussion
To our knowledge, these results are the first to describe tract-specific temperature dependence of each T2 component’s fractions. In a simple solution with no exchange, T2s would invariably increase with temperature, without change in fractions; however, the observations here point to a process whereby the MWF is reduced in a tract-specific manner. Interestingly, this would be the expected behavior when exchange occurs; even more interestingly, the dCST, which has the smallest axons and hence the thinnest myelin sheath, exhibits the largest change in MWF with temperature; the VST, with its largest axons, exhibits the smallest effect, suggesting that the exchange between myelin and other components is strongly modulated by the thickness of the myelin. Such experiments may be useful for understanding how microstructure interacts with relaxation and diffusion processes in tissues.Conclusions
Evidence towards axon-size dependent exchange between myelin water and the other compartments was revealed, thus contributing to a better understanding of the role of myelin in microstructural mapping.Acknowledgements
This study was supported by funding from the European Research Council (ERC) under the European Union’s Horizon 2020 research and innovation programme (Starting Grant, agreement No. 679058) and NIH EB019980.References
1. Dula, A.N. et al., 2010. Multiexponential T2, magnetization transfer, and quantitative histology in white matter tracts of rat spinal cord., 63(4), pp.902–909. 2. Harkins, K.D., Dula, A.N. & Does, M.D., 2012. Effect of intercompartmental water exchange on the apparent myelin water fraction in multiexponential T2 measurements of rat spinal cord., 67(3), pp.793–800.Figures
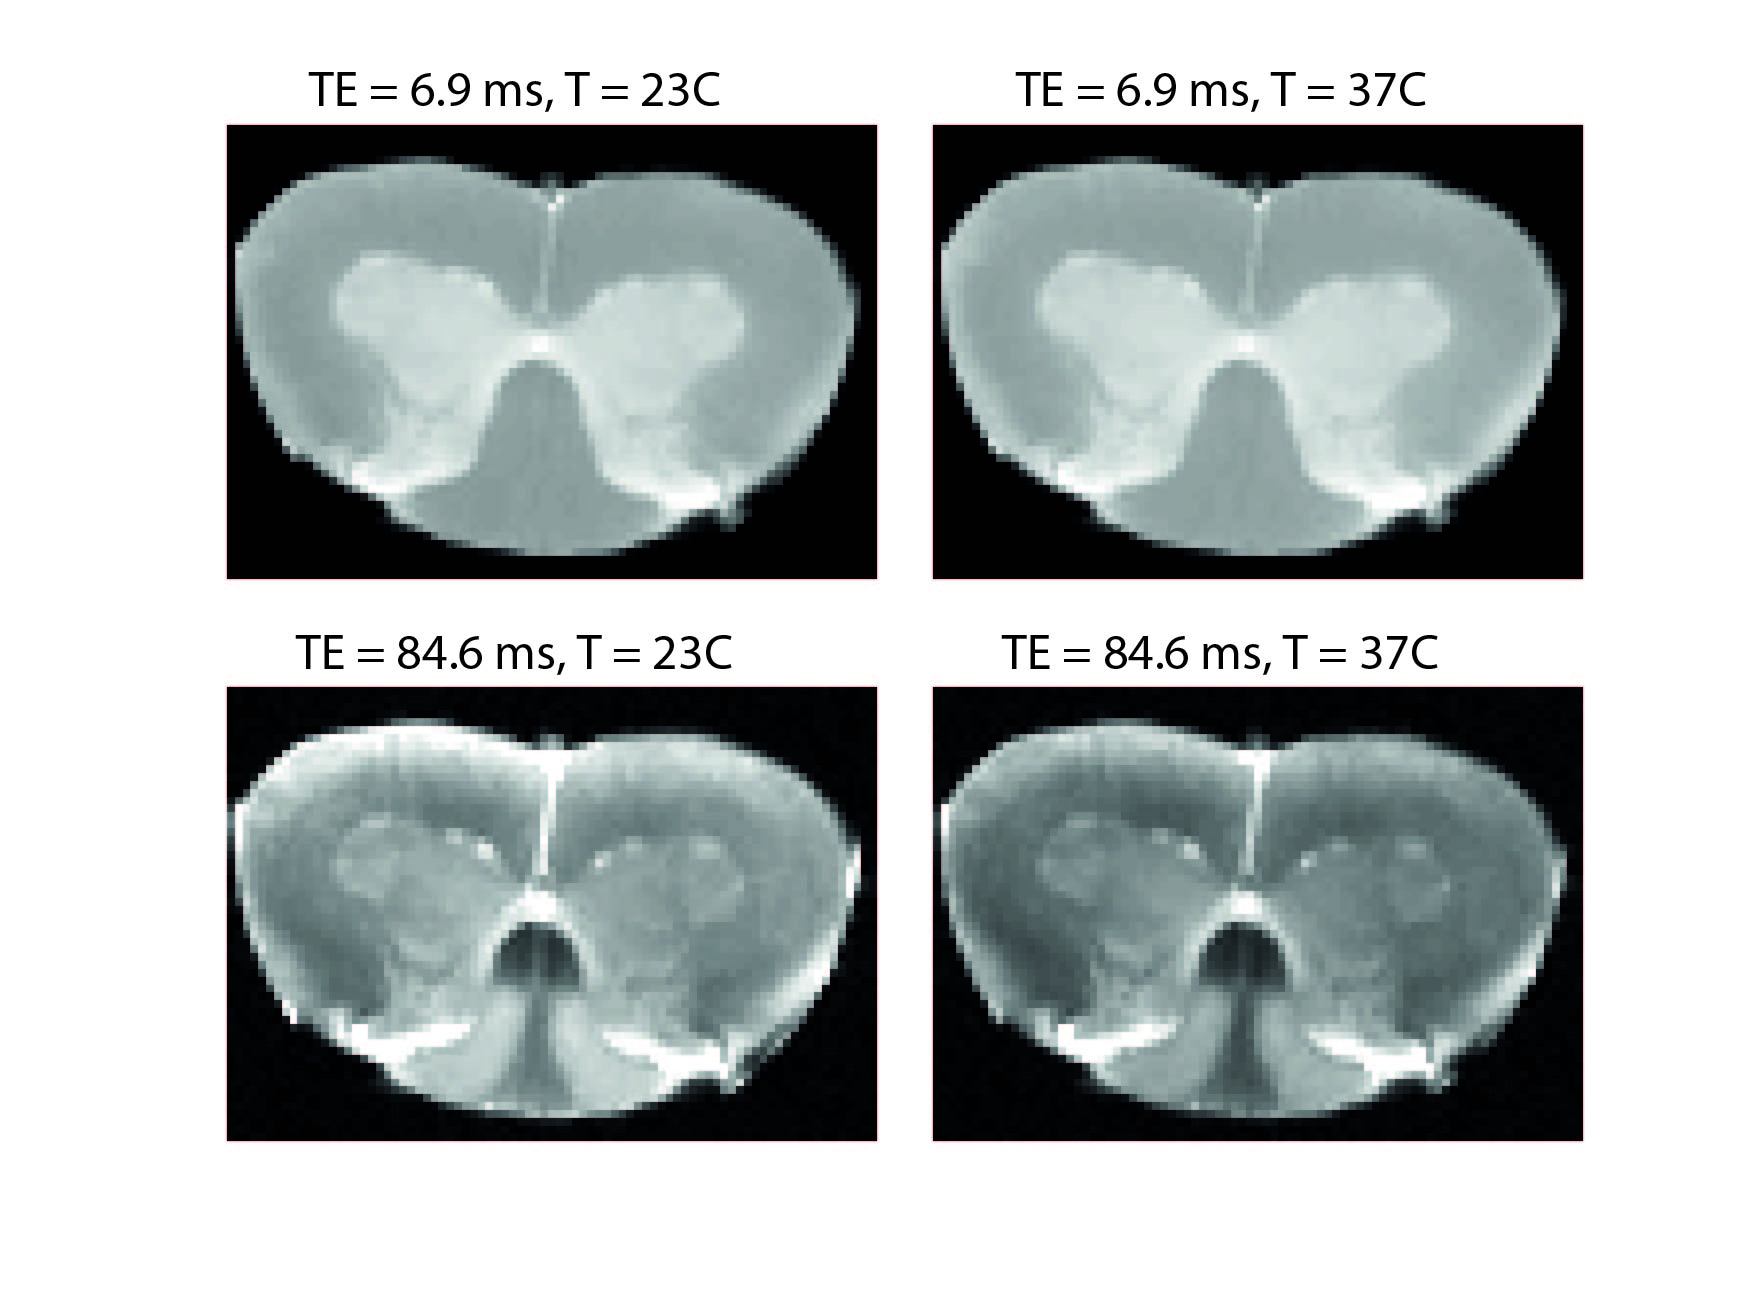
Figure 1. Raw
data from the experiments at short and long TEs, demonstrating the quality of
the raw data. Each row is plotted with the same scale but columns have
different scales.
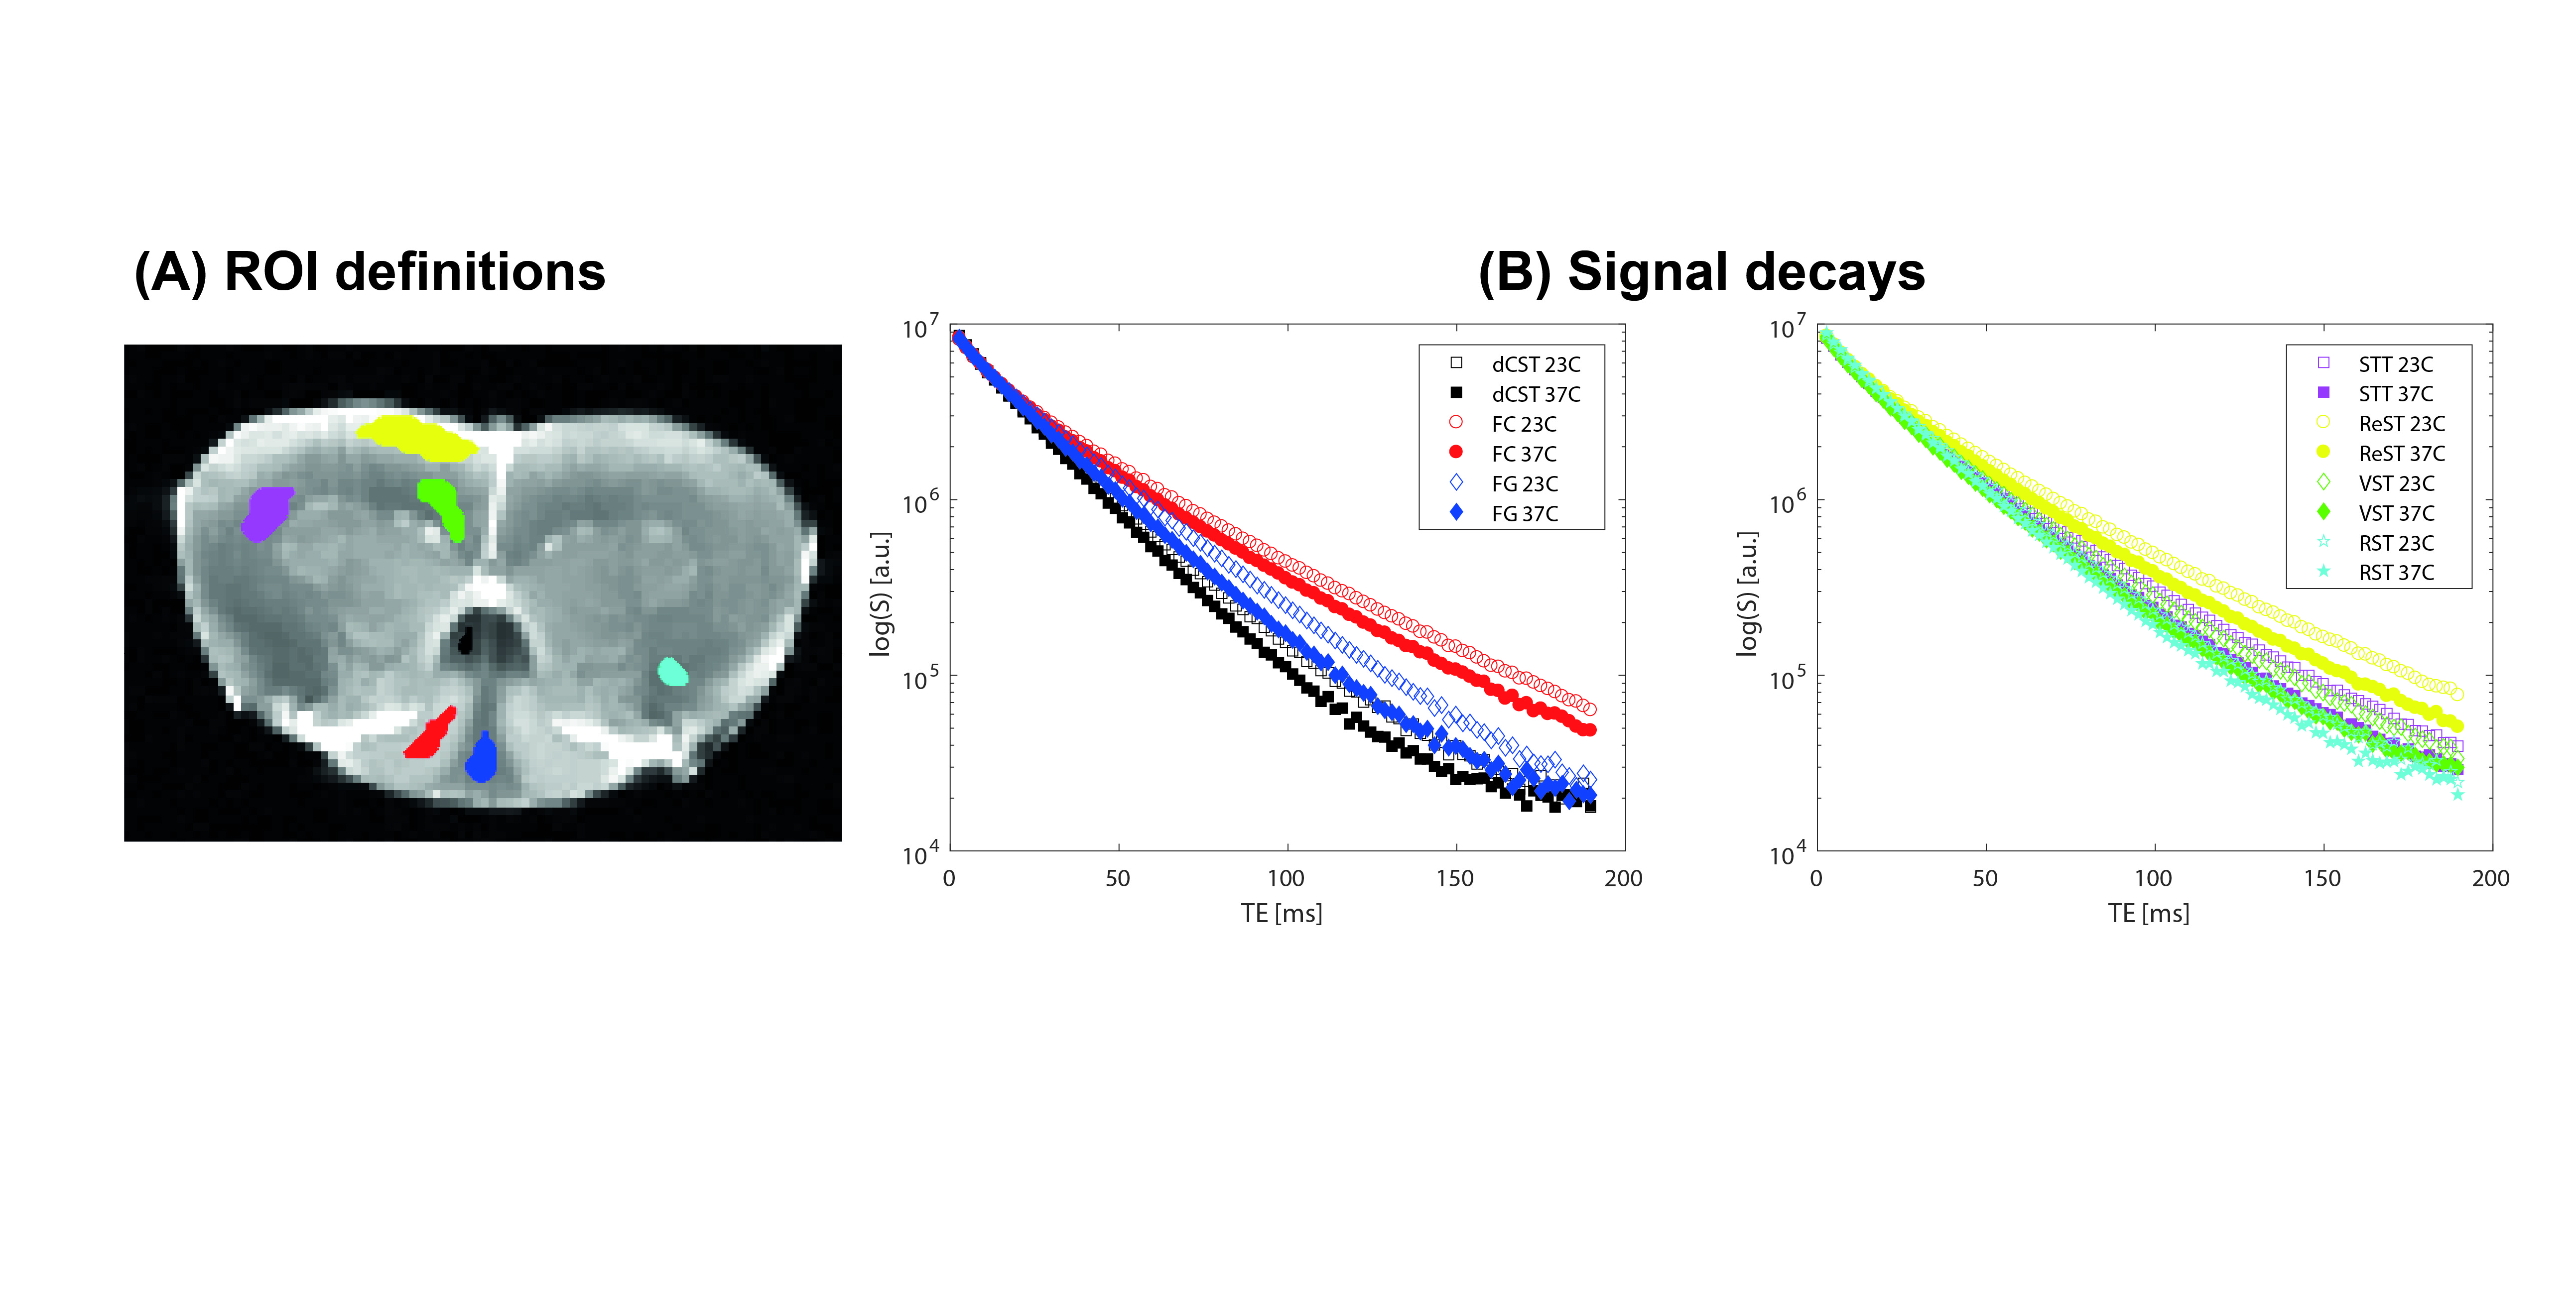
Figure 2. (A) ROI definition and (B) representative decays from the spinal cord tracts. These
log scale plots clearly exemplify nonexponential decays at 16.4 T for all ROIs
in the white matter. Filled
symbols represent experiments at 37C and hollow symbols indicate experiments
performed at 23C.
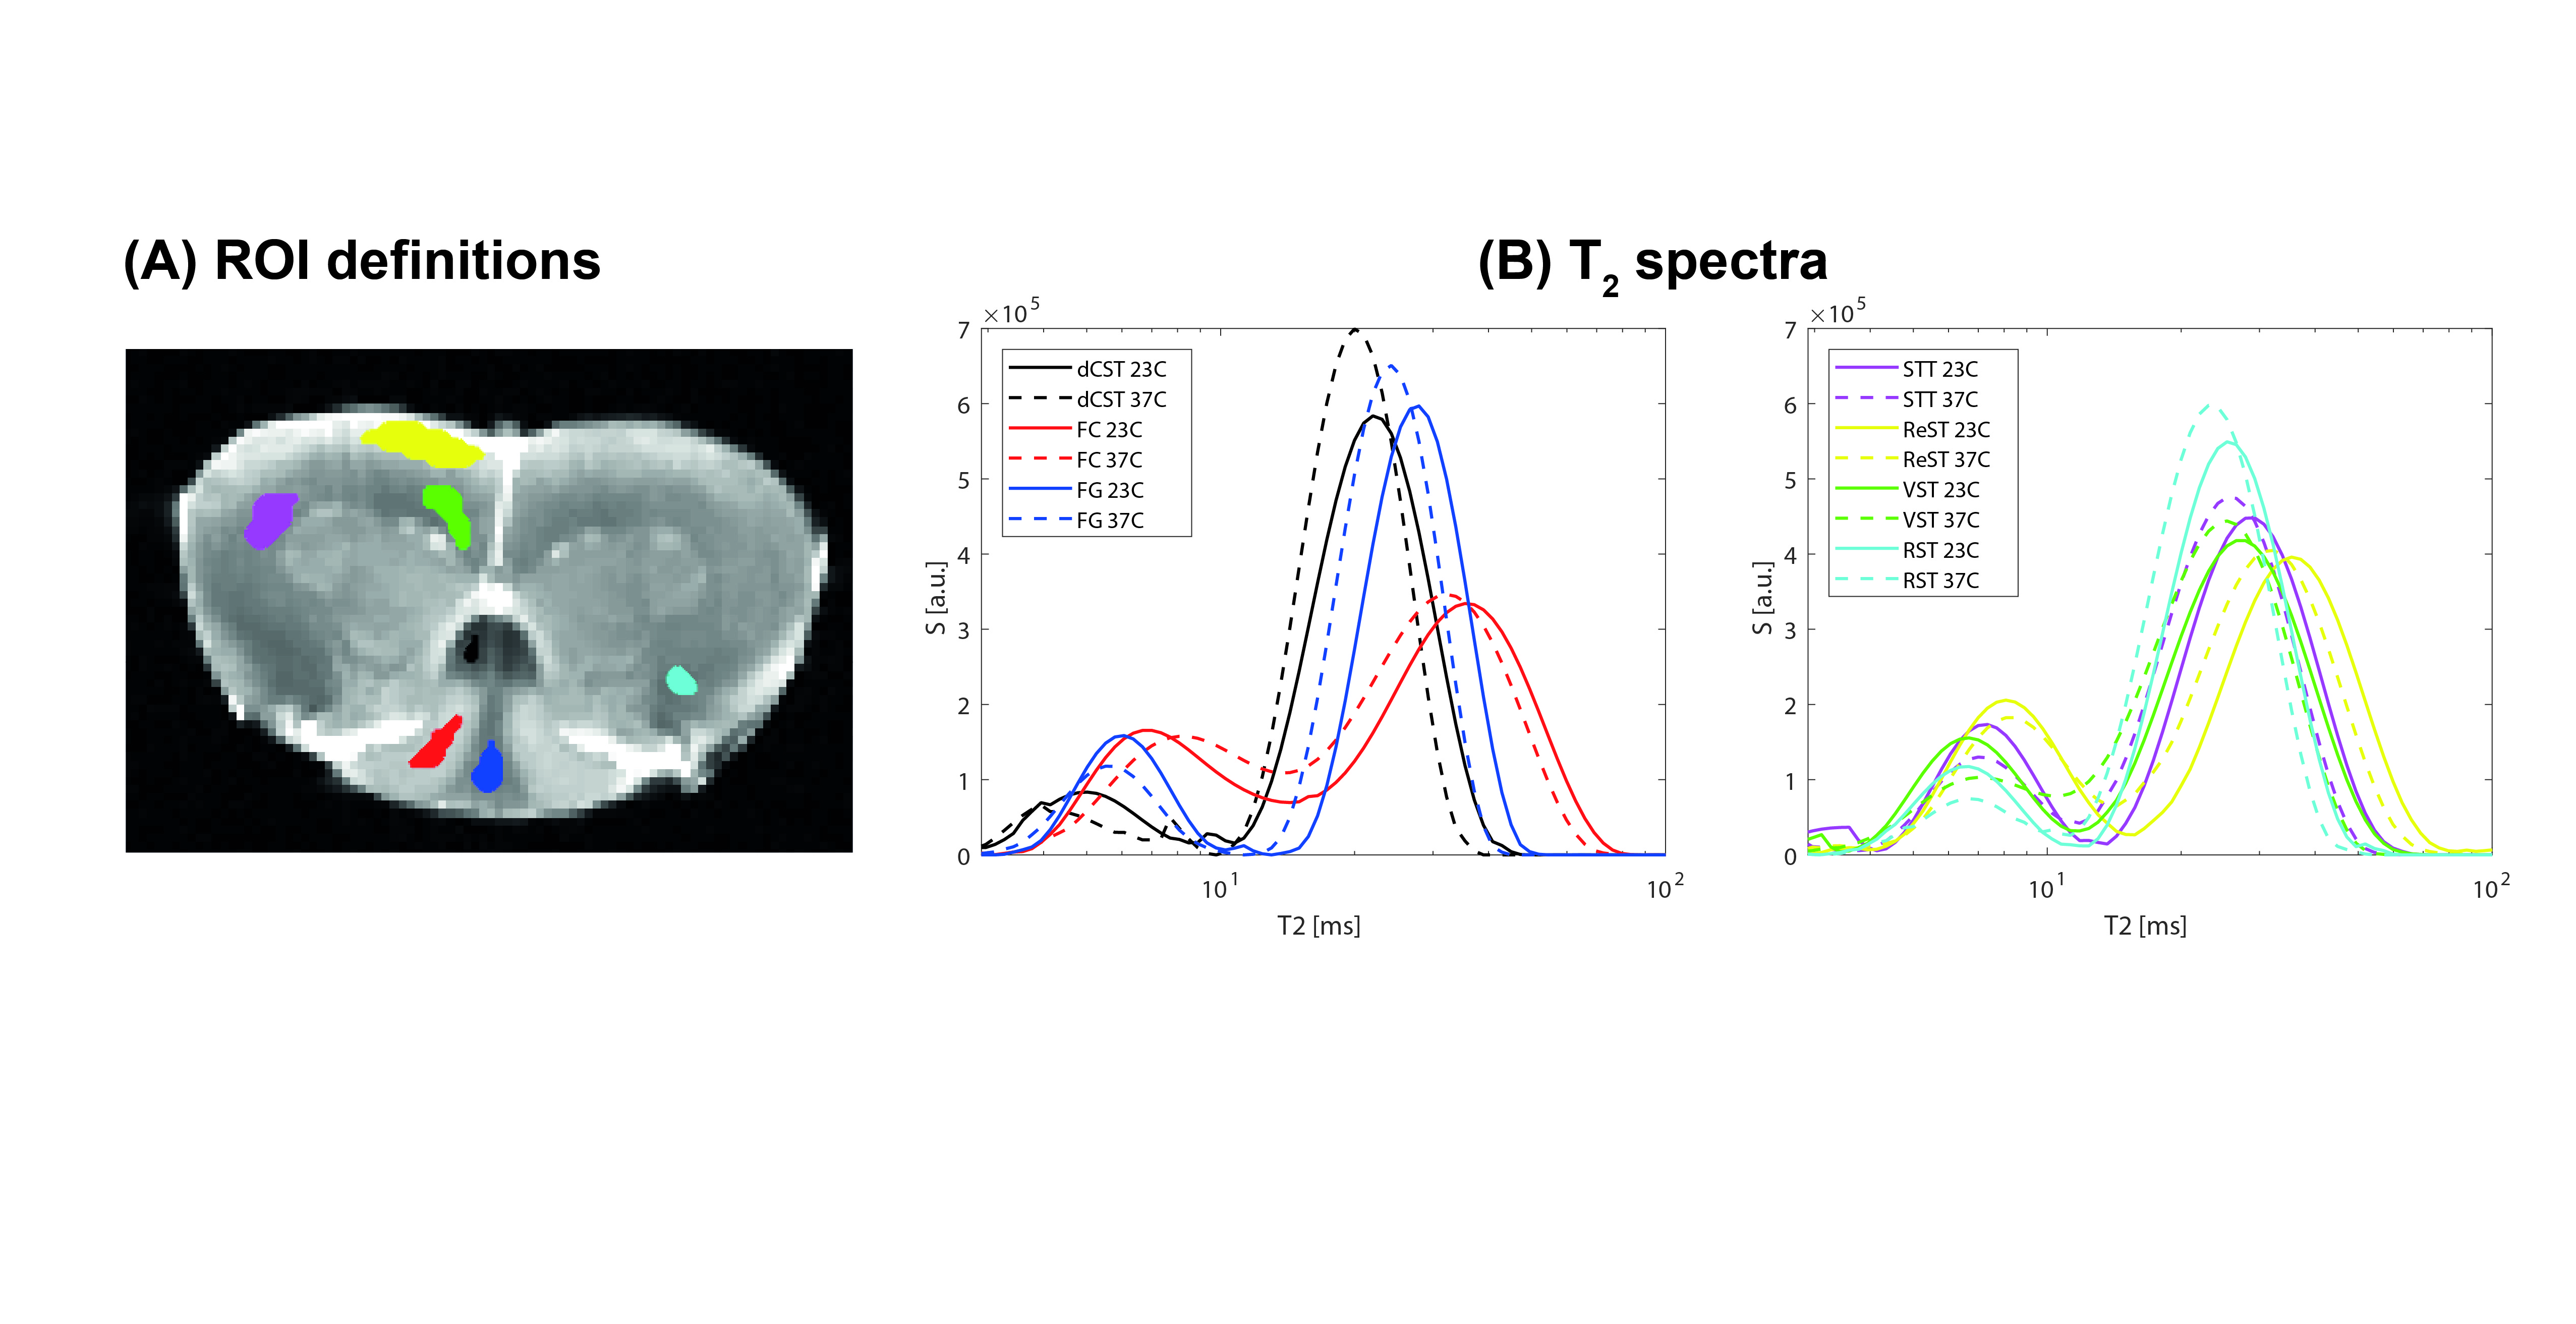
Figure 3. (A) ROI definitions (idem as in Fig 2) and (B) The
T2 fits from the data. Solid lines represent the fits to the 23C data whereas
dashed line represent the fits to 37C. Note how for many ROIs, the T2 spectra
are more closely spaced at 37C compared to their 23C counterparts, suggesting
significant exchange of the (at least) two components. This is counter to what
would be expected from non-exchanging signals, which would only shift to the
right with increasing temperature.
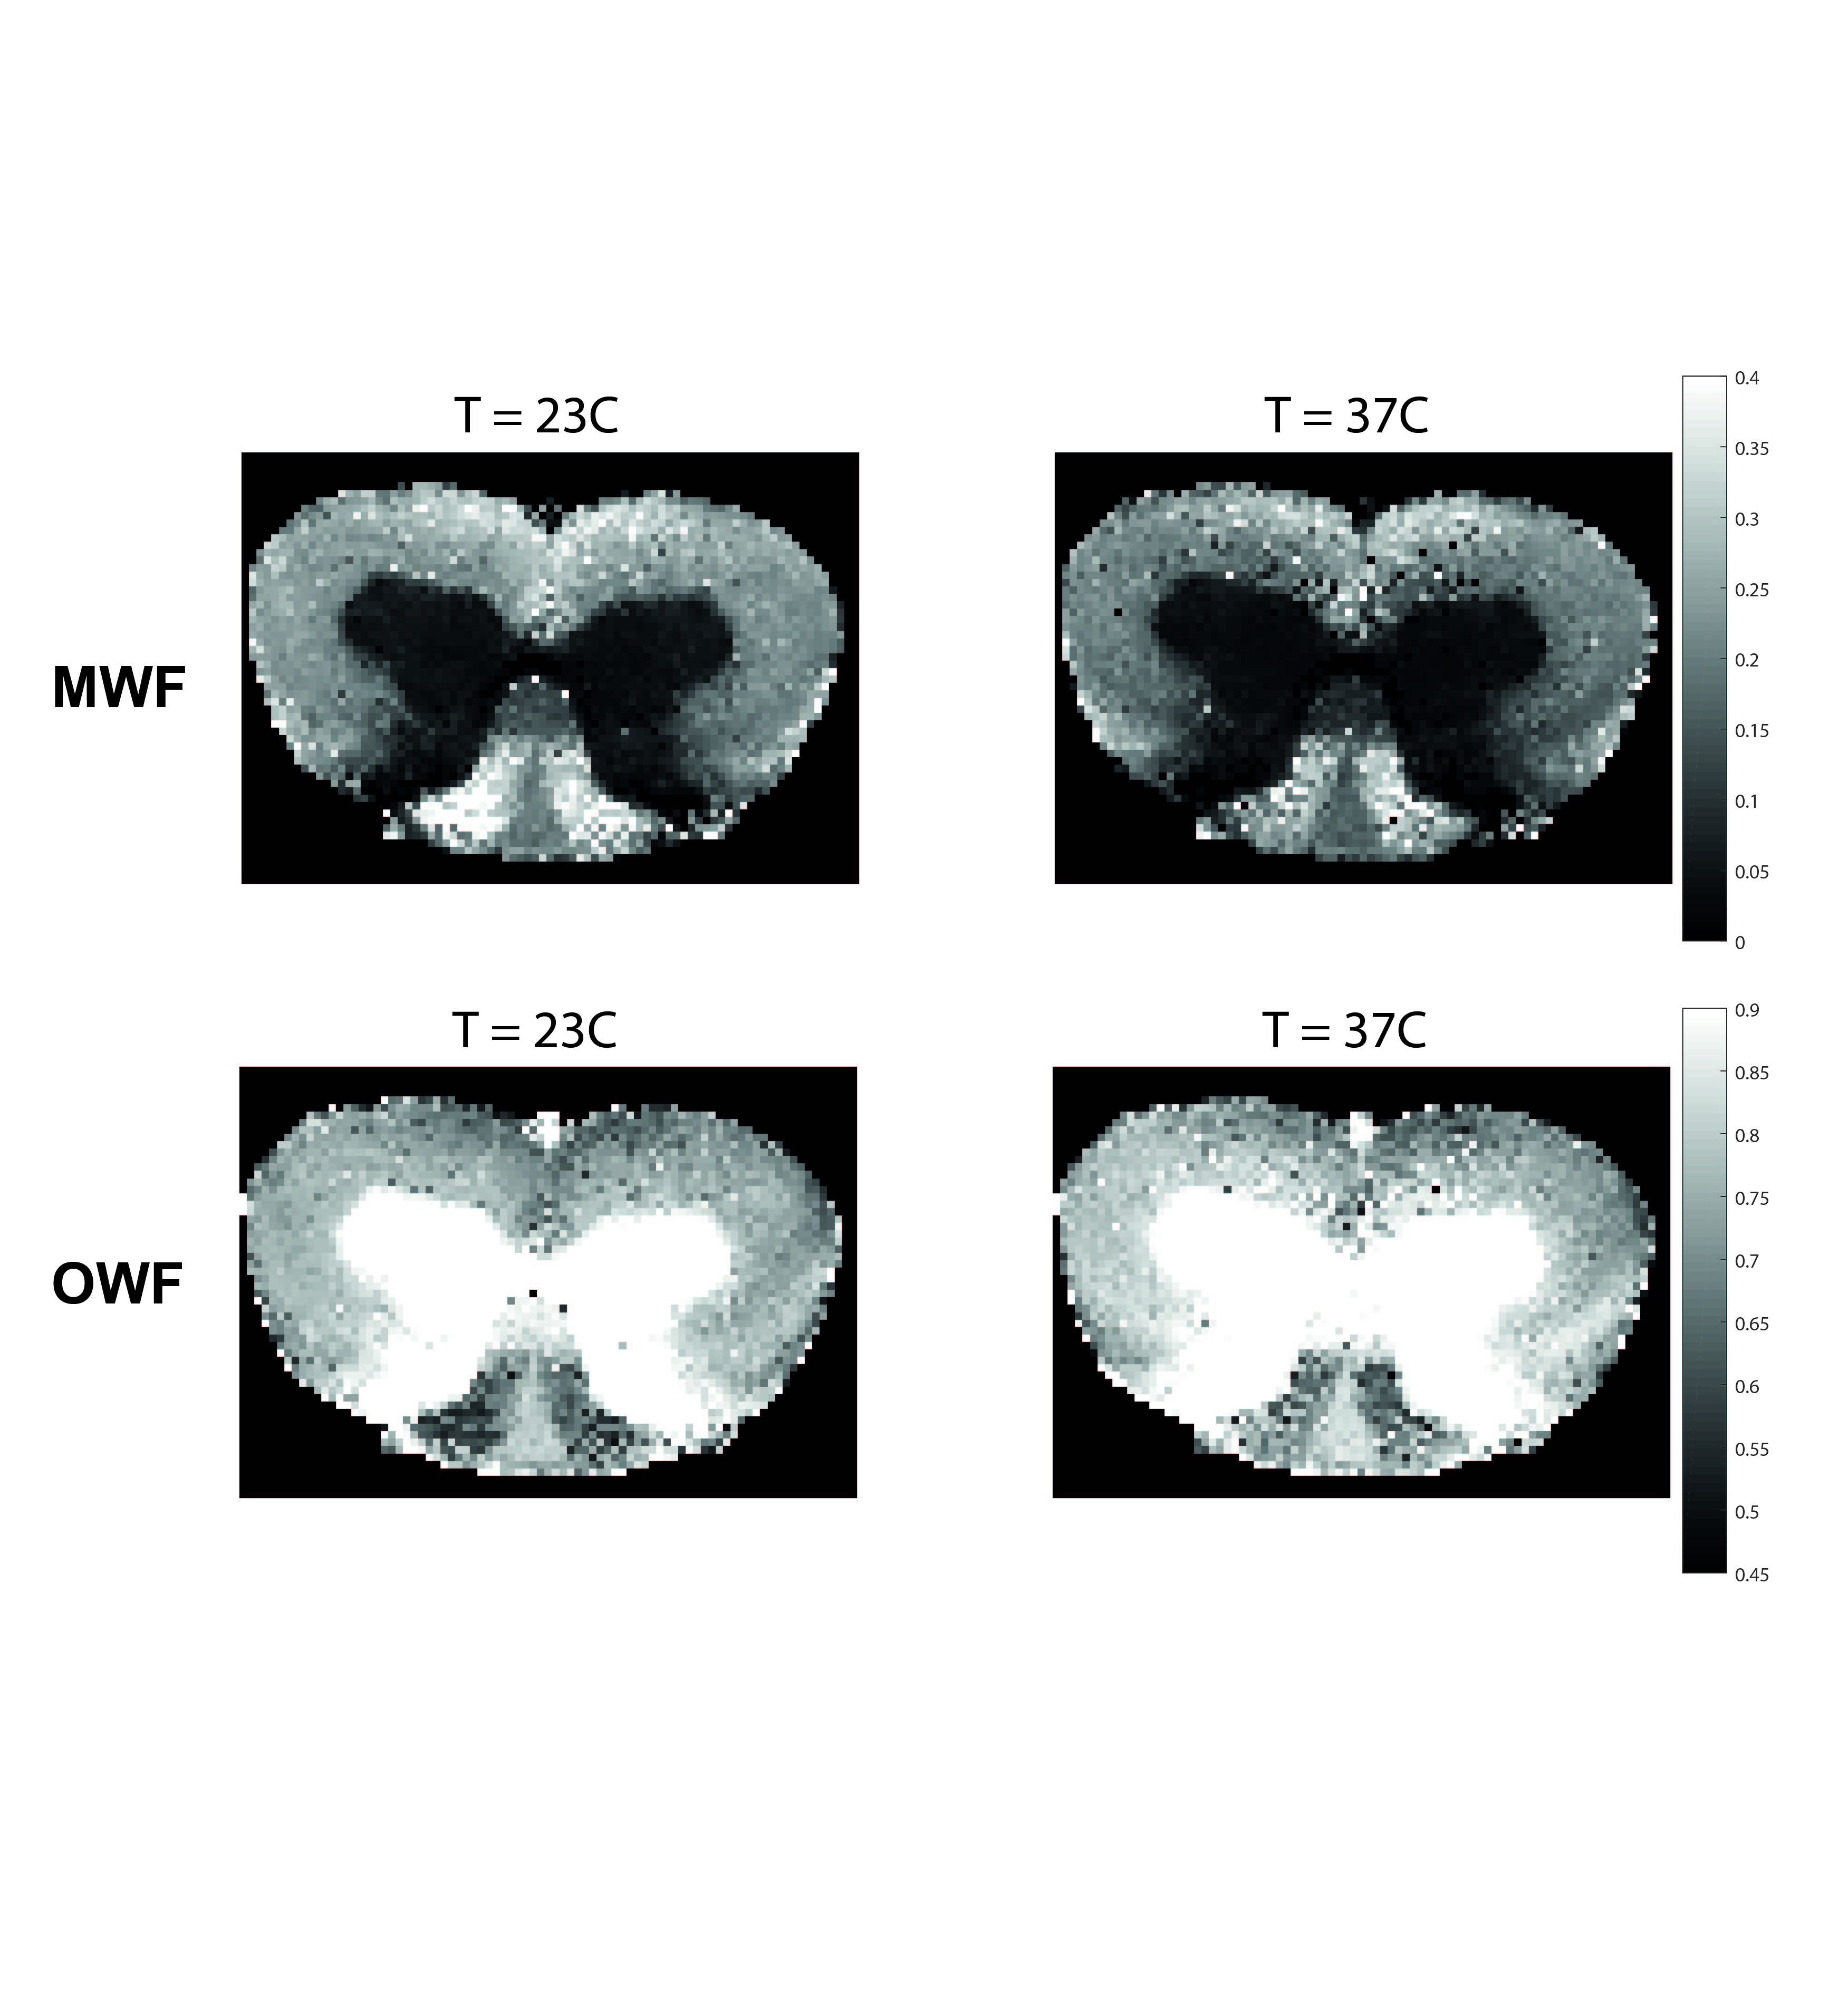
Figure 4. Myelin Water Fraction
(MWF) and Other Water Fraction (OWF) OWF maps at the two temperatures. Clear
differences are documented in the white matter.
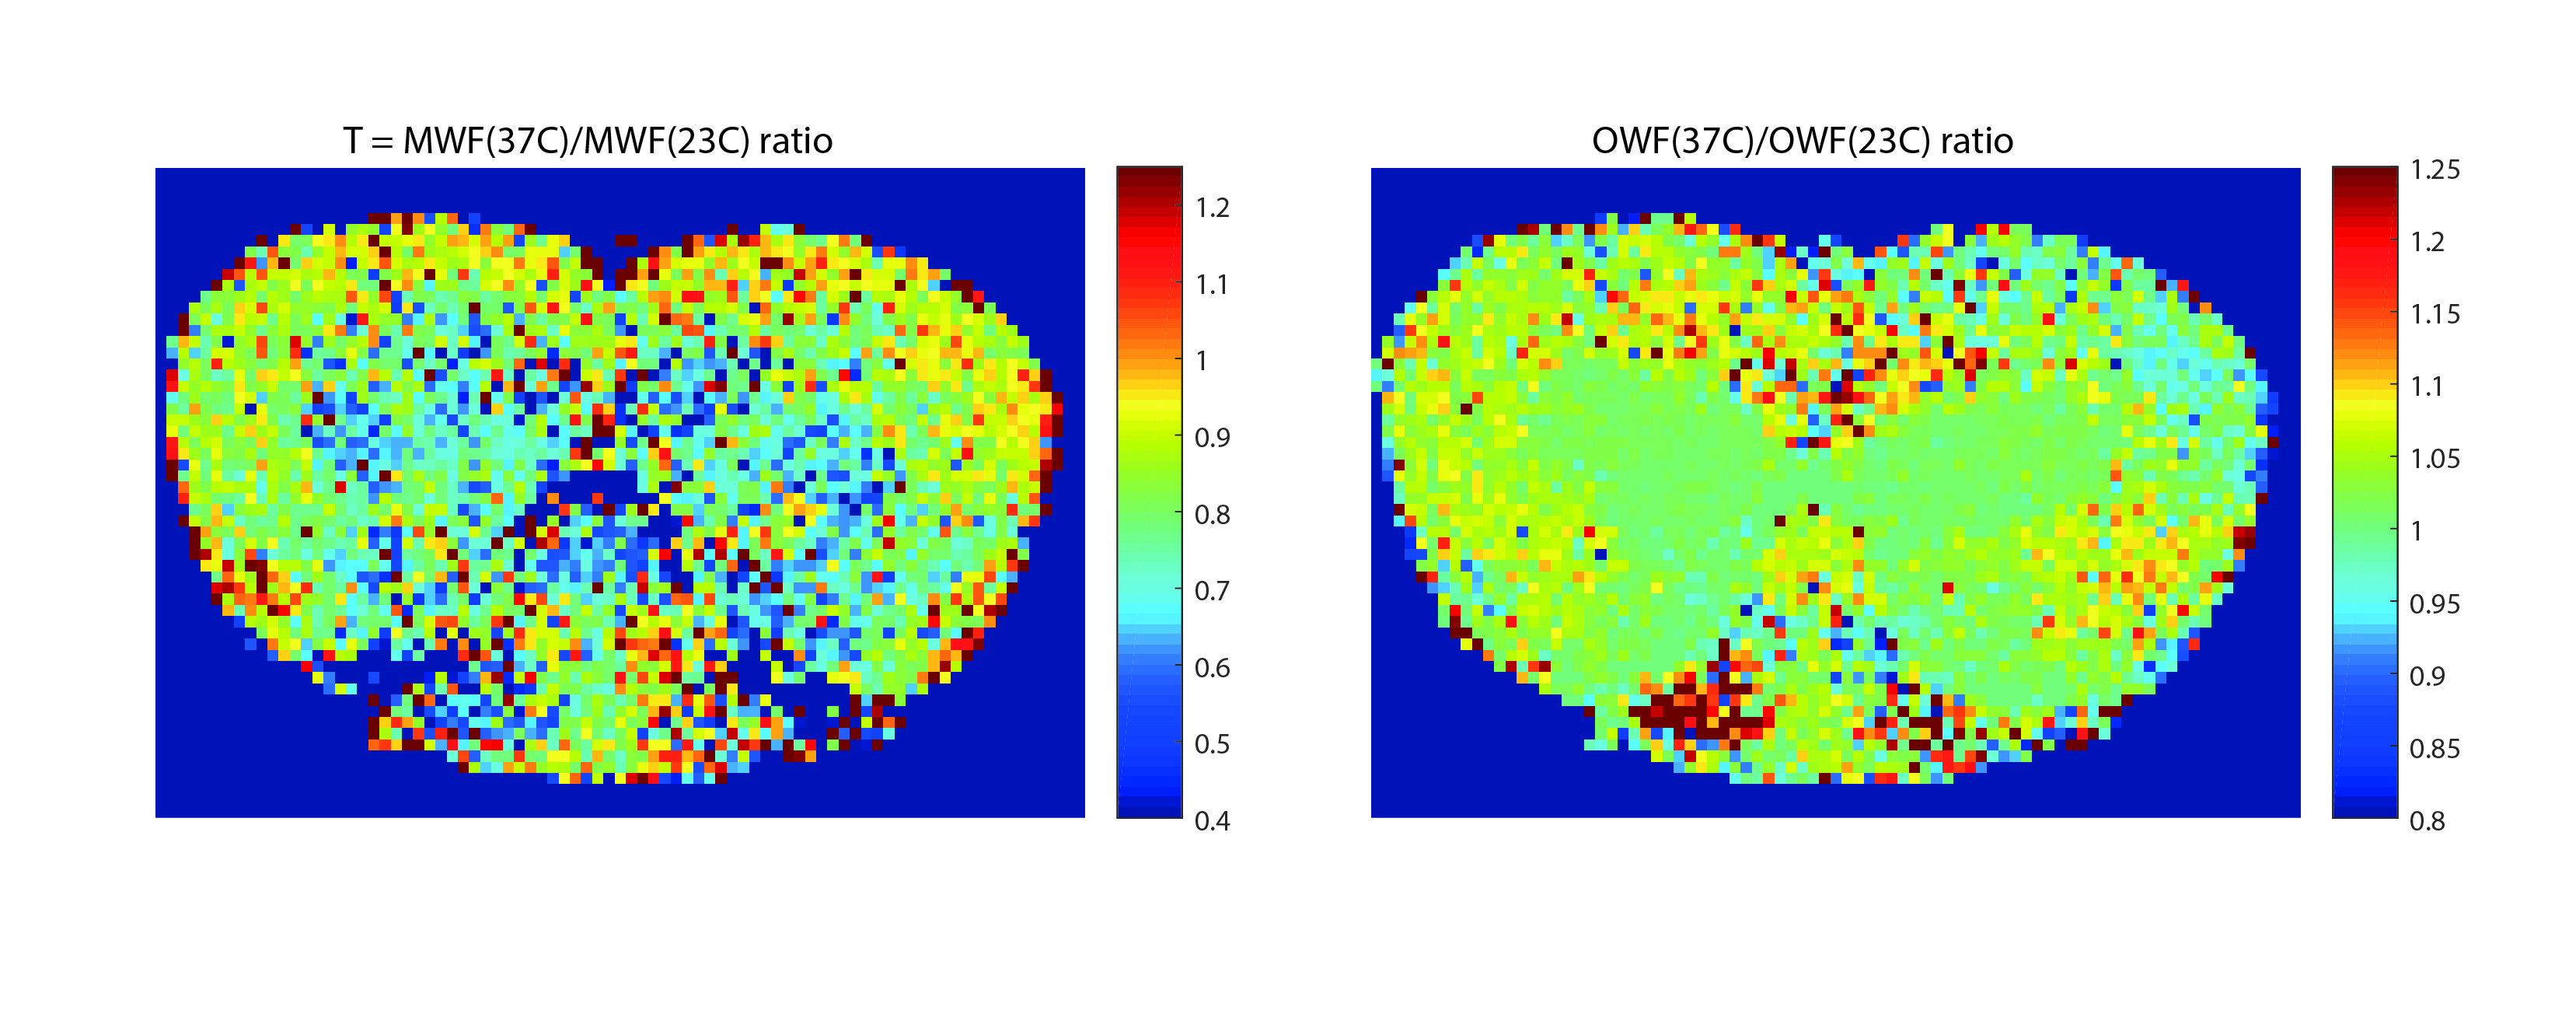
Figure 5. Ratio of fraction
maps between the two temperatures. Notice how dCST – the tract with the
smallest axons and thinnest myelin – shows the largest difference of ~40%
whereas VST, with some of the largest axons and thickest myelin shows only ~10%
change.