3108
Disentangling the Effects of Anisotropy and Orientation Dispersion Using Diffusion Spherical Mean Spectrum Imaging1University of North Carolina, Chapel Hill, NC, United States, 2Xiaozhuang University, Nanjing, China, 3Korea University, Seoul, Korea, Democratic People's Republic of
Synopsis
Diffusion fractional anisotropy (FA) measures voxel-level anisotropy, which mingles the effects of neurite microscopic-level anisotropy and orientation dispersion. We introduce a technique, called spherical mean spectrum imaging (SMSI), that can disentangle these two effects. We applied SMSI on baby brain diffusion MRI data collected during the first year of life and show that SMSI can extract microstructural information that is elusive to diffusion tensor imaging (DTI).
Purpose:
We introduce a method to probe tissue microarchitecture by characterizing water diffusion in a spectrum of length scales, factoring out the effects of intra-voxel fiber crossing and dispersion. We decompose the signal spherical means for different shells at each voxel into a spherical mean spectrum (SMS), which essentially encodes the fractions of spin packets undergoing fine- to coarse-scale diffusion processes, characterizing hindered and restricted diffusion stemming respectively from extra- and intra-neurite water compartments.
From the SMS, multiple rotation invariant indices can be computed, allowing for example the quantification of neurite density, microscopic fractional anisotropy ($$$uFA$$$), per-axon axial/radial diffusivity, free/restricted isotropic diffusivity, and orientation dispersion index (ODI). We show maps of these indices for baby brains, demonstrating that microscopic tissue features can be extracted from the developing brain for greater sensitivity and specificity to development related changes.
Methods:
The spherical mean technique (SMT)[1][2] is based on the observation that for a fixed b-value the spherical mean of the diffusion-attenuated signal over the gradient directions, i.e.,$$\bar{S}_b = \frac{1}{4\pi} \int_{\mathbb{S}^2}S_b(g)dg= S_{0}\bar{h}_b$$ does not depend on the fiber orientation distribution. Setting the kernel as an axial symmetric diffusion tensor[3], we can obtain$$ \bar{h}_b(\lambda_{\parallel}, \lambda_{\perp}) = \exp\left(-b \lambda_{\bot}\right) \frac{\sqrt{\pi}erf\left(\sqrt{b(\lambda_{||}-\lambda_{\bot})}\right)}{2 \sqrt{b (\lambda_{||}-\lambda_{\bot})}}$$
SMSI generalizes SMT by assuming that the signal measurements at each voxel to be a collective outcome of an ensemble of homogeneous spin packets originating from different positions within the voxel, each undergoing local anisotropic or isotropic diffusion represented by an axial-symmetric diffusion tensor model and contributes to the signal for gradient direction $$$g$$$ by $$$\bar{h}_b(\lambda_{\parallel},\lambda_{\perp}$$$)[4] . Encoding the fractions of the spin packets using probability distribution $$$p(\lambda_{\parallel}, \lambda_{\perp})$$$, which we call the SMS, the spherical mean of the signal can be written as: $$\bar{S}_{b} = S_{0}\int_{\lambda_{\parallel}, \lambda_{\perp}}p(\lambda_{\parallel},\lambda_{\perp})\bar{h}_{b}(\lambda_{\parallel},\lambda_{\perp}) d\lambda_{\parallel} d\lambda_{\perp}$$
The mean signal can thus be seen as the weighted combination of the mean signals of the spin packets[5]. Setting $$$p(\lambda_{\parallel}, \lambda_{\perp})$$$ in (3) according to a delta function will result in (1). Unlike SMT, SMSI does not assume the shape of $$$p(\lambda_{\parallel}, \lambda_{\perp})$$$ and aims to solve for it directly. Similar to RSI[6] this allows us to characterize the tissue microarchitecture using a spectrum of diffusion scales. To make the problem feasible, we discretize (3) by defining $$\begin{split}\bar{S}_{b}=& S_{0}\sum_{i} p[i] \bar{h}_{b}(\lambda_{\parallel}[i], \lambda_{\perp}[i])\end{split}$$
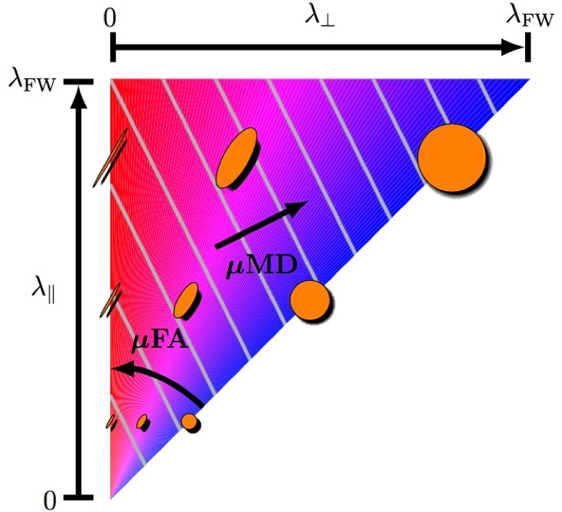
The ranges of $$$\lambda_{\parallel}$$$ and $$$\lambda_{\perp}$$$ are set according to constraint $$$0< \lambda_{\perp} < \lambda_{\parallel}< \lambda_{\text{freewater}}$$$ (see Fig. 1). We solve for $$$p[i]$$$ using a least-squares formulation with lasso ($$$l_{1}$$$-norm) penalty and ridge ($$$l_{2}$$$-norm) penalty[7][8].
From the SMS, we can calculate various indices such as microscopic FA ($$$uFA$$$) and MD ($$$uMD$$$) based on the expected values of the radial and axial diffusivity according to the SMS. The ODI is obtained by quantifying the deviation of the signal at each voxel from a hypothetical signal constructed from the SMS for full isotropic dispersion.
Results:
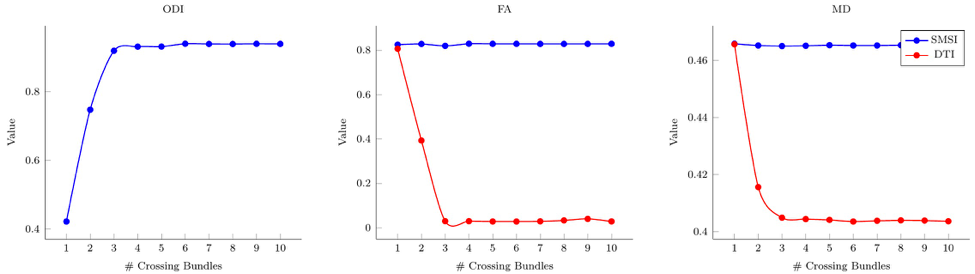
Fig. 2 shows DTI voxel-level FA and MD values in comparison with SMSI microsopic-level $$$uFA$$$ and $$$uMD$$$. $$$uFA$$$, which factors out dispersion, exhibits rather high values irrespective of the number of crossing fiber bundles (directions uniformly distributed on a sphere). This correctly indicates strong directional preference of local water diffusion despite low FA. In contrast, FA is affected by the dispersion and its value diminishes very rapidly as the number of bundles increases. Comparison between MD and $$$uMD$$$ also indicates that $$$uMD$$$, unlike MD, is not sensitive to dispersion. ODI increases with the number of bundles and therefore serves as an indicator of dispersion.
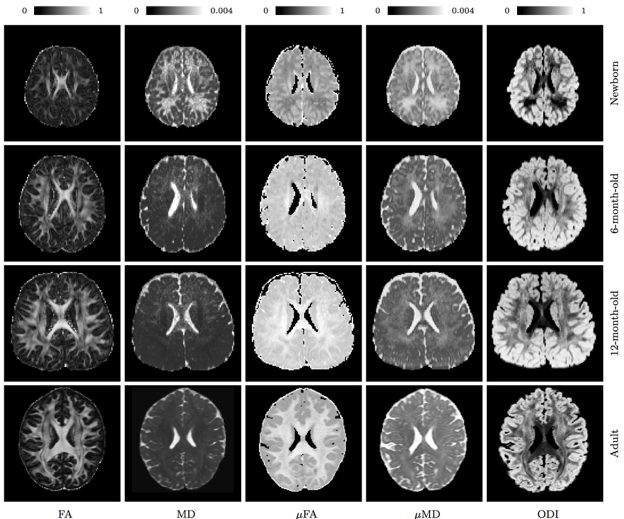
Fig. 3 shows the DTI FA and MD and SMSI $$$uFA$$$ and $$$uMD$$$ maps for a newborn, a 6-month-old, a 12-month-old, and an adult. Unlike FA, $$$uFA$$$ retains high values even in regions with fiber crossings. The contrast of $$$uFA$$$ changes with time, unlike FA, which remains very similar, indicating that $$$uFA$$$ is potentially more sensitive to developmental changes.
Conclusion:
The SMS encodes the volume fractions associated with a spectrum of spherical-mean response functions. SMSI disentangles the effects of anisotropy and dispersion and allows a wide variety of features to be computed for comprehensive microstructural analysis.Acknowledgements
This work was supported in part by NIH grants (NS093842, EB022880, and MH100217).References
[1] Kaden, E., Kruggel, F., Alexander, D.C., 2016b. Quantitative mapping of the per-axon diffusion coefficients in brain white matter. Magnetic Resonance in Medicine 75, 1752–1763.
[2] Kaden, E., Kelm, N.D., Carson, R.P., Does, M.D., Alexander, D.C., 2016a. Multi-compartment microscopic diffusion imaging. NeuroImage 139, 346– 359.
[3] Anderson, A.W., 2005. Measurement of fiber orientation distributions using high angular resolution diffusion imaging. Magnetic Resonance in Medicine 54, 1194–1206.
[4] Yablonskiy, D., Bretthorst, G., Ackerman, J., 2003. Statistical model for diffusion attenuated MR signal. Magnetic Resonance in Medicine 50, 664– 669.
[5] Scherrer, B., Schwartzman, A., Taquet, M., Sahin, M., Prabhu, S.P., Warfield, S.K., 2016. Characterizing brain tissue by assessment of the distribution of anisotropic microstructural environments in diffusion- compartment imaging (DIAMOND). Magnetic Resonance in Medicine 76, 963–977.
[6] White, N.S., Leergaard, T.B., D’arceuil, H., Bjaalie, J.G., Dale, A.M., 2013. Probing tissue microstructure with restriction spectrum imaging: Histological and theoretical validation. Human Brain Mapping 34, 327–346.
[7] Zou, H., Hastie, T., 2005. Regularization and variable selection via the elastic net. Journal of the Royal Statistical Society: Series B (Statistical Methodology) 67, 301–320.
[8] Figueiredo, M.A., Nowak, R.D., Wright, S.J., 2007. Gradient projection for sparse reconstruction: Application to compressed sensing and other inverse problems. IEEE Journal of Selected Topics in Signal Processing 1, 586–597.
Figures