3106
Does the g-ratio influence resting-state functional connectivity? A group-level analysis1Translational Imaging Group, University College London, London, United Kingdom, 2Brighton and Sussex Medical School, Department of Neuroscience, University of Sussex, Brighton, United Kingdom, 3Neuroimaging Laboratory, Santa Lucia Foundation, Rome, Italy
Synopsis
Recent findings have shown specific relationships between the cortical myeloarchitecture of the brain and resting-state functional connectivity patterns, while little is known about the white matter myelin distribution. The aim of this work is to preliminary characterize how the g-ratio (i.e., the ratio of the inner and the outer diameters of myelinated axons) and functional connectivity are interrelated. We characterized at group level connectivity patterns using structural connectivity, functional connectivity and g-ratio. We then assessed potential differences between specific functional modules. We observed different distributions when comparing structure and function in terms of g-ratio, and reported significant differences.
Introduction
Recent work have shown specific relationships between resting-state brain activity and cortical myelin1,2. However, the relationship between the myelin distribution within the white matter architecture underlying the cortex and resting-state connectivity is less clear. Using an in-vivo estimation of the g-ratio3 (i.e., the ratio of the inner and the outer diameters of myelinated axons), the aim of this work is to characterize the relationship between g-ratio weighted structural networks and functional connectivity patterns.Methods
Sixteen healthy subjects (M/F: 6/10; mean age(SD): 25(6.2)) were scanned with a 1.5 T Siemens Avanto MRI scanner, using a multi-shell diffusion-weighted imaging (DWI) protocol for neurite orientation dispersion and density imaging4 (NODDI) (TE=99 ms, TR=8400 ms, matrix=96x96, FoV=240x240 mm2, slice thickness = 2.5mm, 10 b0 volumes; 9 directions with b=300 smm-2; 30 directions with b=800 smm-2; 60 diffusion directions with b=2400 smm-2), quantitative magnetization transfer (qMT) imaging based on balanced steady-state free precession (bSSFP), and resting-state fMRI (T2*-weighted multi-echo EPI sequence: TR = 2570 ms; TE =15, 34, 54 ms; 31 axial slices; 200 volumes). T1-weighted were acquired for anatomical reference (MPRAGE). T1 volumes were pre-processed using FreeSurfer and parcellated with the Desikan-Killiany atlas into 68 cortical areas. Diffusion data were co-registered to the respective average of b0 volumes in order to minimize artifacts. Streamlines were deterministically reconstructed using tensor fitting by means of Diffusion Toolkit and then co-registered to the anatomical space using an inverse linear transformation. Using the MT and NODDI data, the g-ratio was estimated as already described3, and co-registered to the anatomical space using an inverse non-linear warping. fMRI data were pre-processed with the AFNI tool meica.py. Multi-echo principal components analysis and spatial ICA were applied to the data as detailed in previous work5 to minimise the effect of motion on functional connectivity. The pre-processed volumes were then co-registered to the anatomical space and for each cortical region the average timecourse was calculated and the second wavelet coefficients were computed (corresponding to the frequency band 0.048-0.097 Hz, the accepted physiological range6). For each pair of regions the correlation was computed, and the final functional connectivity (FC) matrices were obtained with a false-rate discovery thresholding6. The structural connectome was reconstructed for each subject counting the number of streamlines (NOS) between every possible pair of regions, and arranging such values into an adjacency matrix. For these streamlines, the average g-ratio was computed. Appropriate thresholds were used to avoid spurious connections. A group connectivity matrix was computed for each modality (NOS, FC, g-ratio), computing the non-zero average of the connections observed in at least the half of the sample size7. Structural and functional connctivity patterns were compared as a function of the g-ratio. Then, using Louvain algorithm and consensus clustering as implement in Brain Connectivity Toolbox, a group-level modular structure was estimated, and the g-ratio distribution of each module was compared with each other. As a further comparison, the g-ratio distributions across the intermodular and the intramodular connections were assessed.Results
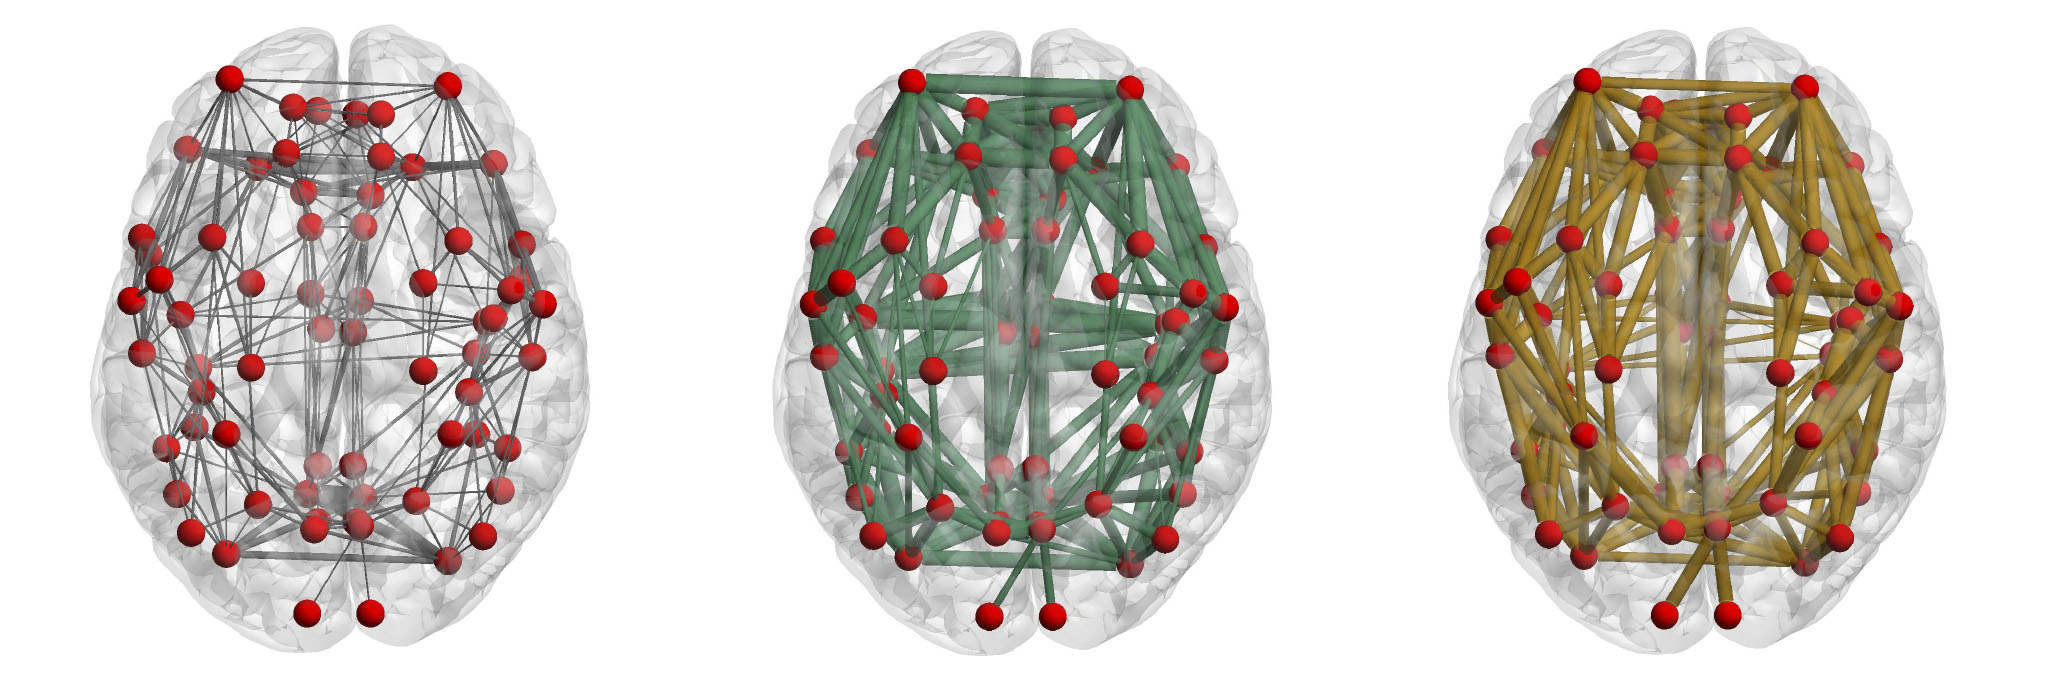
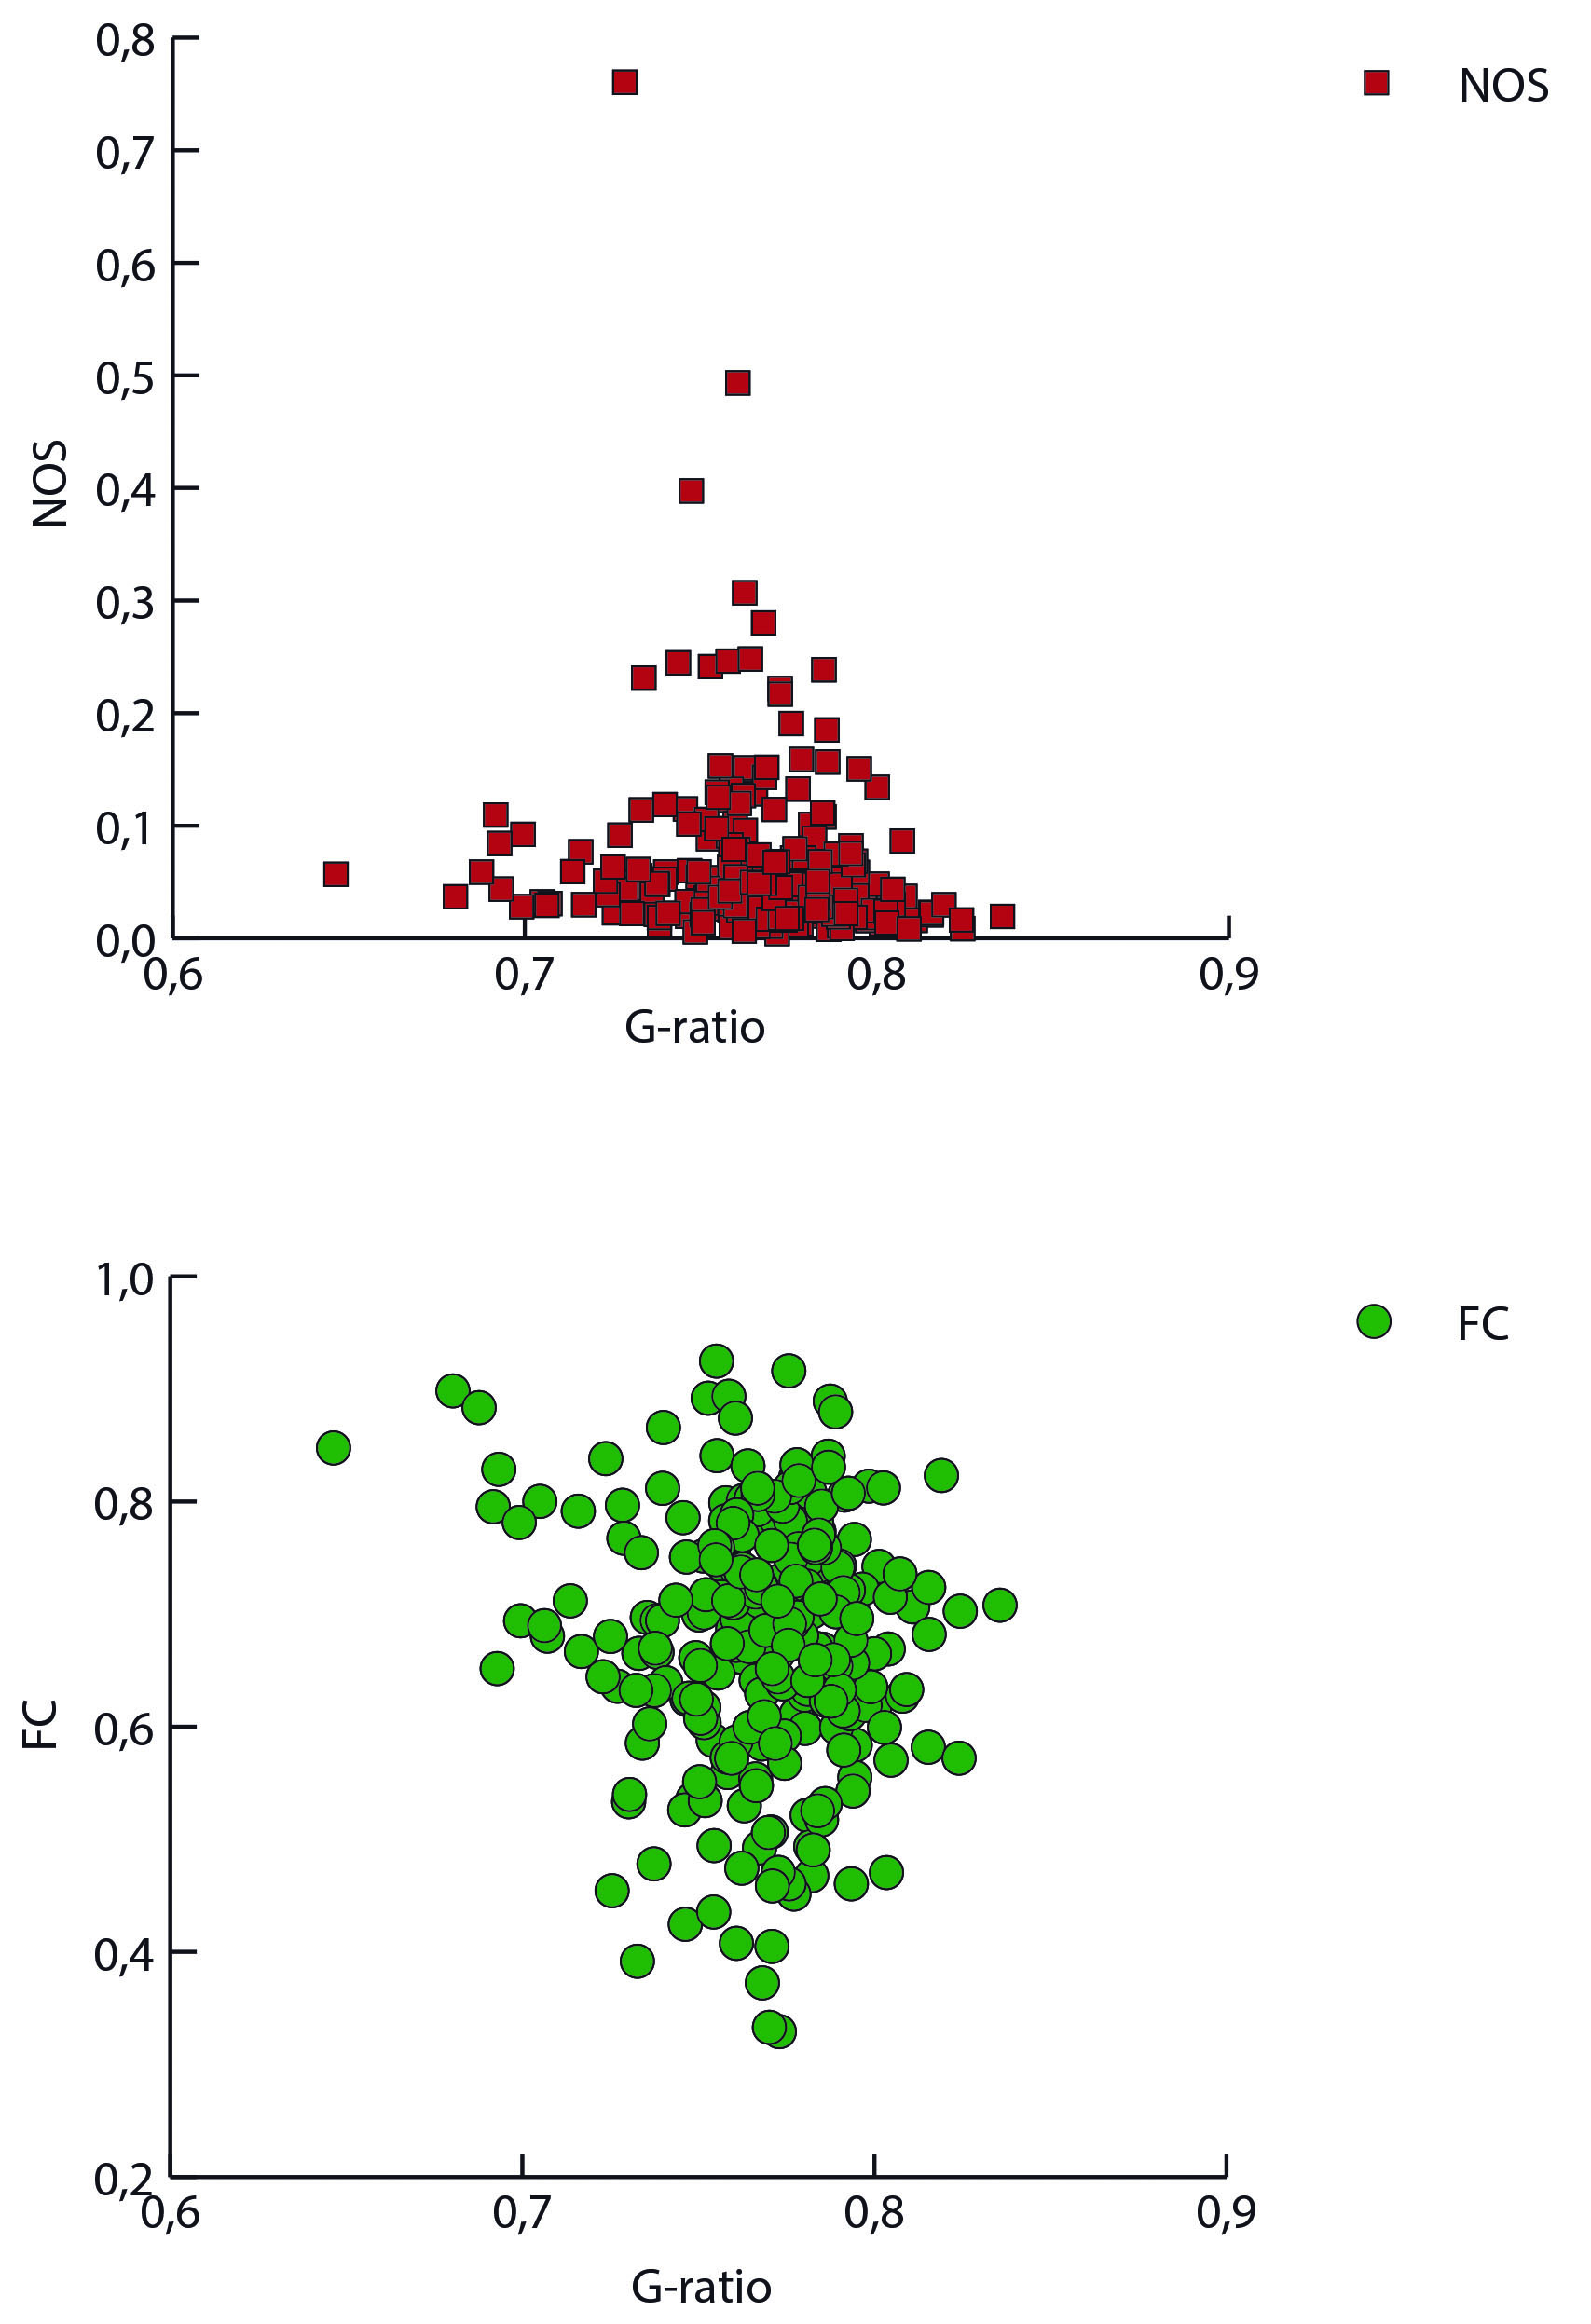
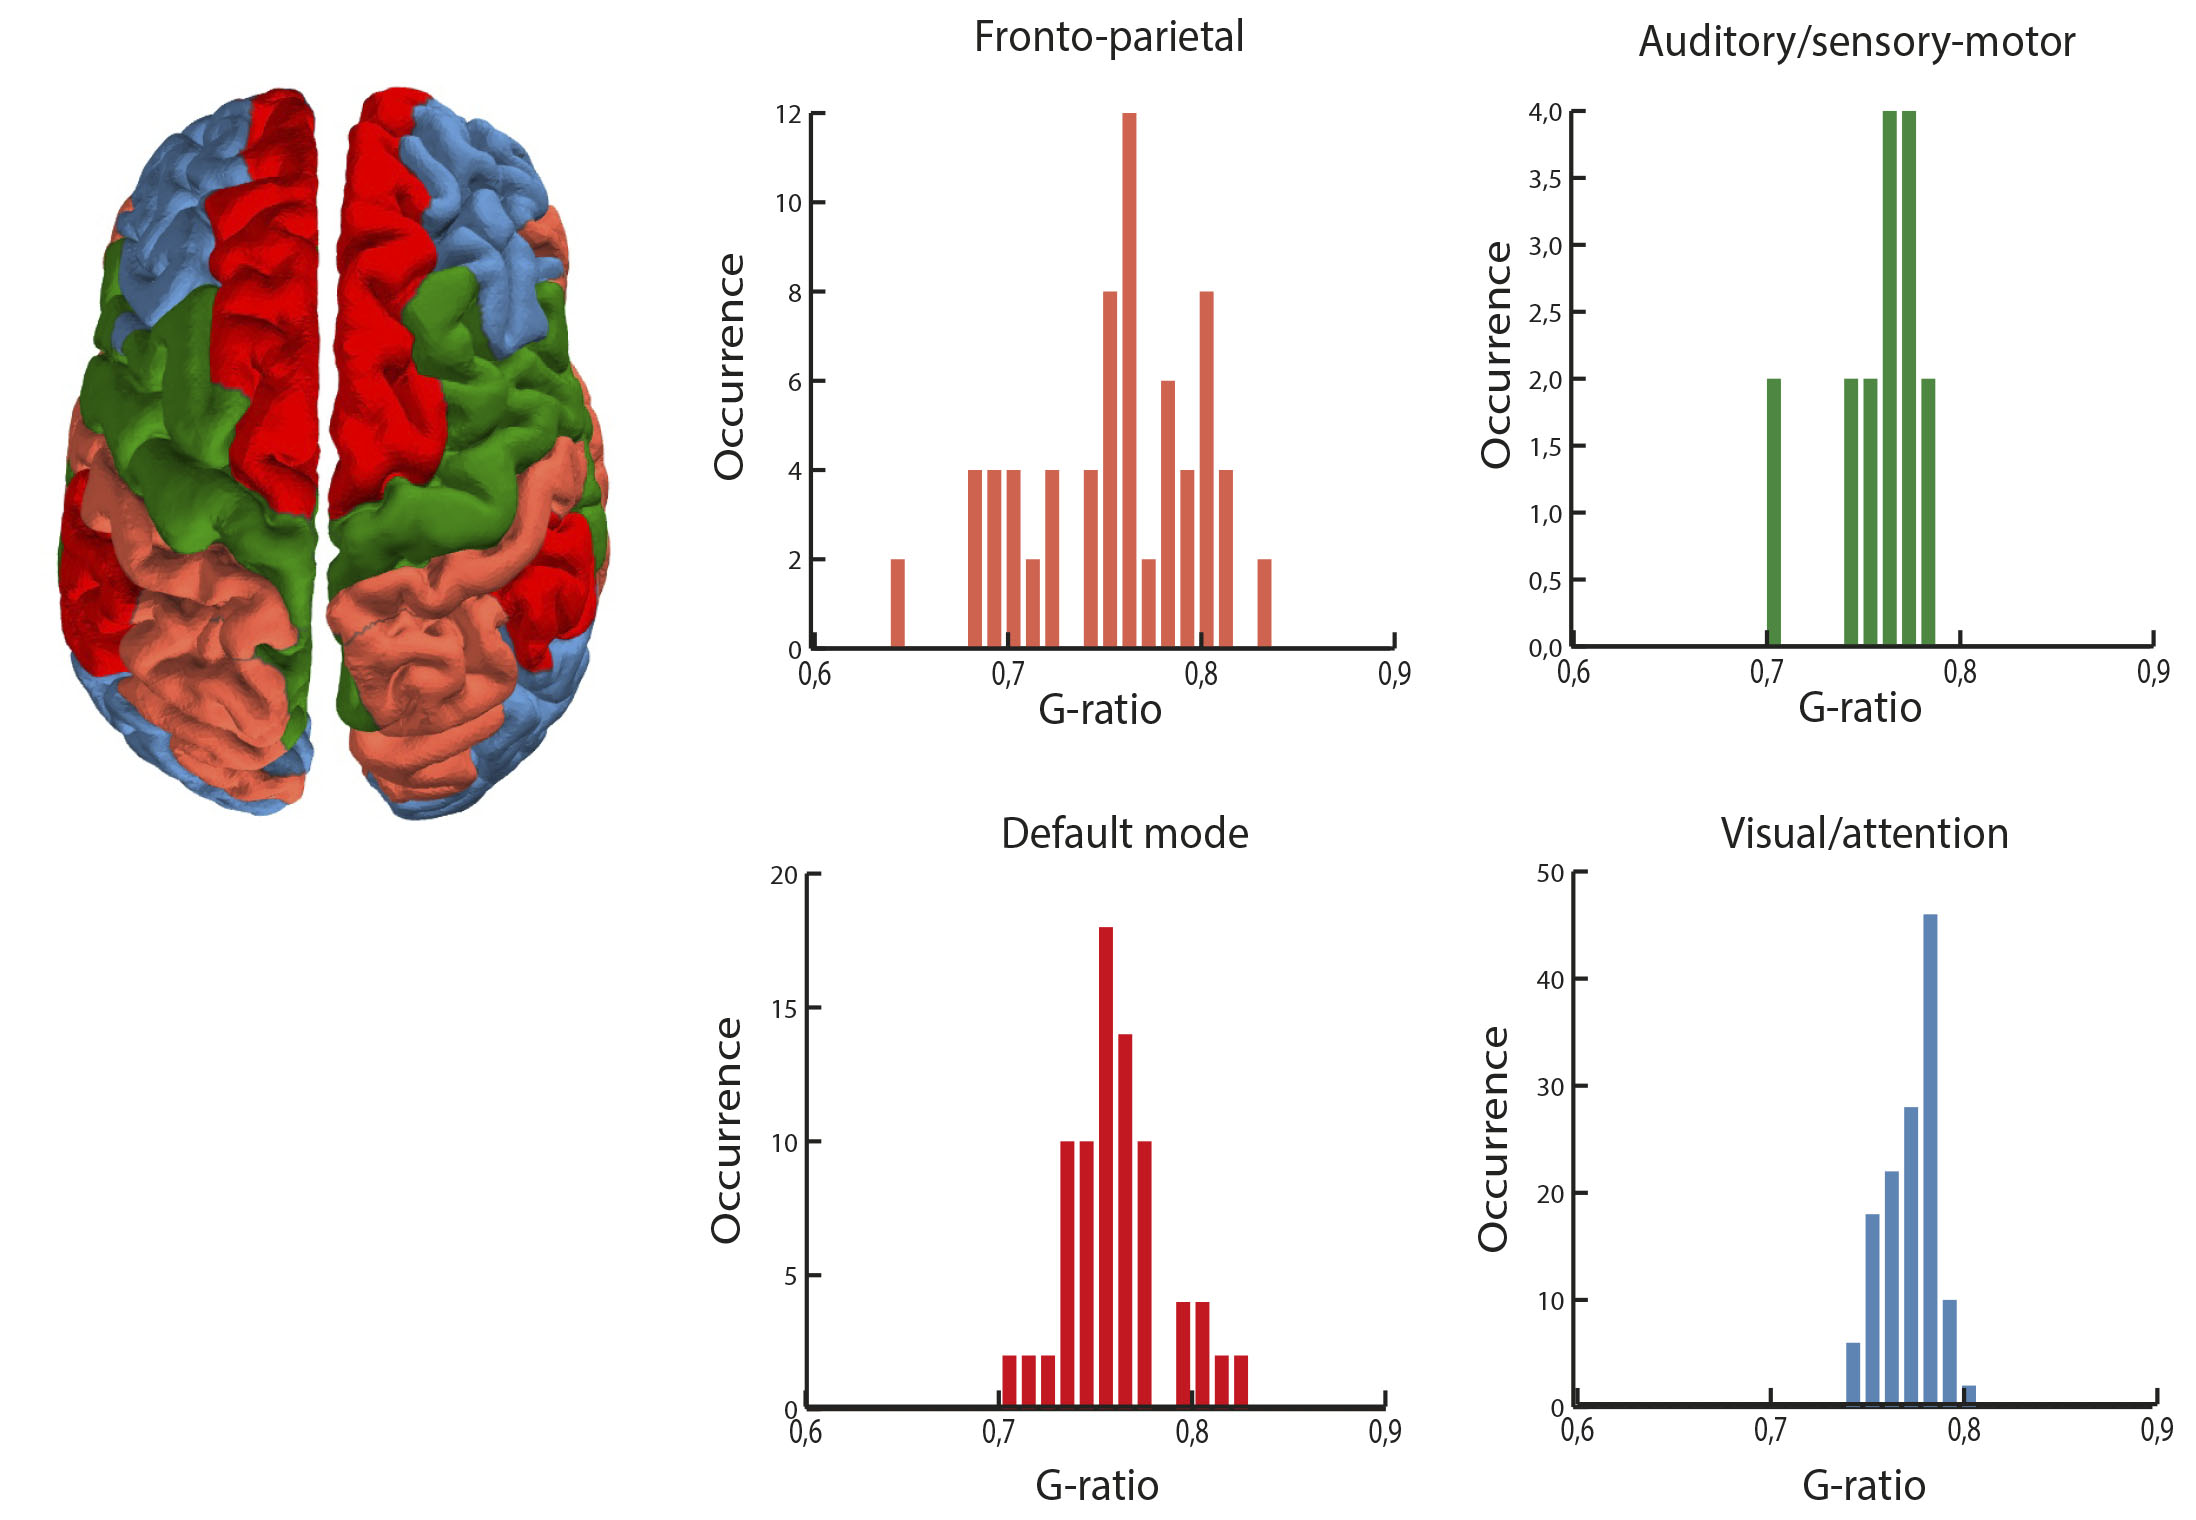
Figure 1 shows a representation of the connectivity patterns using the NOS, the FC and the g-ratio as weights. The functional connectivity showed a more heterogeneus relationship compared to the structural one (fig. 2). As a result of the consensus clustering, four modules were identified (fig. 3), that corresponded8 mainly to: the fronto-parietal system (FP), the auditory and sensory-motor system (A), the default mode system (DM), and the visual and attention systems (VA). Significant differences were observed between VA connections and both DM and FP ones (medians(median absolute deviations): FP 0.763(0.03); AS 0.771(0.01); DM 0.758(0.01); VA 0.781(0.01)); FP-A: p=0.54; FP-DM: p=0.56; FP-VA: p=0.00004; AS-DM: p=0.36; AS-VA: p=0.48; DM-VA: p=0.000000006). The comparison of intramodular and intermodular connections did not show significant differences (intermodular median(absolute deviation): 0771(0.013); intramodular: 0.767(0.017); p=0.67).Discussion
The functional and structural organization levels of the brain show different patterns in terms of the g-ratio, with no evidence of a clear relationship. However, they are both distributed more densely around the same specific value (~0.76 in this dataset). Interestingly, previous work have reported significant relationships between the cortical myelin and specific cognitive and sensory systems2. In this case, although we were able to observe significant differences between some cognitive systems, it is important to notice that these patterns are tailored to resting-state. Task-based FC can lead to more function-specific observations9.Conclusions
To the best of our knowledge, this is the first attempt to characterize the relationship between resting-state functional connectivity and white matter myelin distribution estimated with the g-ratio. Although preliminary, these results indicate that myeloarchitecture and FC patterns are interrelated at the white matter level.Acknowledgements
This work was funded by a grant from the Italian Ministry of Health (RF-2013-02358409) awarded to Mara Cercignani.References
1. Huntenburg J, Bazin P, Goulas A, et al. A Systematic Relationship Between Functional Connectivity and Intracortical Myelin in the Human Cerebral Cortex. Cerebral Cortex. 2017;27(2):981-997.
2. Ma Z, Zhang N. Cross-population myelination covariance of human cerebral cortex. Human Brain Mapping. 2017;38(9):4730-4743.
3. Stikov N, Campbell J, Stroh T, et al. In vivo histology of the myelin g-ratio with magnetic resonance imaging. NeuroImage. 2015;118:397-405.
4. Zhang H, Schneider T, Wheeler-Kingshott C, et al. NODDI: Practical in vivo neurite orientation dispersion and density imaging of the human brain. NeuroImage. 2012;61(4):1000-1016.
5. Dipasquale O, Sethi A, Laganà M, et al. Comparing resting state fMRI de-noising approaches using multi- and single-echo acquisitions. PLOS ONE. 2017;12(3):e0173289.
6. Bassett D, Wymbs N, Porter M, et al. Dynamic reconfiguration of human brain networks during learning. Proceedings of the National Academy of Sciences. 2011;108(18):7641-7646.
7. de Reus M, van den Heuvel M. Estimating false positives and negatives in brain networks. NeuroImage. 2013;70:402-409.
8. Power J, Cohen A, Nelson S, et al. Functional Network Organization of the Human Brain. Neuron. 2011;72(4):665-678.
9. Abdollahi R, Kolster H, Glasser M, et al. Correspondences between retinotopic areas and myelin maps in human visual cortex. NeuroImage. 2014;99:509-524.
Figures