3105
A two-perfusion compartment model for human placenta.1SAIMLAL department, Sapienza University, Rome, Italy, 2ISC, CNR, Rome, Italy, 3Department of Radiological, Oncological and Pathological Sciences, Rome, Italy
Synopsis
This work proposes the use of a two perfusion comparmtent model to fit diffusion MRI data of human placenta. The aim of the work is to characterize the parameters values and compare them with results obtained in animal models.
Introducrion
We present a biophysical model for diffusion MRI (dMRI) data of human placenta. Human placenta is the organ dedicated to the metabolic exchange between mother and fetus1. Its tissue micro-structure consists in a broad variety of differently structured villi and perfusion functions. Placental morphological and physiological characteristics, that can be determined via dMRI, are related to health of the fetus and the future adult2. IVIM has been used as a model to account for the standard diffusion of the water in the tissues and perfusion of blood in the vessels3-5. However, IVIM takes into account only one perfusion compartment. Recent studies, carried on mammalian placentas, suggested the presence of more than one perfusion compartment6,7. In this work we propose to test the performances of a diffusion model with two perfusion compartments.Methods
Model
modeling The following function has been fitted to the diffusion data:
$$S = S_0 [ f_f e^{-bD_f^*} + f_s e^{-bD_s^*} + (1-f_f-f_s) e^{-bADC} ]$$.
S0 is the non-weighted diffusion signal, D*f and D*s are the fast and slow pseudo-perfusion coefficients, ff and fs their fractions and ADC is the apparent diffusion coefficient. To not exceed with the degree of freedom of the model we fixed one of the perfusion-coefficient values (D*s).
Data
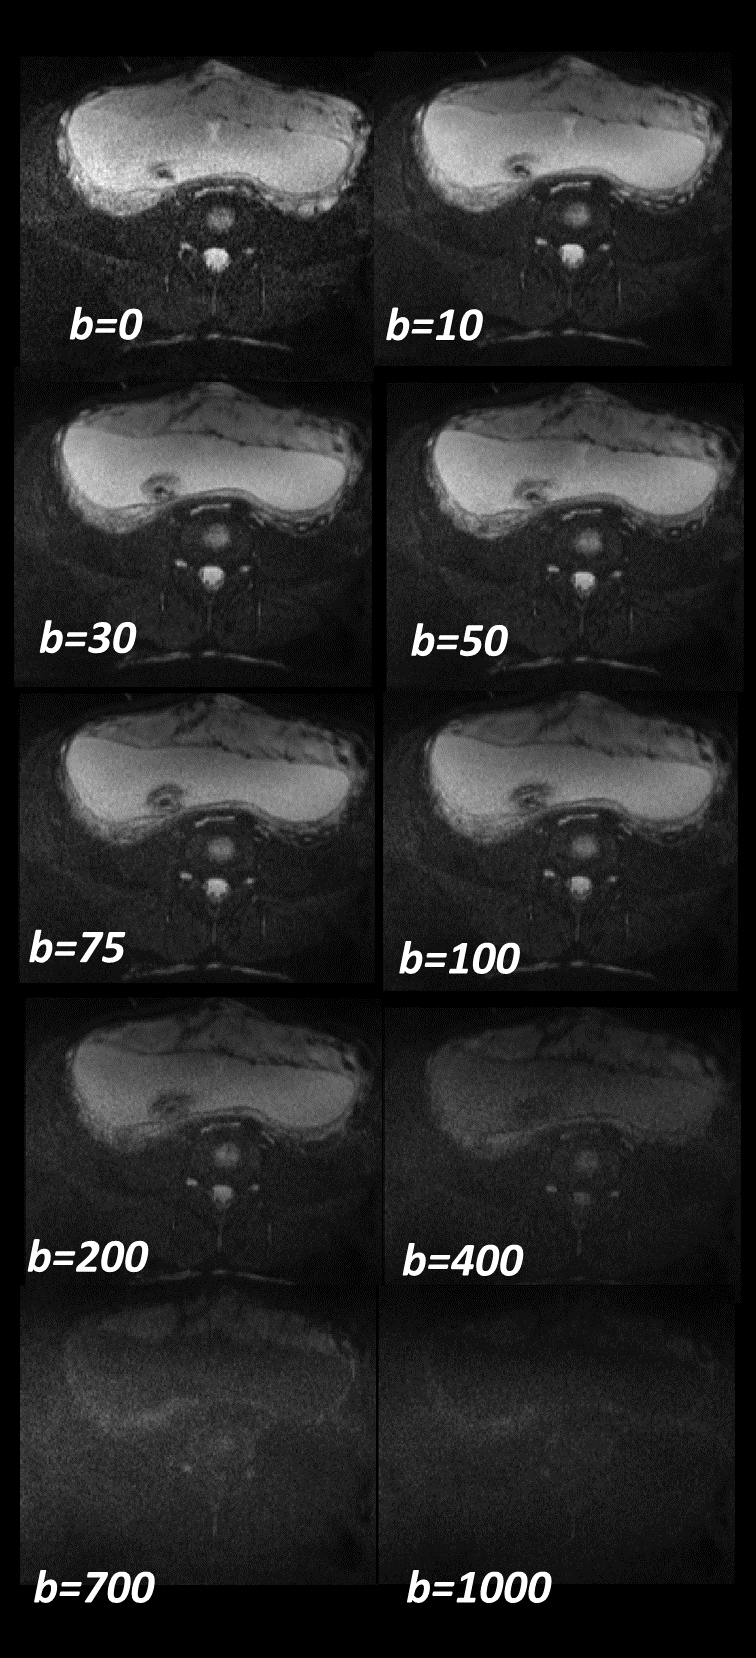
We used data from 12 pregnant women (Gestational weeks mean+/-std=22+/-2.3w) acquired on a 1.5T scanner (Siemens Avanto, Erlangen, Germany), included a Diffusion-weighted Spin-Echo Echo-Planar Imaging with repetition time/echo time, TR/TE=3900ms/74.8ms; bandwidth=1184Hz/px; matrix size=192x192, FOV 220x220, number of slices=from 18 to 30. The in-plane resolution was 2.0x2.0mm2 and the slice thickness 5mm. The diffusion encoding gradients were applied along 3 no-coplanar directions using seven different b-values (0,10, 30, 50,75,100,200,400,700,1000 s/mm2) and averaged over the three directions. The number of averaged signal (NS) for each b value was NS=4. A Matlab (MathWorks, 2015a) home-made script was used to fit the model to the data.
Analysis
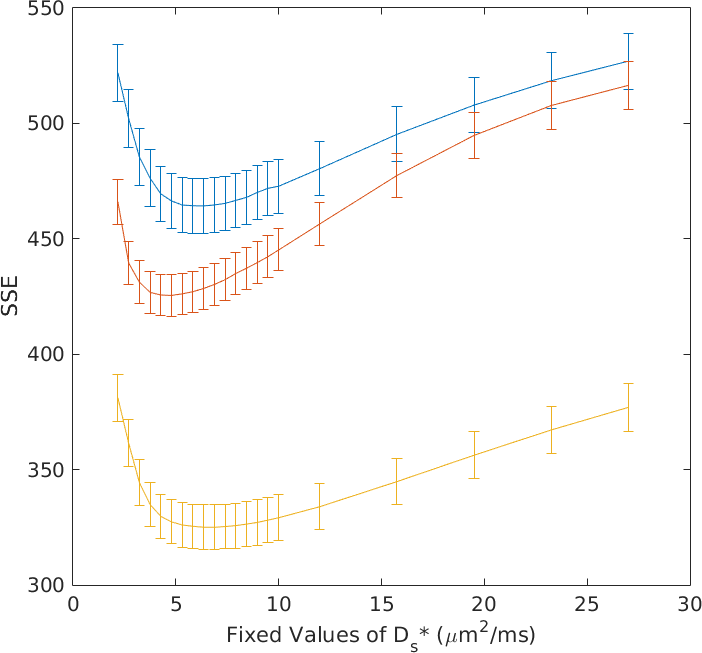
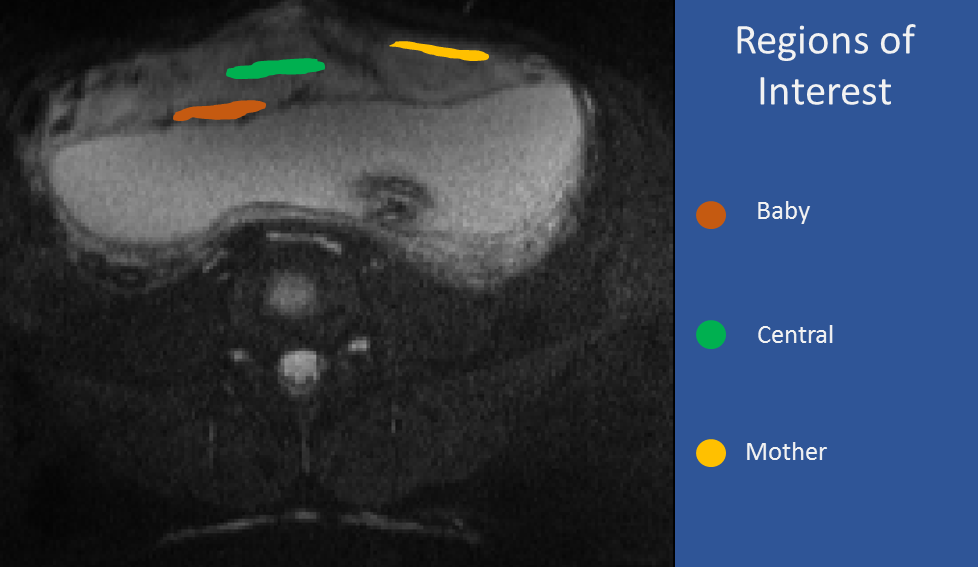
To find the best value for D*s to be fixed, we selected one slice for each subject and repeated the fitting procedure voxel-wise for different values of D*s comprised between 3 and 27 µm2/ms. For all the subject we found that the value of D*s that minimize the objective function of the fit (sum of squared errors in our case) lain between 4 and 6 µm2/ms (figure 2). Three Regions of Interest (ROIs) were selected in each placenta (figure 3): One considering the placenta tissues near the fetus (baby), one central and one on the mother side (mother). We evaluated the fit’s outputs, averaging the signal in these ROIs, to avoid instabilities of the fit.
Results
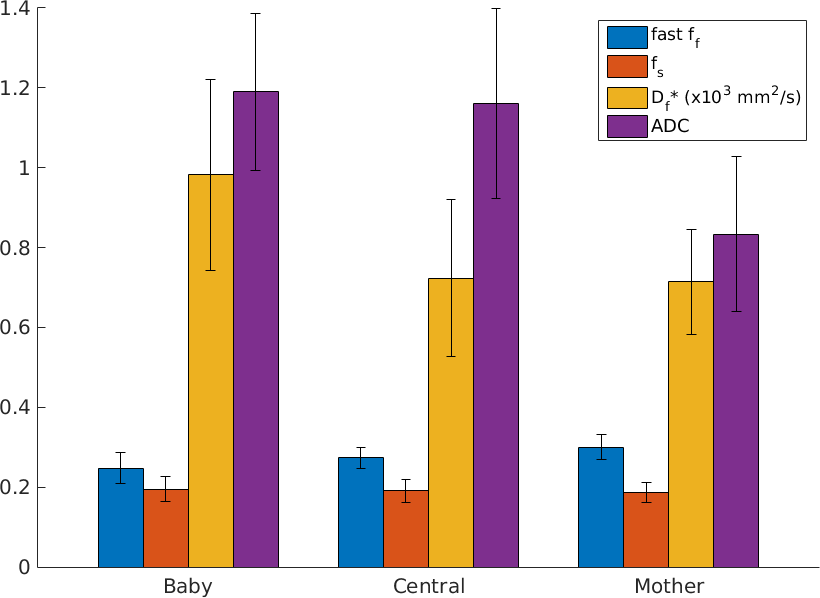
Figure 4 shows the mean values of the four parameters output of the fit in the three regions of interest. The parameters are: fast pseudo perfusion fraction (ff), slow pseudo perfusion fraction (fs), fast pseudo perfusion coefficient (Df*) and ADC. Fast perfusion compartment seems to have a higher concentration then the slow perfusion compartment. Interestingly the higher difference can be found in mother. We used an ANOVA test to look for differences between the mean values, but no significant differences were found. The values of the ADC are higher in the baby and central ROI than in the mother ROI. The fast pseudo perfusion coefficient is higher in the baby ROI than the other two.Discussions
This is a preliminary study to test the feasibility of using a two-perfusion compartments model to fit diffusion weighted data. The results are consistent with what previously found in similar studies carried on other mammalian placenta’s models6,7. The fast perfusion coefficient is expected to be three orders higher than the ADC. Anyway, the optimal value of fixed D*s that we found is sensibly smaller than what found in animal studies. The value of the fractions of perfusion compartments is consistent with IVIM’s perfusion compartment fractions reported on previous studies on humans’ placentae4,5. Moreover, IVIM’s pseudo perfusion coefficient is known to be highly variable. The addition of another perfusion compartment seems to stabilize the evaluation of its counterpart in our two-perfusion model (as can be seen in the error bar of figure 4). However, a direct link with the tissue’s microstructures is still premature and should be further investigated.Acknowledgements
No acknowledgement found.References
1 Regnault, T., Galan, H., Parker, T. & Anthony, R. Placental development in normal and compromised pregnancies—a review. Placenta 23, S119-S129 (2002).
2 Serov, A. S., Salafia, C., Grebenkov, D. S. & Filoche, M. The role of morphology in mathematical models of placental gas exchange. Journal of Applied Physiology 120, 17-28 (2016).
3 Moore, R. J. et al. In utero perfusing fraction maps in normal and growth restricted pregnancy measured using IVIM echo-planar MRI. Placenta 21, 726-732, doi:10.1053/plac.2000.0567 (2000).
4 Moore, R. et al. In vivo intravoxel incoherent motion measurements in the human placenta using echo‐planar imaging at 0.5 T. Magnetic resonance in medicine 43, 295-302 (2000).
5 Capuani, S. et al. Diffusion and perfusion quantified by Magnetic Resonance Imaging are markers of human placenta development in normal pregnancy. Placenta 58, 33-39 (2017).
6 Avni, R., Neeman, M. & Garbow, J. Functional MRI of the placenta–From rodents to humans. Placenta 36, 615-622 (2015).
7 Solomon, E. et al. Major mouse placental compartments revealed by diffusion-weighted MRI, contrast-enhanced MRI, and fluorescence imaging. Proceedings of the National Academy of Sciences 111, 10353-10358 (2014).
Figures