3104
MRI approaches to map focal cortical dysplasia in focal epilepsy using anomalous diffusion and magnetic susceptibility1Centre for Advanced Imaging, University of Queensland, Brisbane, Australia
Synopsis
Focal cortical dysplasias (FCD) are developmental malformations of the cerebral cortex that are often highly epileptogenic. When medications fail to control seizures, surgical removal of dysplastic epileptogenic tissue may be curative. But, in 20-40% of patients current MRI scans cannot identify FCD affected brain regions. Building on the anomalous nature of diffusion and magnetic susceptibility of tissue, we aimed to improve in vivo identification of FCD in the brain. We found the combination of anomalous diffusion model parameters and tissue magnetic susceptibility can be used to differentiate FCD from healthy tissue in the brain.
Introduction
Focal cortical dysplasias (FCD) are developmental malformations of the cerebral cortex that are often highly epileptogenic. They are characterised by abnormal cortical architecture, with disruption of the normal organisation of the cortex into well-defined layers and grey-white matter blurring. Approximately 75% of patients with FCD develop epilepsy and surgical removal of dysplastic epileptogenic tissue may be curative if medications fail to control seizures.1 The ability to accurately detect and localise the epileptogenic tissue to be resected is vital for surgical success. Patients with clearly definable lesions on MRI have a 60-80% chance of seizure freedom after surgery versus a 30-40% success rate for MRI-negative patients.2-5 However, visual analysis of conventional MRI scans is normal in 20-40% of FCD patients.6 Hence, it is essential to develop MRI-based methods which can delineate abnormal tissue in focal epilepsy patients with FCD. We aimed to bridge this gap by exploiting the properties of anomalous diffusion and by studying the magnetic susceptibility characteristics of tissues. Such an approach has not been explored to date in focal epilepsy and FCD.Methods
Ethics was granted by the Royal Brisbane and Women’s Hospital and the University of Queensland’s human research ethics committees, Brisbane, Australia. Two consenting focal epilepsy patients were recruited for the study. A 7 T Siemens whole body MRI research scanner (Siemens Healthcare, Erlangen, Germany) was used to acquire data. Diffusion-weighted data: bipolar planar diffusion imaging pulse sequence with 2 mm3 and 1.5 mm3 isotropic resolution, seven b-values between 0 and 3,000 s/mm2 in steps of 500 s/mm2. 3D gradient recalled multiple-echo non-flow-compensated data: 0.75 mm3 isotropic resolution using 9 echo times starting from 4.98 ms and in steps of 3.13 ms. Total scan time to acquire data was 45 minutes per participant, which included the acquisition of standard clinical scans.
We opted to use the fractional motion (FM) model as the parameters of this model have been demonstrated to be sensitive to tissue microstructure variations.7 The FM model describes the MRI signal in terms of the statistical properties of water diffusion:
$$S(b)=S_0exp\left[-\eta Db^{\alpha/2}\left(\Delta-\frac{\delta}{3}\right)^{-\alpha/2}\Delta^{\alpha+\beta}\delta^{-\alpha}\right].$$
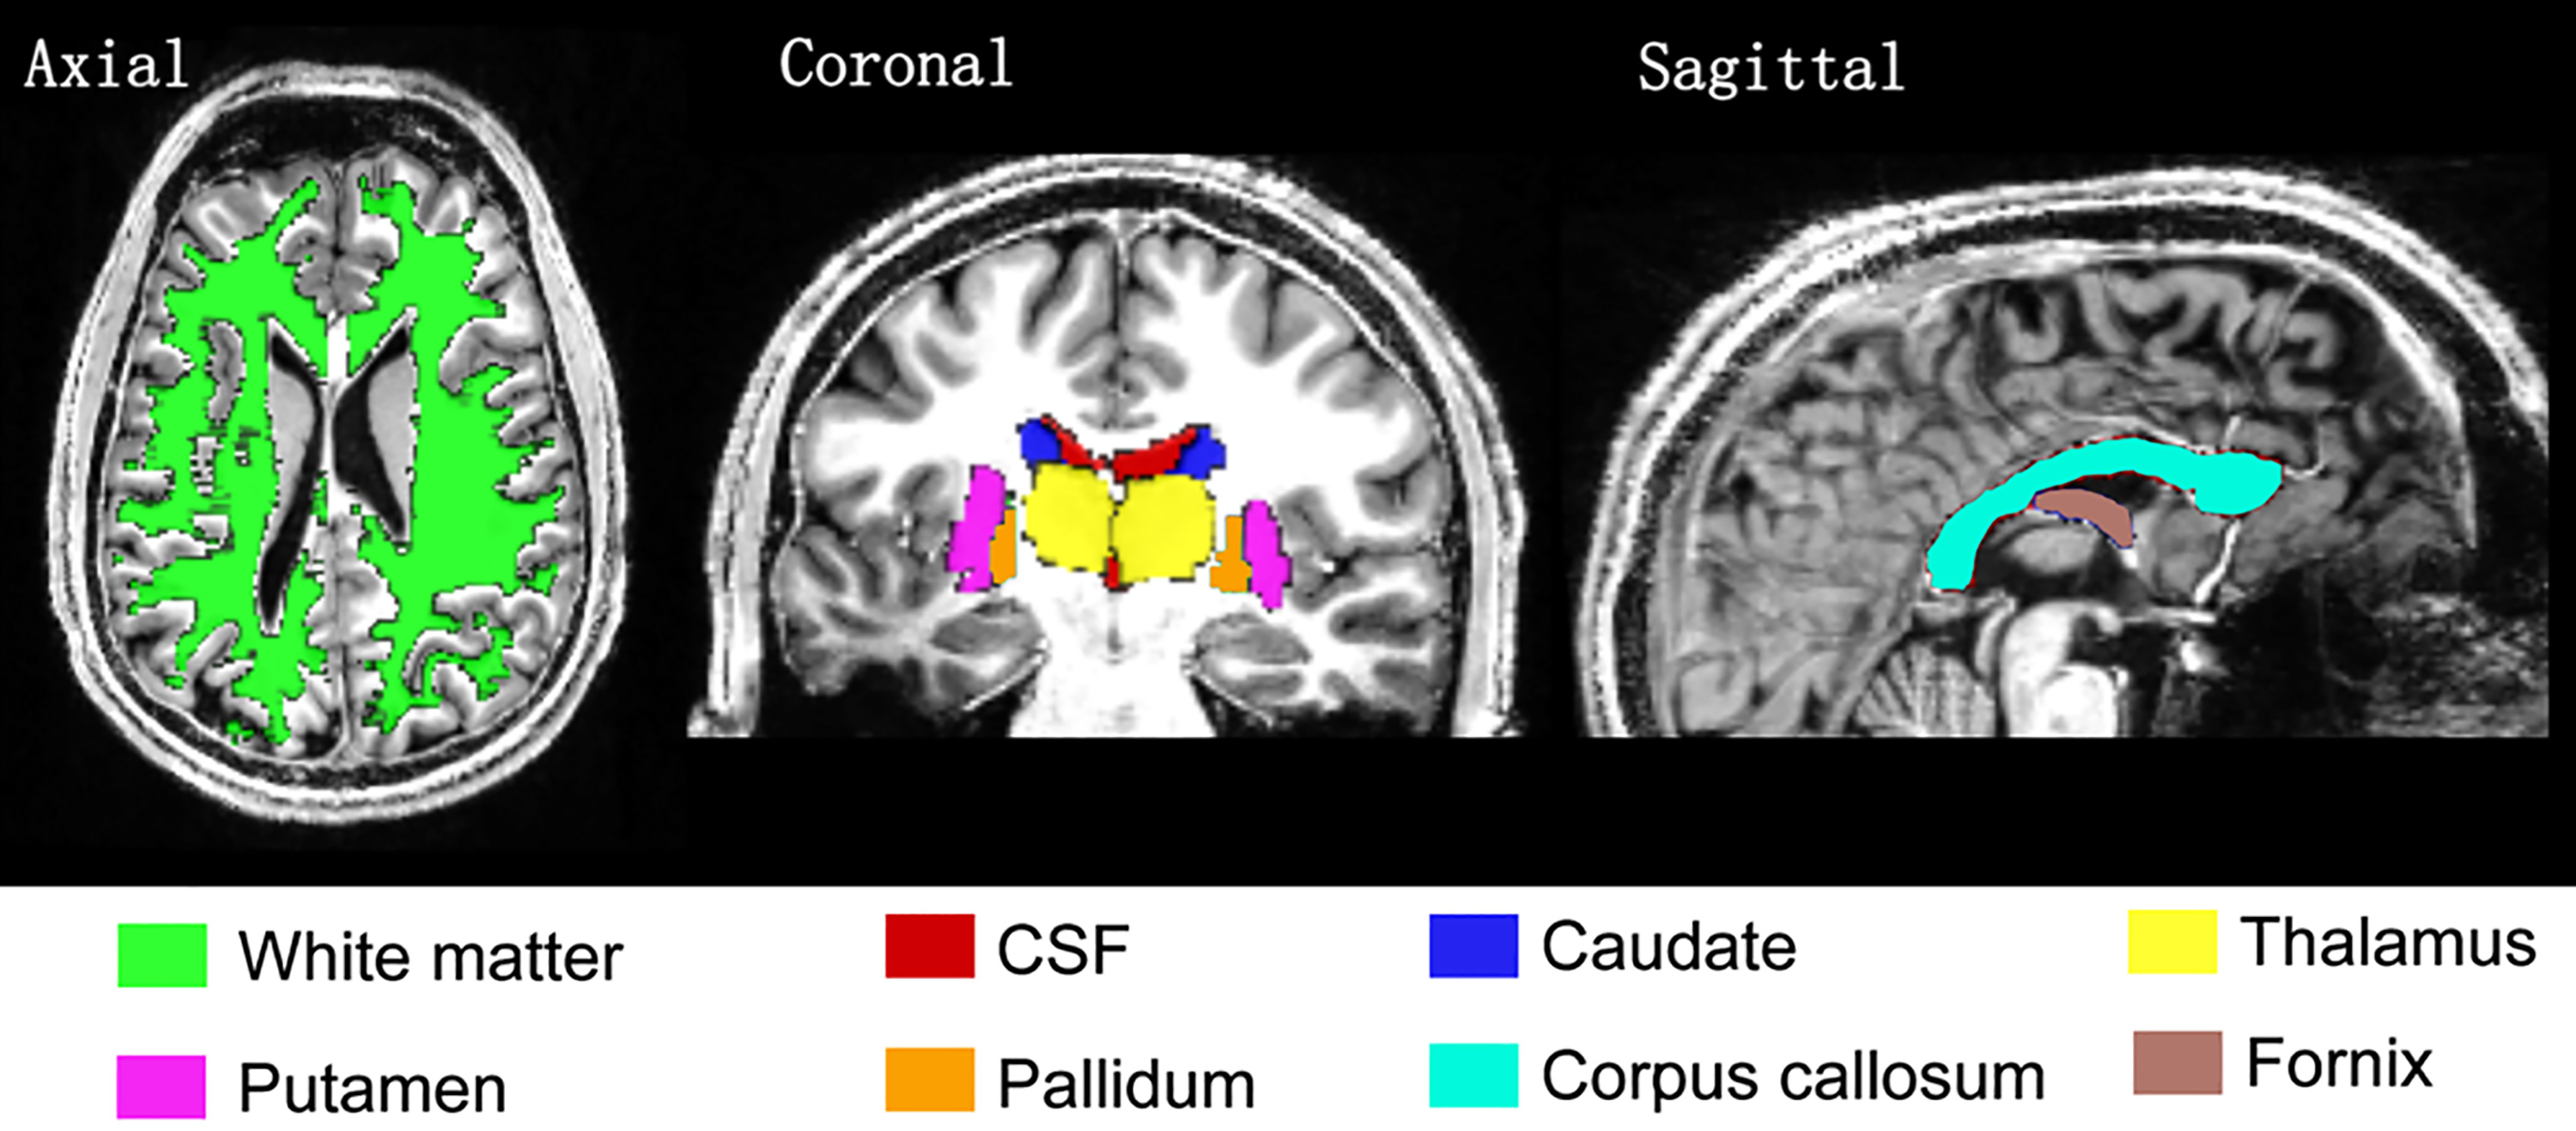
Here, $$$D$$$ is the anomalous diffusion coefficient, $$$\eta$$$ is a dimensionless number required to maintain nominal unit for $$$D$$$ in $$$\mu$$$m2/ms. The parameter $$$\alpha$$$ governs the variance of diffusion increments and parameter $$$\beta$$$ measures the correlation properties of increments. $$$\Delta$$$ is the time between the two pulses and $$$\delta$$$ is the gradient duration. A nonlinear least squares algorithm (Levenberg-Marquardt) in MATLAB® was used to solve for $$$D$$$, $$$\alpha$$$ and $$$\beta$$$ by fitting the acquired data. Magnetic susceptibility was calculated from gradient recalled multiple-echo non-flow-compensated data using STI Suite V2.2.8 Brain regions shown in Figure 1 were segmented using FreeSurfer.9 Figure 2 shows regions-of-interest(ROIs) located in healthy and dysplastic grey matter used to assess changes in parameter $$$\alpha$$$ and magnetic susceptibility.
Results
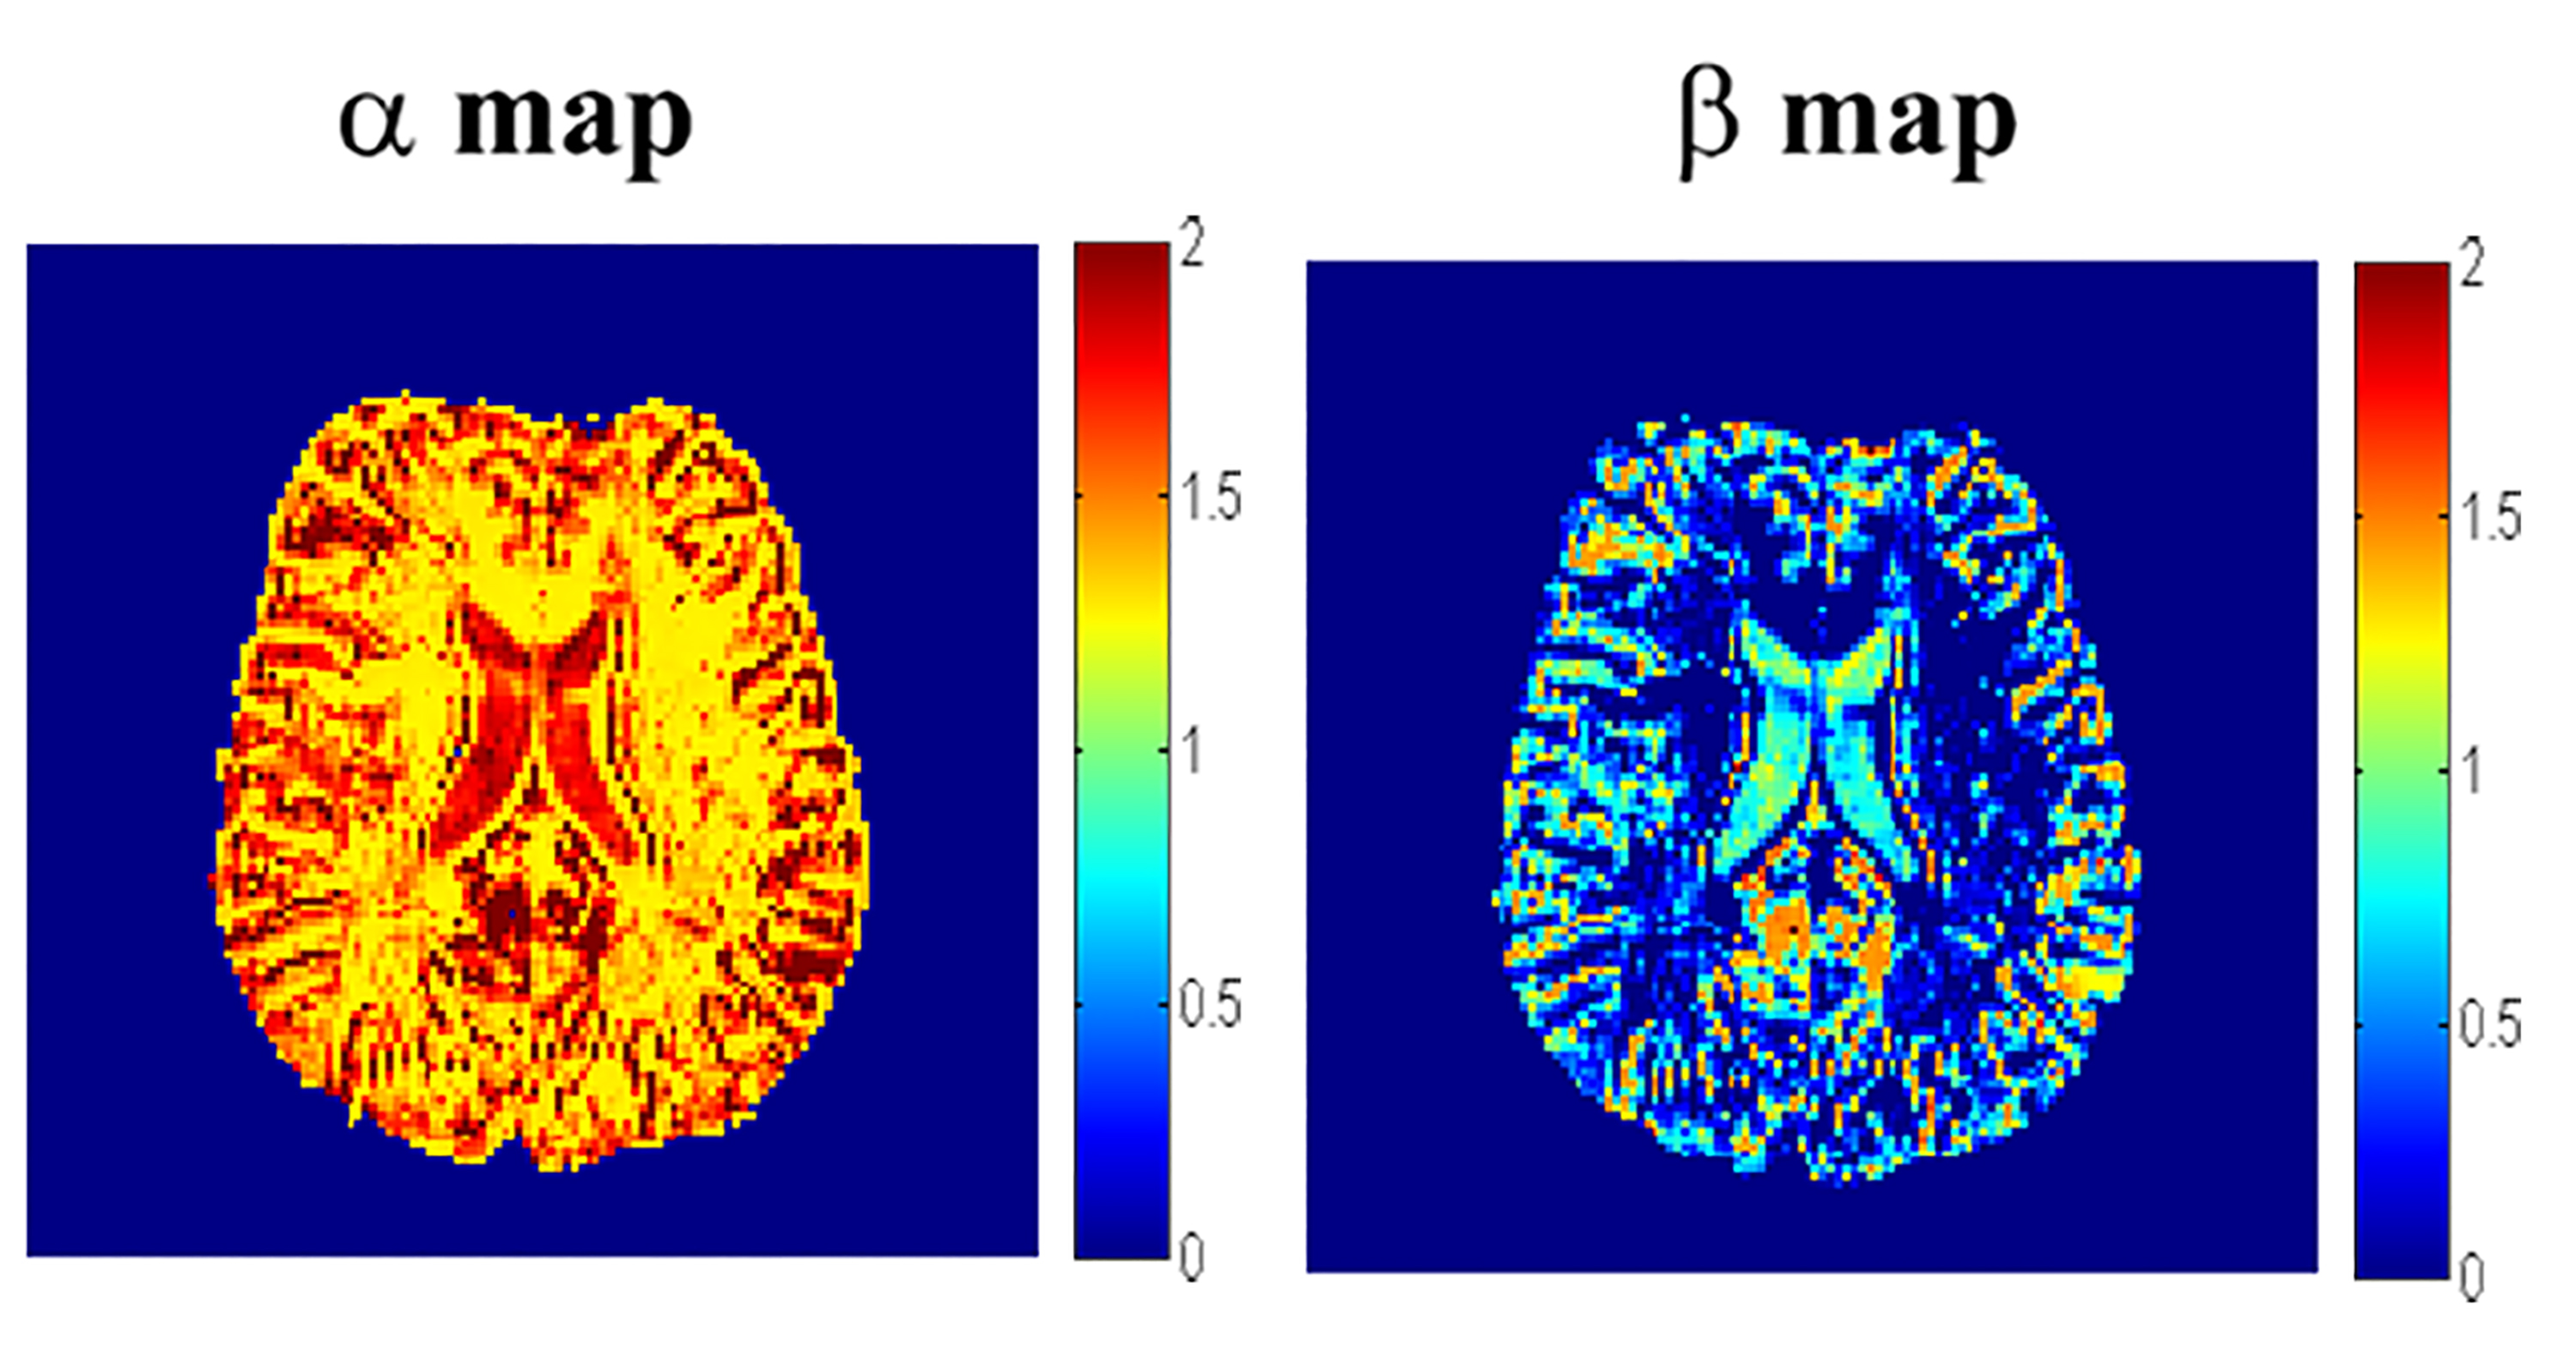
An example of a spatially resolved map of $$$\alpha$$$ and $$$\beta$$$
is shown in Figure 3. These parameters elucidate clear grey-white matter
contrast in the healthy human brain. Figure 4 shows that with increasing echo
time, $$$\alpha$$$ from the FM model and magnetic susceptibility of tissue are
able to differentiate FCD from normal brain and cortical grey matter regions (compare
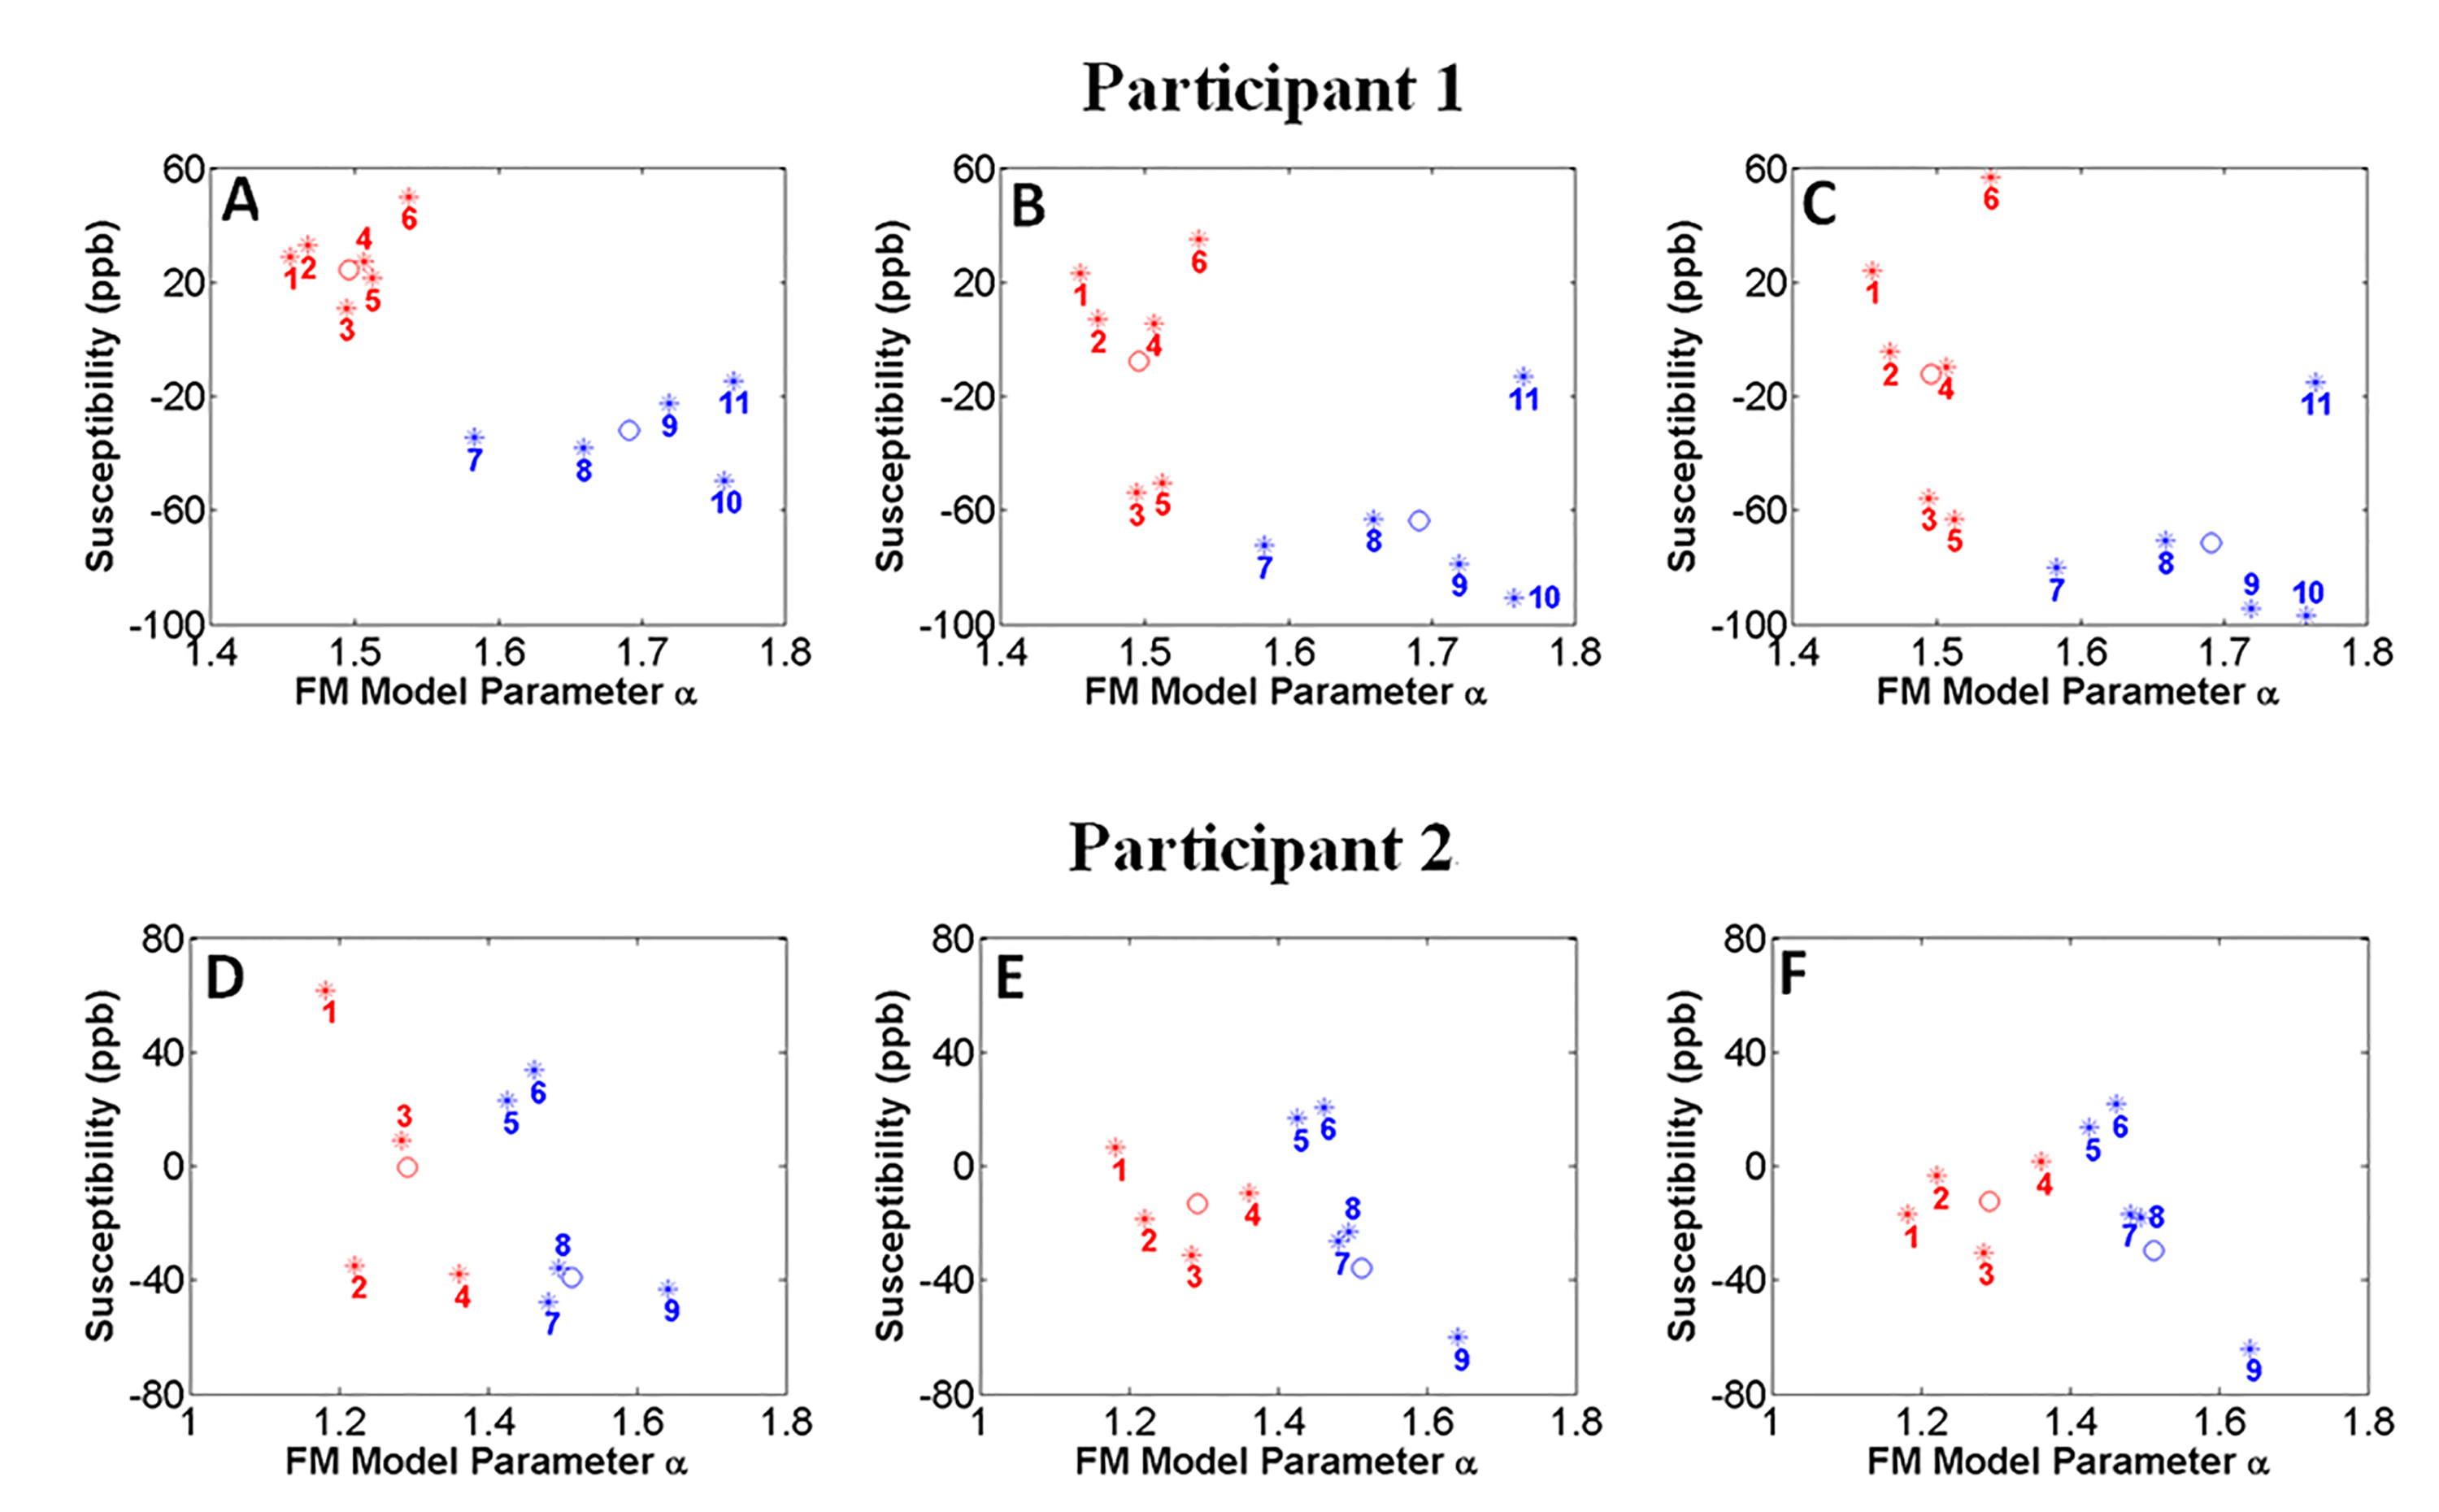
average GM to average FCD) in our two participants. Figure 5 highlights that $$$\alpha$$$ is
smaller in all healthy grey matter ROIs (red markers) in comparison to the
dysplastic grey matter regions (blue markers) for the two patients.Discussion
Parameter $$$\alpha$$$ may be influenced by the magnetic susceptibility of tissue,10 and the apparent magnetic susceptibility varies with echo time.11 This suggests that magnetic environment and diffusion signal formation are likely to be linked. Region-by-region analysis of the brain cortex provides sufficient sensitivity to changes due to FCD, and importantly, this approach eliminates the need to segment the brain into specific regions.Conclusion
The combination of $$$\alpha$$$ from the FM model and tissue magnetic susceptibility respectively mapped from diffusion-weighted and gradient recalled echo MRI data appears to be spatially selective for dysplastic grey matter brain regions. Such an approach of combining different modality MRI data can lead to improved sensitive to microstructural variations and potentially be used to distinguish small dysplastic cortical grey matter areas from healthy cortical grey matter.Acknowledgements
Professor David Reutens and Dr Viktor Vegh acknowledge the Australian Research Council for the award of a Discovery Project Grant (DP140103593). Aiman AI Najjar and Nicole Atcheson from the Centre for Advanced Imaging, University of Queensland, for helping with data acquisition.References
- Aronica E, Becker AJ, Spreafico R. Malformations of cortical development. Brain Pathology. 2012; 22(3): 380-401.
- Téllez-Zenteno JF, Hernández-Ronquillo L. A review of the epidemiology of temporal lobe epilepsy. Epilepsy research and treatment. 2012;2012.
- Wieshmann UC, Larkin D, Varma T, et al. Predictors of outcome after temporal lobectomy for refractory temporal lobe epilepsy. Acta Neurologica Scandinavica. 2008;118(5):306-12.
- Stavem K, Bjørnæs H, Langmoen IA. Predictors of seizure outcome after temporal lobectomy for intractable epilepsy. Acta neurologica scandinavica. 2004;109(4):244-9.
- Berkovic SF, McIntosh AM, Kalnins RM, et al. Preoperative MRI predicts outcome of temporal lobectomy an actuarial analysis. Neurology. 1995;45(7):1358-63.
- Wagner J, Weber B, Urbach H, et al. Morphometric MRI analysis improves detection of focal cortical dysplasia type II. Brain. 2011;134(10):2844-54.
- Fan Y, Gao JH. Fractional motion model for characterization of anomalous diffusion from NMR signals. Physical Review E. 2015;92(1):012707.
- Li W, Avram AV, Wu B, et al. Integrated Laplacian-based phase unwrapping and background phase removal for quantitative susceptibility mapping. NMR Biomed. 2014;27(2): 219-227.
- Dale AM, Fischl B, Sereno MI. Cortical Surface-Based Analysis: I. Segmentation and Surface Reconstruction. NeuroImage. 1999;9(2): 179-194.
- Palombo M, Gabrielli A, De Santis S, et al. Spatio-temporal anomalous diffusion in heterogeneous media by nuclear magnetic resonance. The Journal of chemical physics. 2011;135(3):034504.
- Sood S, Urriola J, Reutens D, et al. Echo time‐dependent quantitative susceptibility mapping contains information on tissue properties. Magnetic resonance in medicine. 2017;77(5):1946-58.
Figures