3102
In Vivo 3D Axonal Diameter Estimation in the Human Brain with 300 mT/m Gradient MRI1Max Planck Institute for Human Cognitive and Brain Sciences, Leipzig, Germany, 2Athinoula A. Martinos Center for Biomedical Imaging, Massachusetts General Hospital, Charlestown, MA, United States, 3Tel Aviv University, Tel Aviv, Israel
Synopsis
The estimation of neural micro-structure in general and axon diameter in particular became feasible using advanced diffusion imaging frameworks such as CHARMED and AxCaliber. Recently, the AxCaliber model was extended to 3D enabling to capture the axonal properties of any fiber system in the brain. In this work we challenged the utility of using the CONNECTOM MRI, that provides a gradient strength of up to 300 mT/m, for axon diameter estimation. We found that the sensitivity of the model towards small diameter axons increases dramatically with the use of the strong gradient system increasing the validity and accuracy of AxCaliber3D.
Introduction
The axonal diameter distribution of white matter fiber tracts in the brain is an important structural parameter for understanding the function-anatomical organization of the brain, for diagnosis of various diseases, and computational modeling of brain functionality. AxCaliber (Assaf et al., 2008) for the first time offers the possibility to estimate this distribution non-invasively for fibers with a pre-selected direction (e.g., corpus callosum). Here we introduce a novel model that abandons this restriction and allows for a reconstruction of axonal caliber distributions of fiber tracts in 3D. However, this involves the measurement of much more diffusion weighted q-space images. Therefore, the SNR inevitably drops, in particular for images with high b-value, resulting in a selective underestimation of the small fibers. This can be compensated by using higher gradient strength. Here we demonstrate that 300 mT/m yields plausible and reproducible axonal caliber distribution in three dimensions.Methods
Acquisition: Subjects were scanned on either a Siemens Magnetom CONNECTOM or a Siemens Magnetom PRISMA scanner. Diffusion weighted images were acquired with the following parameters:
CONNECTOM: TR/TE = 7500/70 ms, 86 gradient directions distributed on 5 b-value shells with maximal b-value of 5000 s/mm2, three diffusion times $$$\Delta$$$ ranging from 16 to 40 ms and $$$\delta$$$ of 9 ms, Gmax of 259 mT/m, resolution 1.8mm isotropic EPI, 210 mm FOV, matrix size of 116, 2268 Hz/Px bandwidth, GRAPPA 2, no partial Fourier, 70 slices;
PRISMA: TR/TE = 3000/151 ms, 86 gradient directions distributed on 5 b-value shells with maximal b-value of 3000 s/mm2, three diffusion times $$$\Delta$$$ ranging from 40 to 100 ms and $$$\delta$$$ of 22ms, Gmax of 72 mT/m, resolution 2.2 mm iso. In addition to the multi-shell, multi diffusion time acquisition, we also acquired a HARDI dataset with a single shell (b=1000 s/mm2) and 64 gradient directions.
AxCaliber Analysis: Following motion correction and estimation of the major fiber directions using constrained spherical deconvolution of the HARDI dataset (Tournier et al., 2007), a regression model was used to fit the diffusion MRI data in each voxel. The AxCaliber 3D model was used to produce signal predictors for 4 diffusion components: a CSF component, a hindered diffusion (using a diffusion tensor model) and two axonal populations. The axonal populations were modeled using the AxCaliber pipeline as described previously using two different gamma functions to represent populations of small axons (narrow distribution centered around 1.5 mm) and large axons (broad distribution centered around 4 mm).
Fiber tracking: The HARDI dataset was used to compute streamlines representing fiber-tracts using a deterministic model with FA threshold of 0.2, maximum angle of 30°, and voxel sub-sampling of 4. Fiber-tracking was performed using ExploreDTI (Leemans et al. 2009).
Tract based analysis: Under the assumption that along a tract the diameter distribution should not change, for each tract we averaged the regression betas for the different component predictors (CSF, hindered, small axons, large axons). From these tract-based data we computed a map of the ratio between the small and large axonal populations as well as the sum of them (as a measure of axonal density).
Results and Discussion
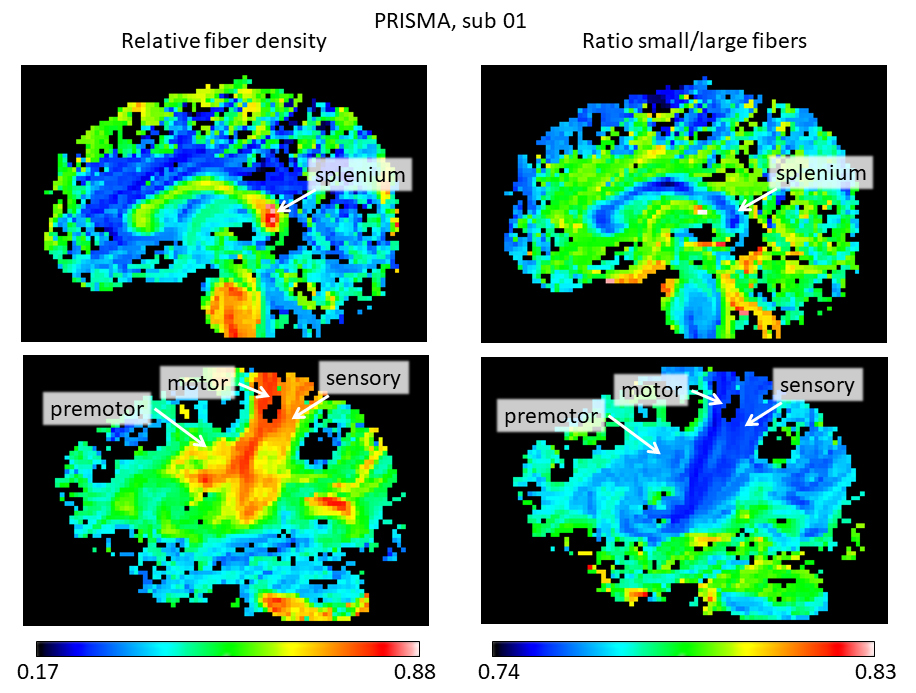
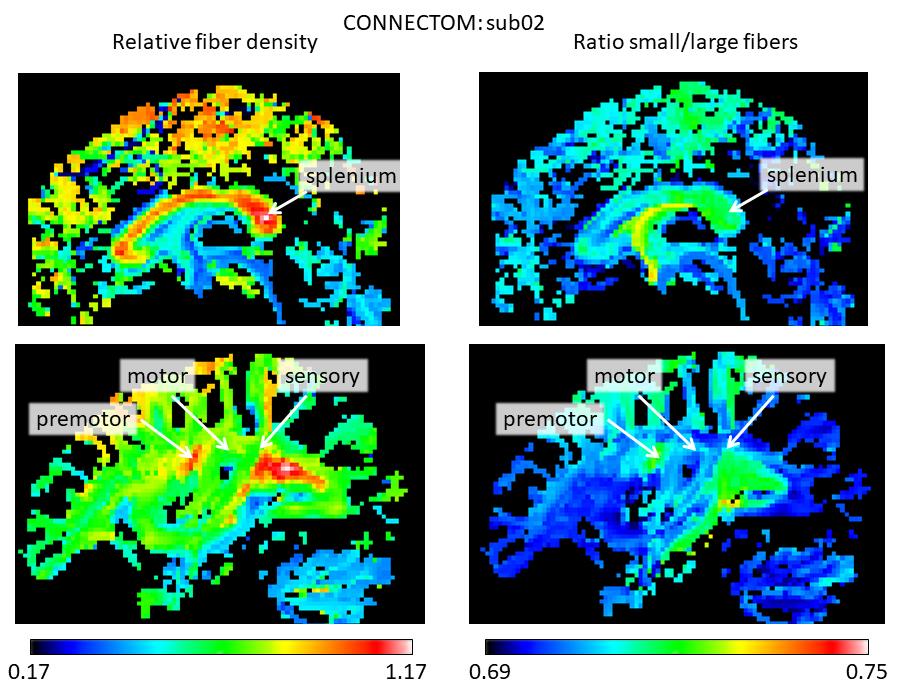
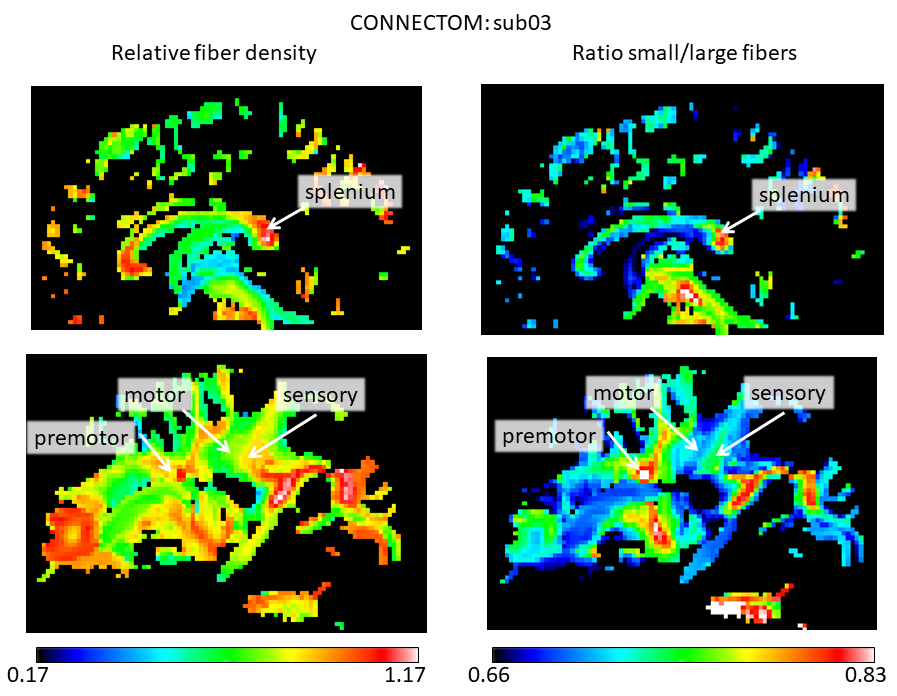
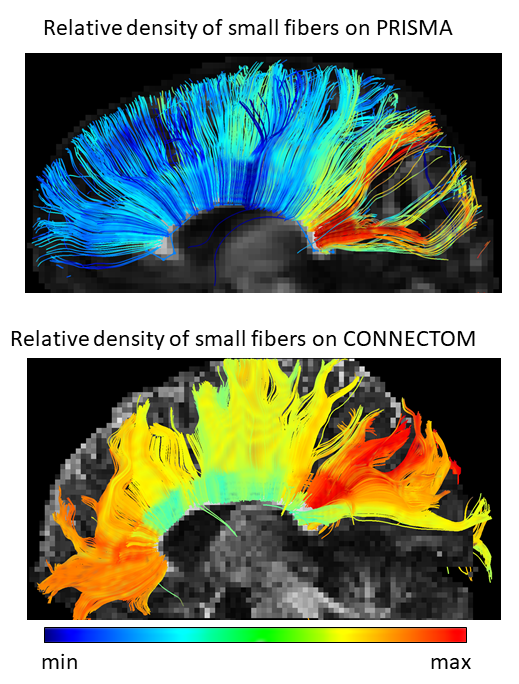
The stronger gradient of the Connectom allowed to considerably reduce $$$\delta$$$ (from 22 to 9 ms) and $$$\Delta$$$ (from 100 to 40 ms), increasing the sensitivity to shorter displacements (Mitra et al. 1995) and allowing for shorter echo times, leading to strongly improved SNR. Figure 1 shows the results for the AxCaliber3D reconstruction for data from the Prisma. The fiber density is increased in a number of major fiber tracts, including the splenium of the corpus callosum and the sensory and motor (but not the premotor) parts of the internal capsule. All of them invariantly show an increased proportion of large fibers. Figures 2 and 3 shows the AxCaliber3D results for 2 subjects that were scanned in the Connectom MRI. Here the fiber density show similar pattern to what was shown in Prisma results but the proportion of small fibers is dramatically increased. The latter observation suggests that due to the increased gradient strength and the reduced duration of the diffusion gradient (d) better sensitivity to axons with small diameters is achieved. This is nicely demonstrated in Figure 4 that shows the AxCaliber3D small fiber density for the corpus callosum for the Prisma scanner (top) and Connectom MRI (bottom). While both scanners capture the difference in axon diameter between the splenium and the body of the corpus callosum, the Connectom data also shows higher magnitude of small-axonal population in the genu as expected from histology.Acknowledgements
References
- Assaf Y, Blumenfeld-Katzir T, Yovel Y, Basser PJ. AxCaliber: A Method for Measuring Axon Diameter Distribution from Diffusion MRI. Magnetic Resonance in Medicine. 2008;59(6):1347-1354. doi:10.1002/mrm.21577.
- Leemans A, Jeurissen B, Sijbers J, Jones DK. Proceedings of the 17th Annual Meeting of International Society for Magnetic Resonance in Medicine. Hawaii. 2009. ExploreDTI: A graphical toolbox for processing, analyzing, and visualizing diffusion MR data; p. 3537.
- Mitra, P. P., & Halperin, B. I. Effects of finite gradient-pulse widths in pulsed-field-gradient diffusion measurements. Journal of Magnetic Resonance, Series A, 1995;113(1):94-101. doi: 10.1006/jmra.1995.1060.
- Tournier JD, Calamante F, Connelly A. Robust determination of the fibre orientation distribution in diffusion MRI: non-negativity constrained super-resolved spherical deconvolution. NeuroImage. 2007;35:1459–72. doi: 10.1016/j.neuroimage.2007.02.016.
Figures