3100
Analysis of the T2-Relaxation-Diffusion Correlation MRI in Glioblastoma1Biomedical Engineering, University of Michigan, Ann Arbor, MI, United States, 2Radiation Oncology, University of Michigan, Ann Arbor, MI, United States, 3Radiology, University of Michigan, Ann Arbor, MI, United States
Synopsis
Analysis of the T2-relaxation-diffusion correlation is an emerging approach. It has the potential to reveal the biophysical behavior of tissue and tumor, which cannot be done by the analysis of T2-relaxation and diffusion MRI separately. This study applied this approach to glioblastoma (GBM) and revealed the different correlations between T2 and diffusion in tumor, normal tissue and edema.
Purpose
An emerging approach in microstructural imaging is to combine multiple contrasts into a single analysis1. This approach would allow an exploration of the T2-relaxation-diffusion correlation in brain tumors to better understand tumor physiology than using diffusion or T2-relaxation MRI alone.
In this study, we explored the T2-relaxation-diffusion correlation in glioblastoma with MR images acquired on a clinical 3T scanner. Specifically, we explored 1) TE-dependent diffusion coefficients and then 2) the T2-relaxation-diffusion correlation in tumors compared to normal white matter and grey matter and edema. Using this approach, we observed significantly different T2 values and diffusion coefficients putatively related to intra- and extra-cellular water diffusion in glioblastoma and normal tissues.
Methods
Theory
In a 2D experiment of combining measurements of T2 relaxation and diffusion coefficient D, the acquired signal S (TE, b) can be written as:$$S(TE,b)=\iint P(T2,D)exp(- \frac{TE}{T2})exp(-bD) dT2dD$$where is the probability density of T2 and D. This equation is an ill-posed problem and has an infinite number of solutions. However, the number of resolutions can be reduced using prior knowledge.
In this study, we simplified the first equation to two discrete fast and slow diffusion components as: $$S=S_{f0}exp(-bD_{f})exp(- \frac{TE}{T2_{f}})+S_{s0}exp(-bD_{s})exp(- \frac{TE}{T2_{s}})$$
MRI Data
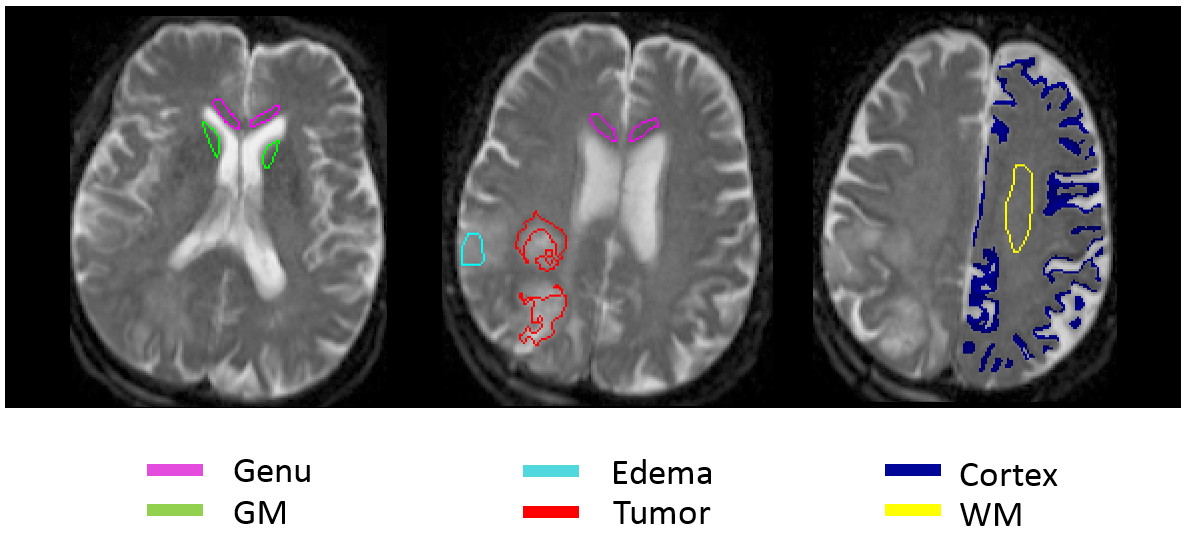
Thirty patients with newly diagnosed histologically confirmed GBM were studied. Diffusion weighted images (DWIs) were acquired with 11 b values from 0 to 2500 s/mm2 at two different TEs (93 and 113 ms) on a 3T scanner (Skyra, Siemens Healthineers). First, DW signals were fitted to the conventional bi-exponential model (without considering TE). Secondly, DW signals were fitted to the second equation to investigate the T2-relaxation-diffusion correlation. Fitting was performed in volumes of interest (VOIs) of solid tumor (determined from a previous study), edema (distance from tumor and recurrence but with T2 elevation), and 2 white matter (WM) and 2 grey matter (GM) regions (Figure 1) using a simplex algorithm in Matlab. Fitting was run multiple times, and the results with the minimum MSE were accepted. Differences of fitted parameters between tissue types were evaluated by Students’ t-test.
Results
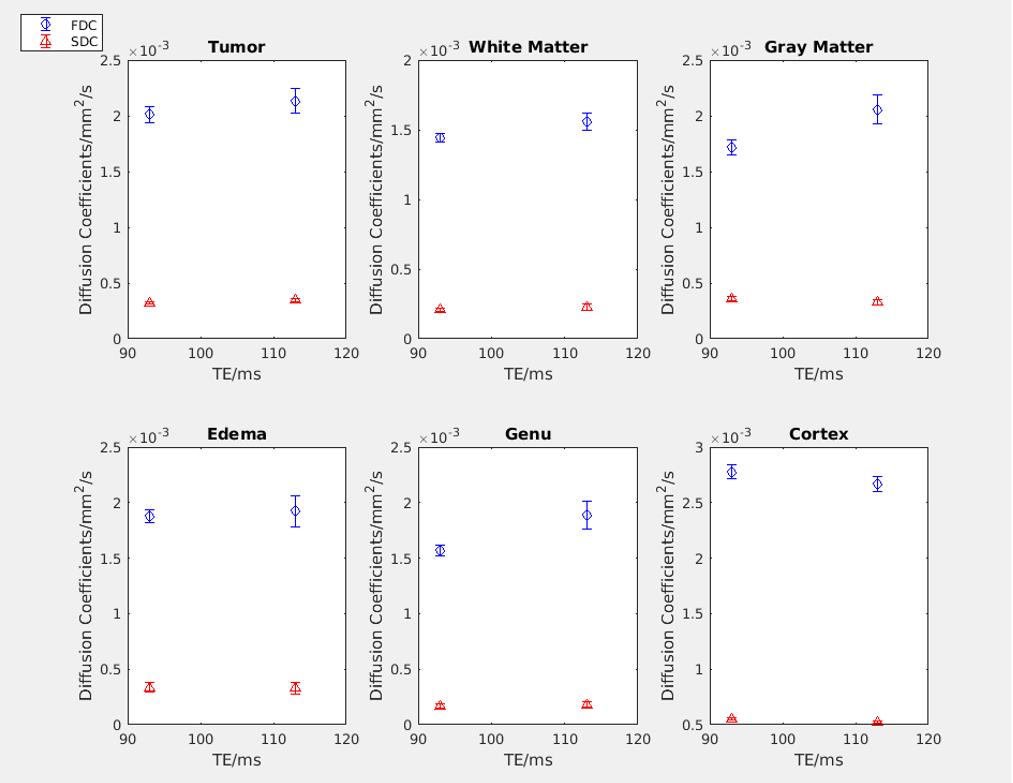
TE-dependent Diffusion Coefficients
Figure 2 shows fast and slow diffusion coefficients fitted to DW images with different TE values in tumor, frontal WM, genu, deep GM (head of caudate nucleus), edema and cortex. There are minor to significant differences in fast diffusion coefficients between different TEs in tumor and normal tissues.
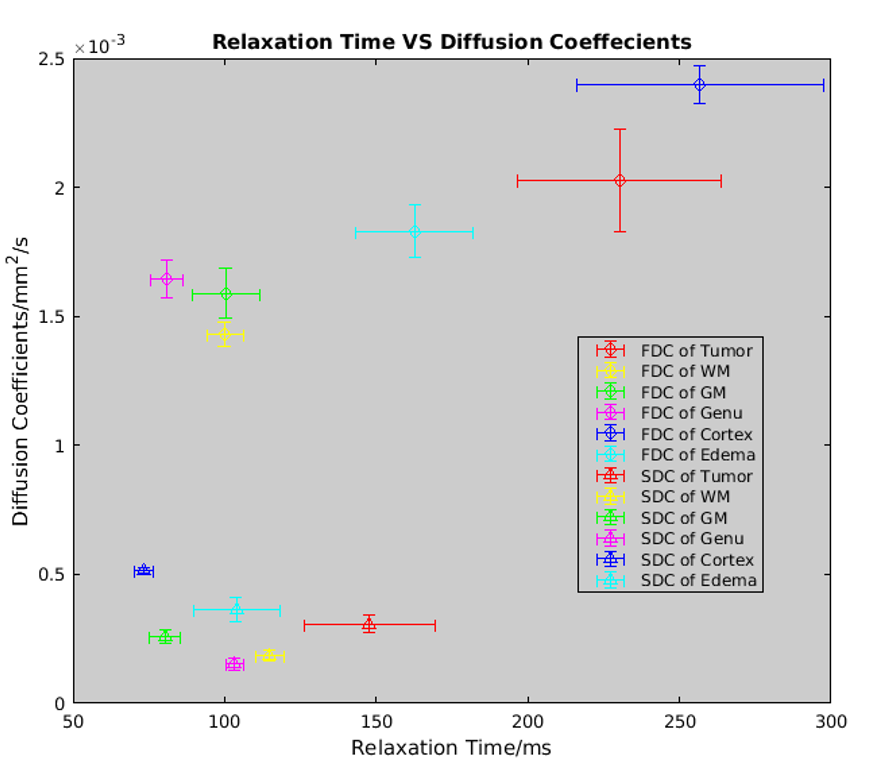
T2-relaxation-Diffusion Correlation
Figure 3 shows the T2-relaxation-diffusion distributions from tumors and normal WM and GM by fitting the second equation. There were significant differences between fast and slow diffusion coefficients and between associated T2 values in tumor, cortex, deep GM, and edema (p<0.001). For tumors, cortex, deep GM, and edema, the fast diffusion coefficients (Df) were associated with elongated T2 values; while for WM including frontal WM and genu, the fast diffusion coefficients were associated with short T2 values. The tumor had Df significantly greater than WM and deep GM (p<0.05) but not cortex and edema, and T2f significantly greater than all other tissue types (p<0.05) except cortex possibly due to the partial volume effect of cerebral spinal fluid (CSF). For the slow compartment, the tumor had significantly greater T2s than all other tissue types. The Ds in the tumor was not significantly different from all other tissue types.
Discussion
Subtle to substantial T2 differences in tumor and normal tissue are revealed by the analysis of the T2-relaxation-diffusion correlation. This might not be able to be achieved by analyzing T2 relaxation and diffusion MRI alone. The T2-relaxation-diffuson distribution has the potential to separate tumor from normal tissue and edema if modeling of CSF can be improved. Future studies will include optimizing the acquisition in the TE-b space and improving classification of tumor from normal tissue and edema using multi-parameters.Acknowledgements
This work is supported in part by a grant of NIH/NCI 1U01CA183848.References
1. D. Bernin and D. Topgaard, "NMR diffusion and relaxation correlation methods: New insights in heterogeneous materials", Current Opinion in Colloid & Interface Science, vol. 18, no. 3, pp. 166-172, 2013.Figures