3098
IVIM values in healthy brain1Biomedical Engineering Department, Universidad de Valparaiso, Valparaiso, Chile, 2Universidad Politécnica de Valencia, Valencia, Spain, 3Center for Biomedical Imaging, Pontificia Universidad Católica de Chile, Santiago, Chile, 4Servicio de Imagenología, Hospital Carlos van Buren, Valparaiso, Chile, 5Facultad de Medicina, Universidad de Valparaiso, Valparaiso, Chile, 6Radiology Department, Pontificia Universidad Católica de Chile, Santiago, Chile, 7Informatics Department, Universidad Técnica Federico Santa María, Valparaíso, Chile
Synopsis
Even though there is much interest in brain IVIM imaging, it is difficult to get a clear view from literature on which values to expect. Our purpose is to obtain healthy brain D, D* and f, to add findings and get closer to reference values. Two distributions of 16 b-values were used to acquire data on 10 volunteers, at 1.5T: one commonly found in literature and the other considered as optimal. Values obtained from the “optimal distribution” were significantly different in all cases but D in white matter. This study emphasizes the dependence of IVIM results on the acquisition scheme applied.
Introduction
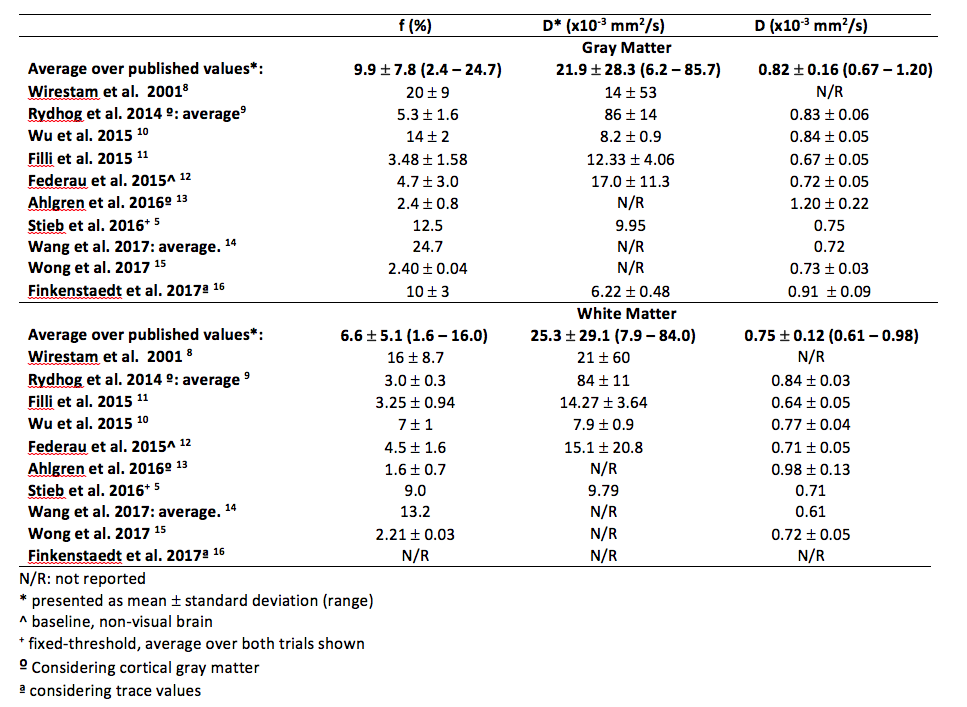
It has become easier to obtain good quality diffusion images due to the recent improvements in MR equipment. As a consequence, there has been a renewed interest towards brain IVIM images and their relation with perfusion-related information. Various studies emphasize the relevance of these images in clinical applications, such as tumor differentiation1, grading gliomas2, stroke3 among other applications. Nevertheless, a revision of current literature does not give a clear view of what values to expect in healthy tissues, as summarized in table 1. The goal of this study is to collect a set of cerebral IVIM values in healthy subjects to provide additional findings to consolidate reference values, to be obtained in a context as close as commonly found in clinical set-ups.
Materials and Methods
This study was approved by the institutional Ethical Committee and included ten healthy subjects (7 males, 24.7 ± 6.8 y.o.). Images were acquired on a 1.5T Philips scanner. Conventional PGSE-EPI sequence was used, with TR/TE of 4000/110ms, acceleration factor of 2, FOV 230 mm, matrix size 1282. Two b-value distributions were used, one commonly found in literature {0; 10; 20; 30; 40; 50; 60; 70; 80; 90; 100; 150; 200; 400; 800; 1000} s.mm-2 and the other one, “optimal” according to Lemke et al.4 {0; 40; 50; 60; 150; 160; 170; 190; 200; 260; 440; 560; 600; 700; 980; 1000} s.mm-2. Images were processed in MATLAB. We adjusted the perfusion fraction f, pseudo-diffusion coefficient D* and diffusion coefficient D according to equation 1, where S stands for the signal magnitude of diffusion-weighted image and S0 stands for the signal magnitude without diffusion weighting.
$$S = S_0 \left [fe^{-bD^*} + (1-f)e^{-bD} \right ]$$
IVIM parameters were fitted using trust-region-reflective algorithm in two steps. Four ROIs were positioned in GM and four ROI in WM in each volunteer’s images. Analysis was then undertaken over signal average over each ROI. We considered as outlier the ROI whose values were superior to the population mean plus three standard deviations. Heteroscedastic, two-tails t-test was applied to check difference between populations.
Results
Quality of fit was confirmed in all cases. Even though a slightly higher number of outliers were detected in literature distribution than in optimal distribution (4 vs 1), no significant difference in quality of fit was found between optimal and literature distribution (p=0.058 in case of GM and p = 0.950 in case of WM).
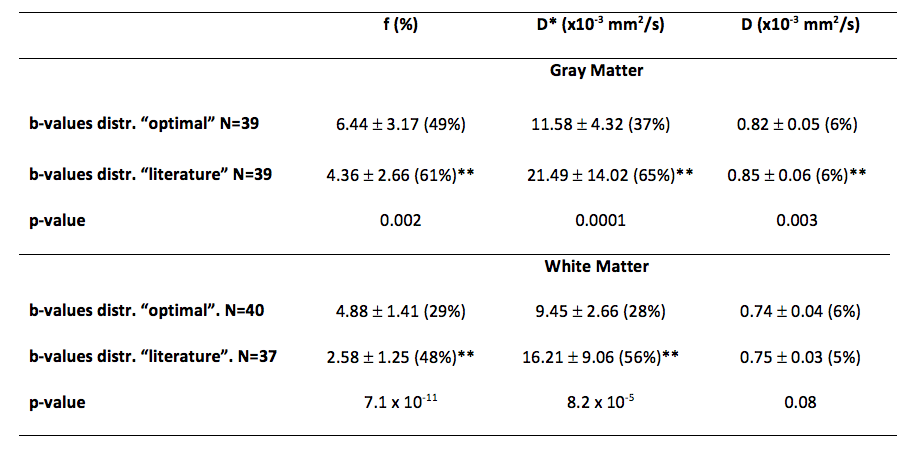
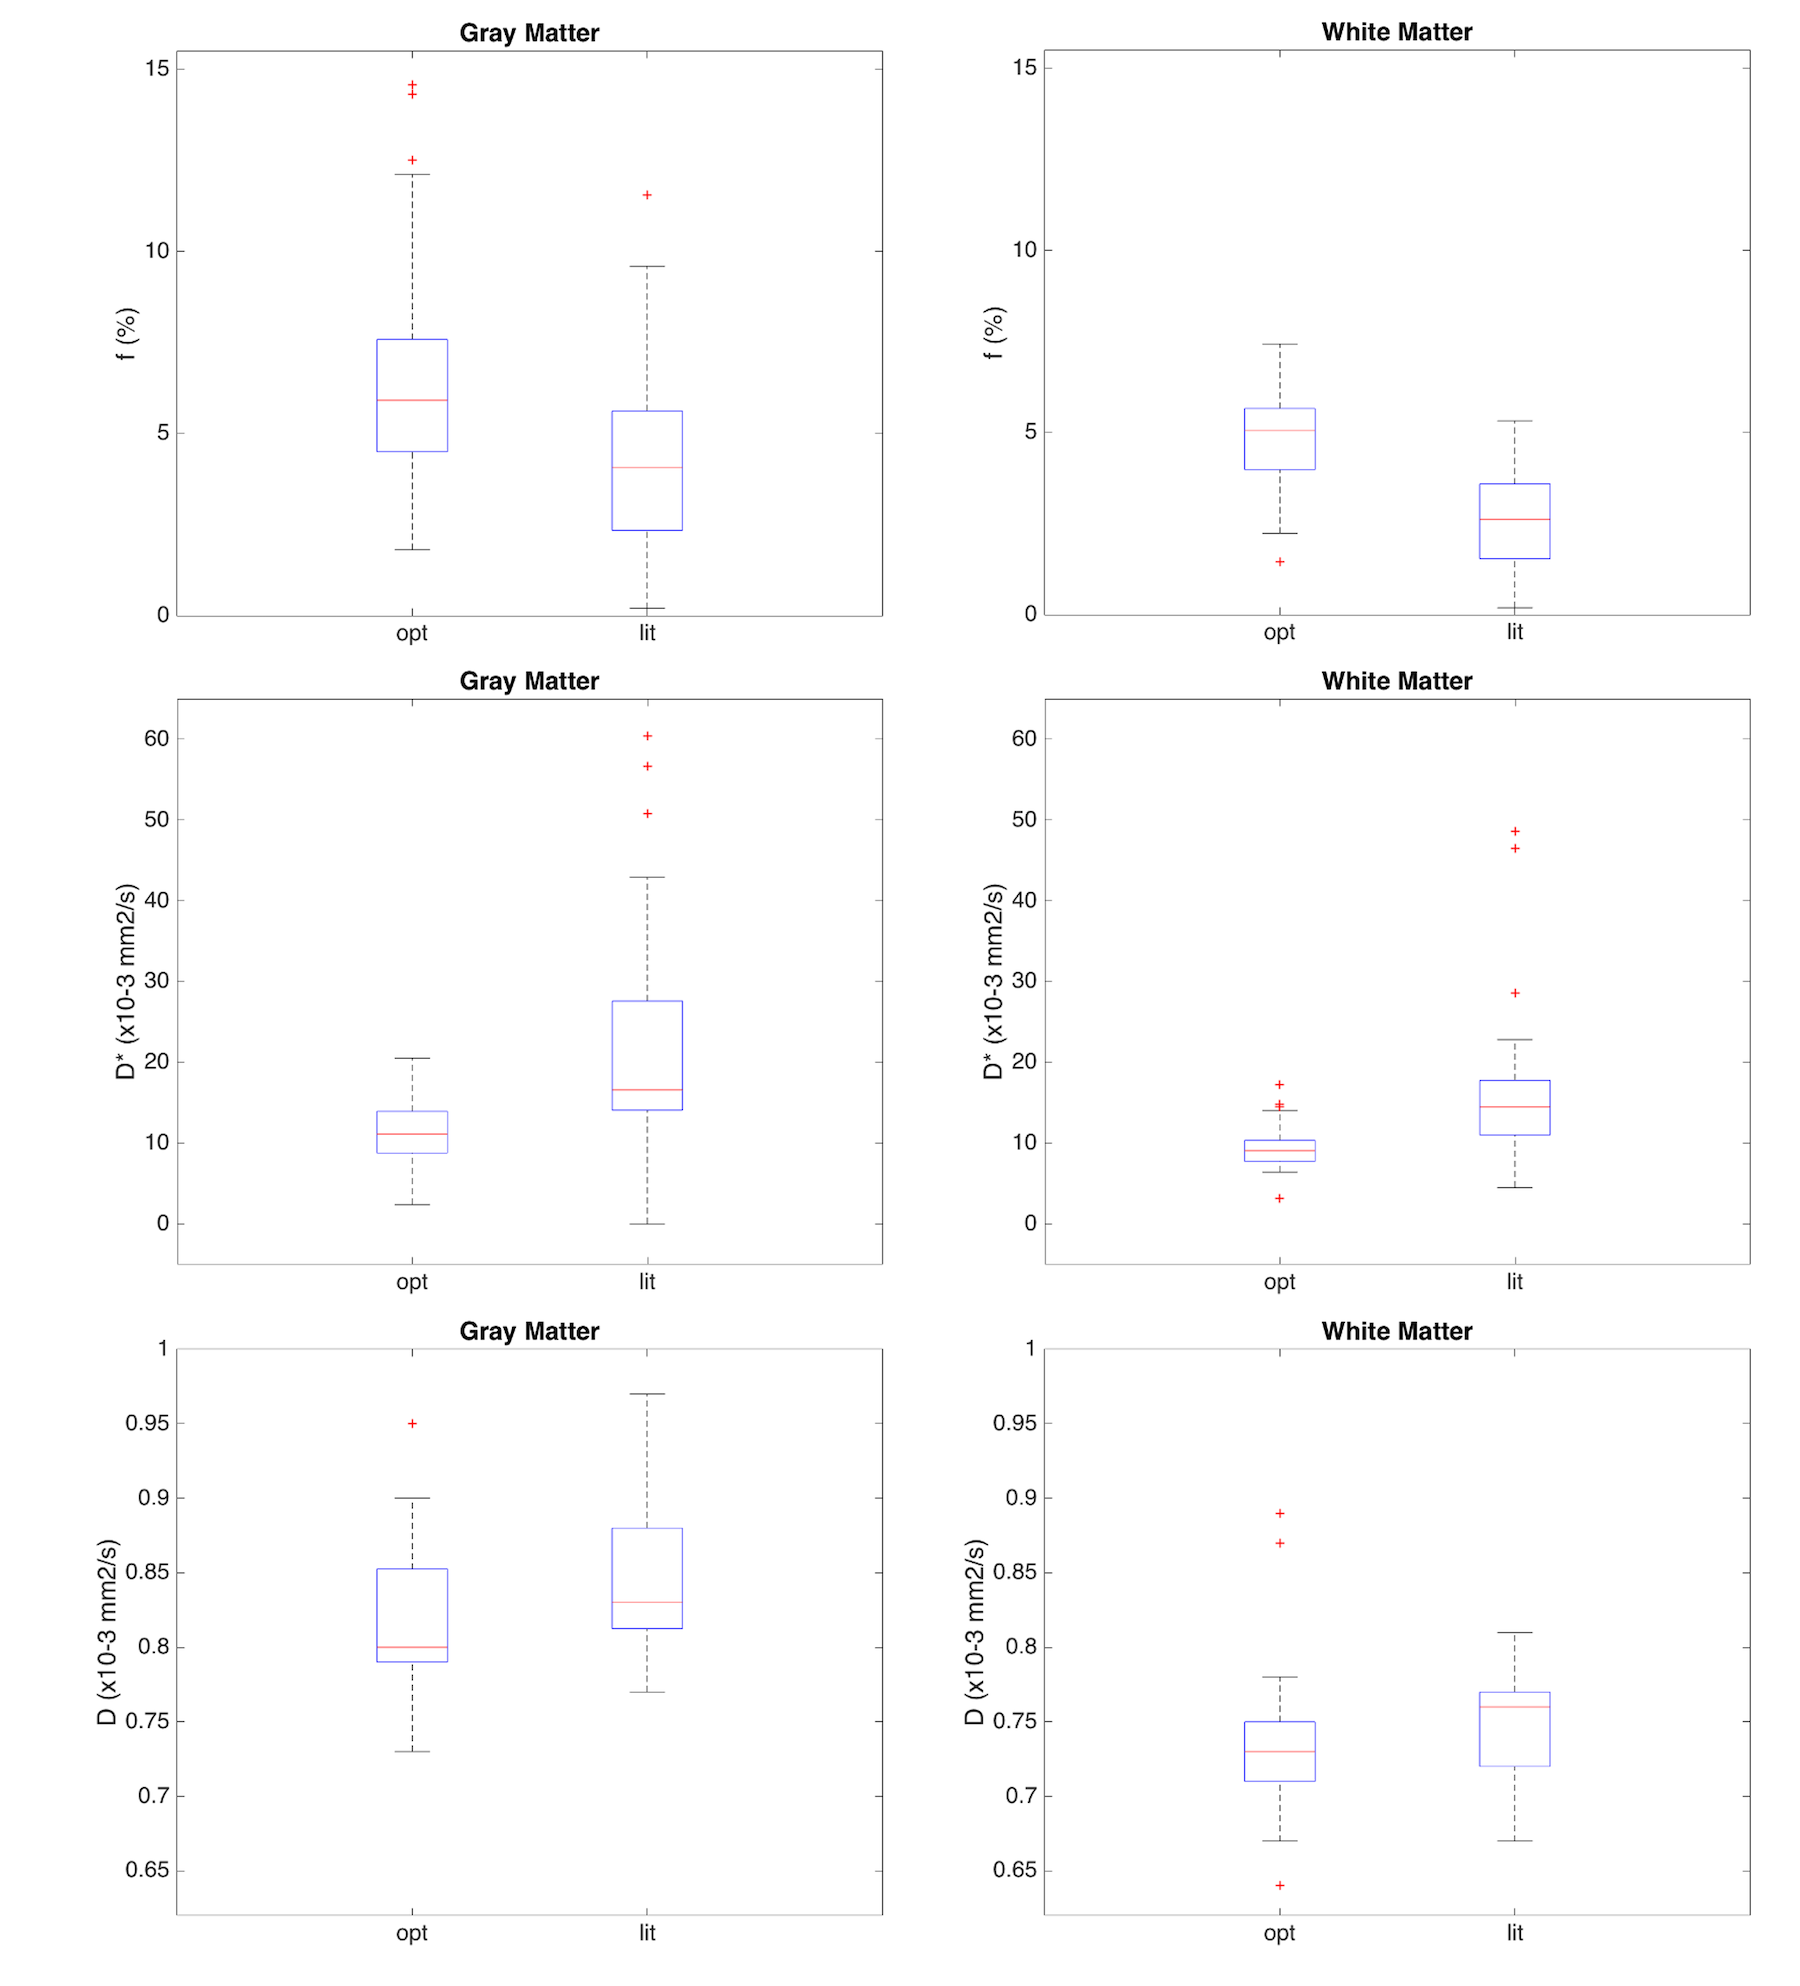
Averaged values for perfusion fraction, pseudo-diffusion and diffusion coefficients are summarized in table 2, and visualized as box-plot in figure 1. All values obtained with the optimal distribution were significantly different from the ones obtained with literature distribution, except for D in white matter. f values are higher with the optimal distribution and D* are lower with the optimal distribution. f and D are different (p<0.01) in WM compared to GM, in both cases of optimal and literature distributions. D* variations were such that no difference is found between GM and WM in both literature and optimal distribution schemes.
Standard deviations of IVIM parameters adjusted using data obtained with the optimal b-value distribution are lower than the ones obtained with the literature distribution. There is more variance observed in analysis in GM. Of all parameters (f, D* and D), D* is the least stable.
Discussion and conclusion
Discussion has been active about the impact of the methodology used to estimate IVIM parameters: different fitting methods have been used, using one or two-steps for parameters fitting, constraining fit or not, about a possible dependence over b-value threshold to be used when adjusting parameters by parts, showing among other point the influence of SNR over robustness of evaluation5-7.
This work offers new elements to answer two of the current questions in IVIM imaging: which values are to be expected and how to set up the acquisition in a clinical setting. This study shows the dependence of IVIM parameters estimation to b-value distribution scheme. Our recommendation would be to choose an optimal b-value distribution such as the one proposed by Lemke et al.4, as the parameters variance is lower. Much is to be explored still in IVIM acquisition, to develop its full potential interest as biomarkers in different pathologies.
Acknowledgements
Grant support: CONICYT - PIA - Anillo ACT1416; PMI UVA 1402References
- Federau C, Meuli R, O’Brien K, Maeder P, Hagmann P. Perfusion measurement in brain gliomas with intravoxel incoherent motion MRI. Am J Neuroradiol 2014;35:256–62
- Lin Y, Li J, Zhang Z, et al. Comparison of Intravoxel Incoherent Motion Diffusion-Weighted MR Imaging and Arterial Spin Labeling MR Imaging in Gliomas. Biomed Res Int 2015;2015:234245.
- Suo S, Cao M, Zhu W et al. Stroke assessment with intravoxel incoherent motion diffusion-weighted MRI. NMR Biomed 2016;29:320–8.
- Lemke A, Stieltjes B, Schad LR, Laun FB. Toward an optimal distribution of b values for intravoxel incoherent motion imaging. Magn Reson Imaging 2011;29:766–76.
- Stieb S, Boss A, Wurnig MC et al. Non-parametric intravoxel incoherent motion analysis in patients with intracranial lesions: Test-retest reliability and correlation with arterial spin labeling. NeuroImage Clin 2016;11:780–8.
- Meeus EM, Novak J, Withey SB, Zarinabad N, Dehghani H, Peet AC. Evaluation of intravoxel incoherent motion fitting methods in low-perfused tissue. J Magn Reson Imaging 2017;45:1325–34.
- Wurnig MC, Donati OF, Ulbrich E, et al. Systematic analysis of the intravoxel incoherent motion threshold separating perfusion and diffusion effects: Proposal of a standardized algorithm. Magn Reson Med 2015;74:1414–22.
- Wirestam R, Borg M, Brockstedt S, Lindgren A, Holtås S, Ståhlberg F. Perfusion-related parameters in intravoxel incoherent motion MR imaging compared with CBV and CBF measured by dynamic susceptibility-contrast MR technique. Acta Radiol 2001;42:123–8.
- Rydhög AS, van Osch MJP, Lindgren E, et al. Intravoxel incoherent motion (IVIM) imaging at different magnetic field strengths: What is feasible? Magn Reson Imaging 2014;32:1247–58.
- Wu WC, Chen YF, Tseng HM, Yang SC, My PC. Caveat of measuring perfusion indexes using intravoxel incoherent motion magnetic resonance imaging in the human brain. Eur Radiol 2015;25:2485–92.
- Filli L, Wurnig MC, Luechinger R, Eberhardt C, Guggenberger R, Boss A. Whole-body intravoxel incoherent motion imaging. Eur Radiol 2015;25:2049–58.
- Federau C, O’Brien K, Birbaumer A, Meuli R, Hagmann P, Maeder P. Functional mapping of the human visual cortex with intravoxel incoherent motion MRI. PLoS One 2015;10:1–11.
- Ahlgren A, Knutsson L, Wirestam R, et al. Quantification of microcirculatory parameters by joint analysis of flow-compensated and non-flow-compensated intravoxel incoherent motion (IVIM) data. NMR Biomed 2016;29:640–9.
- Wang C, Ren D, Guo Y et al. Distribution of intravoxel incoherent motion MRI-related parameters in the brain: evidence of interhemispheric asymmetry. Clinical Radiology 2017;72:94.e1-94.e6.
- Wong SM, Zhang CE, van Bussel FCG et al. Simultaneous investigation of microvasculature and parenchyma in cerebral small vessel disease using intravoxel incoherent motion imaging. NeuroImage Clin 2017;14:216–21.
- Finkenstaedt T, Klarhoefer M, Eberhardt C et al. The IVIM signal in the healthy cerebral gray matter: A play of spherical and non-spherical components. NeuroImage 2017;152:340–347.
Figures