3097
Investigating the performance of Diffusional Kurtosis Imaging for group-wise analyses: A study from the Human Connectome Project1Image Sciences Institute, University Medical Center Utrecht and Utrecht University, Utrecht, Netherlands
Synopsis
Diffusional Kurtosis Imaging (DKI) is an extension to Diffusion Tensor Imaging (DTI), which allows the quantification of non-Gaussian water diffusion and the quantification of parameters related to microstructural changes. In this work, we used high-quality datasets from the Human Connectome Project and non-parametric statistical inference to evaluate the performance of the DKI measures for group-wise studies. To this end, we used the gender information to group the subjects and study the differences. Our results demonstrated that DKI metrics could reveal the differences more accurately compared to DTI metrics.
BACKGROUND AND PURPOSE
METHODS
Subjects:
The subjects for this study were taken from the HCP 500 subject release, out of which 410 subjects (244 females and 166 males) aged between 22 and 36 years had their full DKI data available.
Diffusion data:
We used the preprocessed multi-shell diffusion-weighted MRI data (b=1000, 2000 and 3000 s/mm2) with 90 unique gradient directions and 6 b=0 acquisitions per shell (288 volumes in total). Estimation of DKI parameters was implemented using the REKINDLE6 approach in ExploreDTI7 with constraints on kurtosis tensor8. Correction for diffusion gradient nonlinearities was performed9-11 and the gradient field tensor for each subject was used to correct the magnitude and direction of the diffusion-sensitizing gradients at each brain voxel9,10,12. DTI and DKI metrics were then calculated for each understudied subject.
Parcellation of brain regions using the FreeSurfer13 toolbox with “wmparc” atlas had already been performed by the HCP team. 179 brain regions common among all the subjects were identified in total out of which 165 regions were ultimately considered. Regions consisting of CSF (ventricles) and the right and left vessels were excluded due to huge flow and noise-related artifacts. The parcellation masks were then used to calculate the mean and standard deviation of all the DTI and DKI for each subject. The mean and standard deviation per regions were inspected to ensure that all the regions consist of normal diffusion values.
Comparison of gender differences was carried out on the mean values per region using non-parametric two-sample permutation based t-tests14,15 in Permutation Analysis of Linear Models (PALM) version alpha104 with 10000 permutations. To eliminate the nuisance effect of volume on the statistical analyses16, volume was considered as a covariate of no-interest. Tests were applied to all the 8 DTI and DKI scalars. Calculation speed was accelerated using the tail approximation17. P-values were corrected for multiple comparisons with family-wise error-rate adjustment by considering multiple contrasts and metrics15. Corrected p-values and effect sizes (Cohen’s D) were provided for every region per metric. The significance of a test was determined at corrected p-value (Pcorr) < 0.05. The effect sizes are standardized measures which quantify the strength of the group-wise differences and can be used to compare the performance of tests for different metrics.
Results
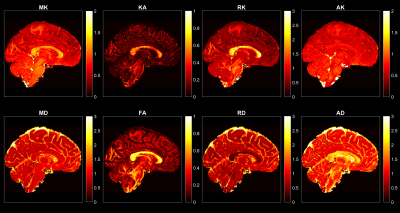
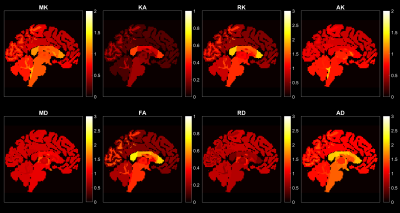
Fig.1 shows the voxel-wise scalar maps for a representative subject from the HCP dataset. Fig.2 shows the corresponding regional averages of the scalars for the same subject, which indicates the distribution of average DKI metrics for different regions.
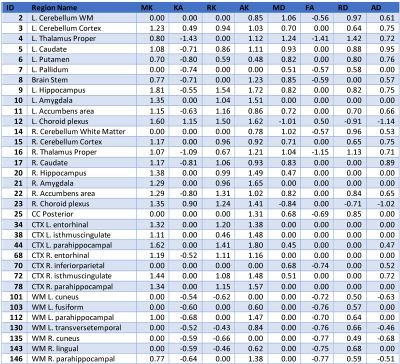
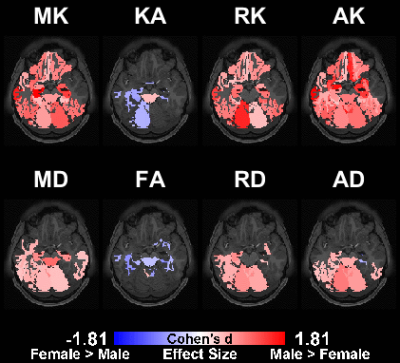
Fig.3 depicts the effect sizes for the regions with significant differences between groups. Positive and negative values indicate larger average values for male and female groups respectively.
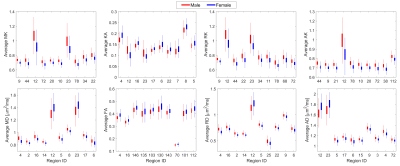
Fig.4 demonstrates the range of average values for the regions listed in Fig.3 sorted by the highest absolute effect size for each metrics. From the table in Fig.3, it can be inferred that on average the effect sizes for DKI metrics are larger than for the DTI counterparts. The values in Fig.3 also indicate that if a region is significant with a DTI metric it is also significant with a DKI metric. There are some regions for which no significant difference was shown with DTI metrics, while DKI metrics indicated a significant difference, e.g. region number 21 Right Amygdala.
Fig.5 shows the significant regions for the gender comparison for different metrics. The color of each region is scaled with the corresponding effect size for the corresponding statistical test.
Discussion and Conclusion
In this work, we used the data from the HCP with the gender information to investigate the performance of DKI for group-wise statistical analyses. Our study benefited from the high-quality data together with a fully automated parcellation technique, a high-performance processing pipeline and a robust statistical analysis method to minimize possible confounding factors. Our results demonstrated that in general DKI metrics performed better compared to DTI metrics in highlighting the group-wise differences. DKI metrics either could reveal differences which were not identified by DTI metrics or resulted in larger effect sizes compared to DTI. This can be explained by considering that DKI is a more accurate model than DTI and can result in more accurate estimates of the microstructural parameters18.Acknowledgements
This research is supported by VIDI Grant 639.072.411 from the Netherlands Organisation for Scientific Research (NWO).References
1. Jensen, J.H., Helpern, J.A., Ramani, A., Lu, H., Kaczynski, K.: ‘Diffusional kurtosis imaging: The quantification of non-gaussian water diffusion by means of magnetic resonance imaging’Magn. Reson. Med., 2005, 53, (6), pp. 1432–1440.
2. Jensen, J.H., Helpern, J.A.: ‘MRI quantification of non-Gaussian water diffusion by kurtosis analysis’NMR Biomed., 2010, 23, (7), pp. 698–710.
3. Fieremans, E., Jensen, J.H., Helpern, J.A.: ‘White matter characterization with diffusional kurtosis imaging.’Neuroimage, 2011, 58, (1), pp. 177–88.
4. Lu, H., Jensen, J.H., Ramani, A., Helpern, J.A.: ‘Three-dimensional characterization of non-gaussian water diffusion in humans using diffusion kurtosis imaging.’NMR Biomed., 2006, 19, (2), pp. 236–47.
5. Van Essen, D.C., Ugurbil, K., Auerbach, E., et al.: ‘The Human Connectome Project: A data acquisition perspective’Neuroimage, 2012, 62, (4), pp. 2222–2231.
6. Tax, C.M.W., Otte, W.M., Viergever, M.A., Dijkhuizen, R.M., Leemans, A.: ‘REKINDLE: Robust Extraction of Kurtosis INDices with Linear Estimation’Magn. Reson. Med., 2015, 73, (2), pp. 794–808.
7. Leemans, A., Jeurissen, B., Sijbers, J., Jones, D.: ‘ExploreDTI: a graphical toolbox for processing, analyzing, and visualizing diffusion MR data’Proc. 17th Sci. Meet. Int. Soc. Magn. Reson. Med., 2009, 17, (2), p. 3537.
8. Tabesh, A., Jensen, J.H., Ardekani, B.A., Helpern, J.A.: ‘Estimation of tensors and tensor-derived measures in diffusional kurtosis imaging’Magn. Reson. Med., 2011, 65, (3), pp. 823–836.
9. Mesri, H., Froeling, M., Viergever, M., Heemskerk, A., Leemans, A.: ‘Investigating the adverse effect of gradient nonuniformities on diffusion MRI measures: Do we need to worry?’, in ‘Proc. Intl. Soc. Mag. Reson. Med. 25’ (2017), p. 3534
10. Bammer, R., Markl, M., Barnett, A., et al.: ‘Analysis and generalized correction of the effect of spatial gradient field distortions in diffusion-weighted imaging’Magn. Reson. Med., 2003, 50, (3), pp. 560–569.
11. Sotiropoulos, S.N., Jbabdi, S., Xu, J., et al.: ‘Advances in diffusion MRI acquisition and processing in the Human Connectome Project’Neuroimage, 2013, 80, pp. 125–143.
12. Glasser, M.F., Sotiropoulos, S.N., Wilson, J.A., et al.: ‘The minimal preprocessing pipelines for the Human Connectome Project’Neuroimage, 2013, 80, pp. 105–124.
13. Fischl, B.: ‘FreeSurfer’Neuroimage, 2012, 62, (2), pp. 774–781.
14. Eklund, A., Nichols, T.E., Knutsson, H.: ‘Cluster failure: Why fMRI inferences for spatial extent have inflated false-positive rates’Proc. Natl. Acad. Sci., 2016, 113, (28), pp. 7900–7905.
15. Winkler, A.M., Webster, M.A., Brooks, J.C., Tracey, I., Smith, S.M., Nichols, T.E.: ‘Non-parametric combination and related permutation tests for neuroimaging’Hum. Brain Mapp., 2016, 37, (4), pp. 1486–1511.
16. Vos, S.B., Jones, D.K., Viergever, M.A., Leemans, A.: ‘Partial volume effect as a hidden covariate in DTI analyses’Neuroimage, 2011, 55, (4), pp. 1566–1576.
17. Winkler, A.M., Ridgway, G.R., Douaud, G., Nichols, T.E., Smith, S.M.: ‘Faster permutation inference in brain imaging’Neuroimage, 2016, 141, pp. 502–516.
18. Tax, C.M.W., Vos, S.B., Veraart, J., Sijbers, J., Viergever, M.A., Leemans, A.: ‘the Effect of the Kurtosis on the Accuracy of Diffusion Tensor Based Fiber Tractography’Proc. 18th Sci. Meet. Int. Soc. Magn. Reson. Med., vol. 18, pp. 8–11.
19. Hsu, J.-L., Leemans, A., Bai, C.-H., et al.: ‘Gender differences and age-related white matter changes of the human brain: A diffusion tensor imaging study’Neuroimage, 2008, 39, (2), pp. 566–577.
20. Herting, M.M., Maxwell, E.C., Irvine, C., Nagel, B.J.: ‘The Impact of Sex, Puberty, and Hormones on White Matter Microstructure in Adolescents’Cereb. Cortex, 2012, 22, (9), pp. 1979–1992.
21. Menzler, K., Belke, M., Wehrmann, E., et al.: ‘Men and women are different: Diffusion tensor imaging reveals sexual dimorphism in the microstructure of the thalamus, corpus callosum and cingulum’Neuroimage, 2011, 54, (4), pp. 2557–2562.
22. Kanaan, R.A., Allin, M., Picchioni, M., et al.: ‘Gender Differences in White Matter Microstructure’PLoS One, 2012, 7, (6), p. e38272.
23. Ingalhalikar, M., Smith, A., Parker, D., et al.: ‘Sex differences in the structural connectome of the human brain.’Proc. Natl. Acad. Sci. U. S. A., 2014, 111, (2), pp. 823–8.
Figures
