3094
The neurosurgical implication of scanner, gradient performance and acquisition protocol on Meyer’s loop reconstruction1CUBRIC, Cardiff University, Cardiff, United Kingdom
Synopsis
The optic radiation (OR) is a key brain fiber bundle of the visual system which must be spared as much as possible during resection of the temporal lobe in epilepsy surgery to prevent visual field defects. Therefore, it is of utmost importance to avoid underestimating its anterior location (Meyer’s loop) with diffusion MRI tractography. For this reason, it is critical that this part of the OR is reconstructed as accurately as possible. In this abstract, we demonstrate that standard diffusion MRI acquisitions potentially underestimate the true location of Meyer’s loop, when compared to state-of-the-art protocols.
Introduction
The optic radiation (OR) is a white matter (WM) pathway of utmost importance, responsible for transmitting visual information. From a neurosurgical perspective, it behooves us to pay particular attention to its 3D reconstruction in order to reduce the risk of inducing visual field deficits. Of particular importance is Meyer’s loop (ML) – a section of the OR that projects most anteriorly, with a sharp backwards vend that makes it challenging for tractography[1]. Achieving a complete and accurate ML reconstruction is critical to avoid neurosurgical complications. To this end, diffusion MRI data were acquired using a cohort of 13 subjects on 3 different scanners using various protocols. In direct side-by-side comparison, we show that state-of-the-art (SA) protocols comprising higher spatial and angular resolution, as well as higher number of diffusion shells, and on top end equipment, provide a larger anterior extent of ML when compared to more standard (ST) acquisitions.Methods
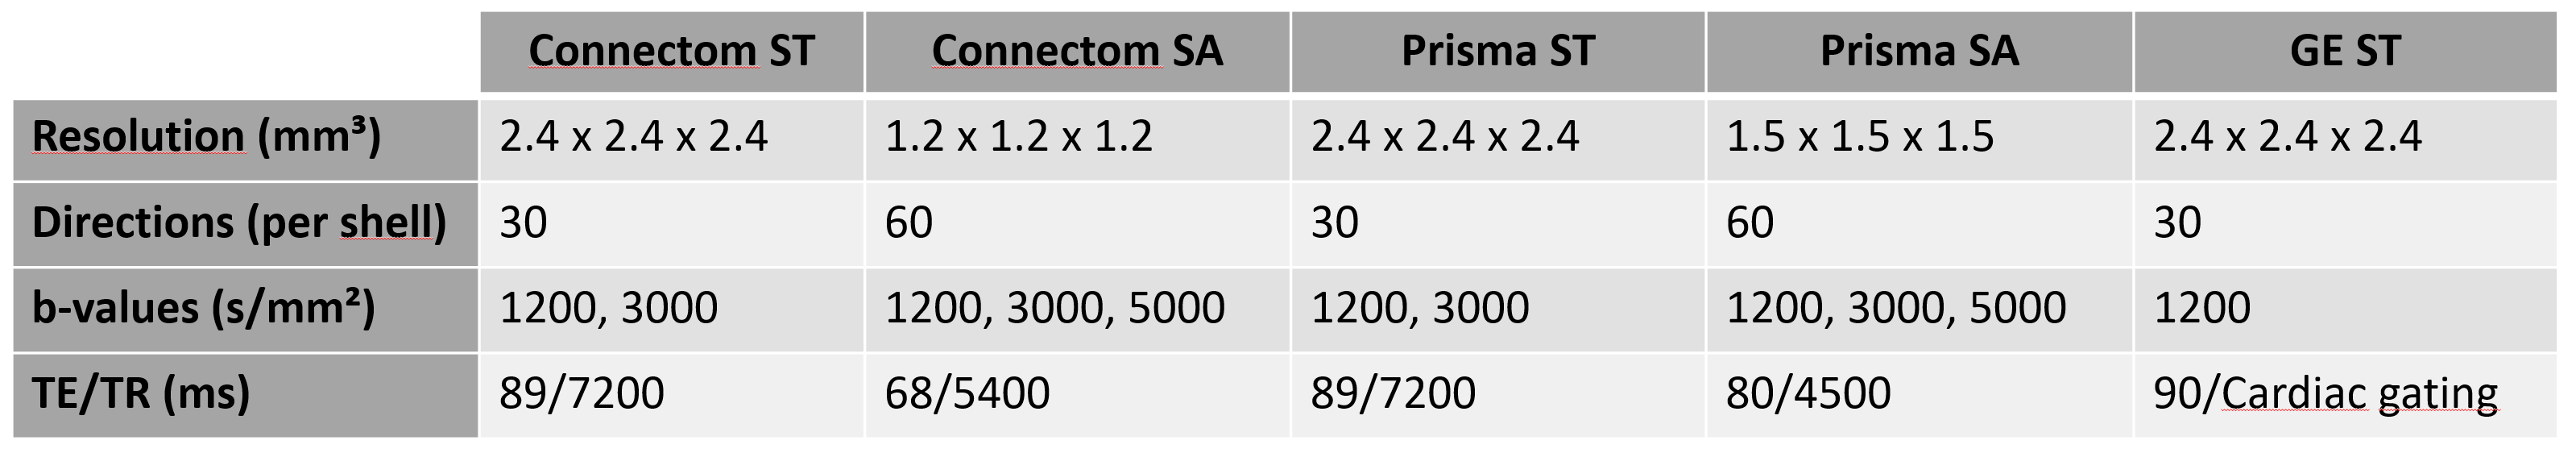
Acquisition and processing: The same 13 participants were scanned on 3 different 3T scanners (Siemens Connectom, Siemens Prisma and GE Excite HDx) using ST and SA protocols (Fig. 1). Eddy current distortion- and motion correction was performed using EDDY[2]. EPI distortions were corrected using TOPUP[3] for the Connectom and Prisma data. Connectom data were additionally corrected for gradient non-linearity. All data were then upsampled to 1 × 1 × 1 mm³ and affinely (Connectom, Prisma) or non-linearly (GE) aligned between scanners using ANTs[4] (driven by the mean b=0 and 1200 s/mm² images) and appropriate B-matrix rotation. Next, fiber orientation distributions functions[5] (fODFs) were derived using multi-shell multi-tissue constrained spherical deconvolution[6] (MSMT-CSD). For the GE data, free-water elimination was performed by only supplying the WM and cerebro-spinal fluid response functions to the MSMT-CSD algorithm[7].
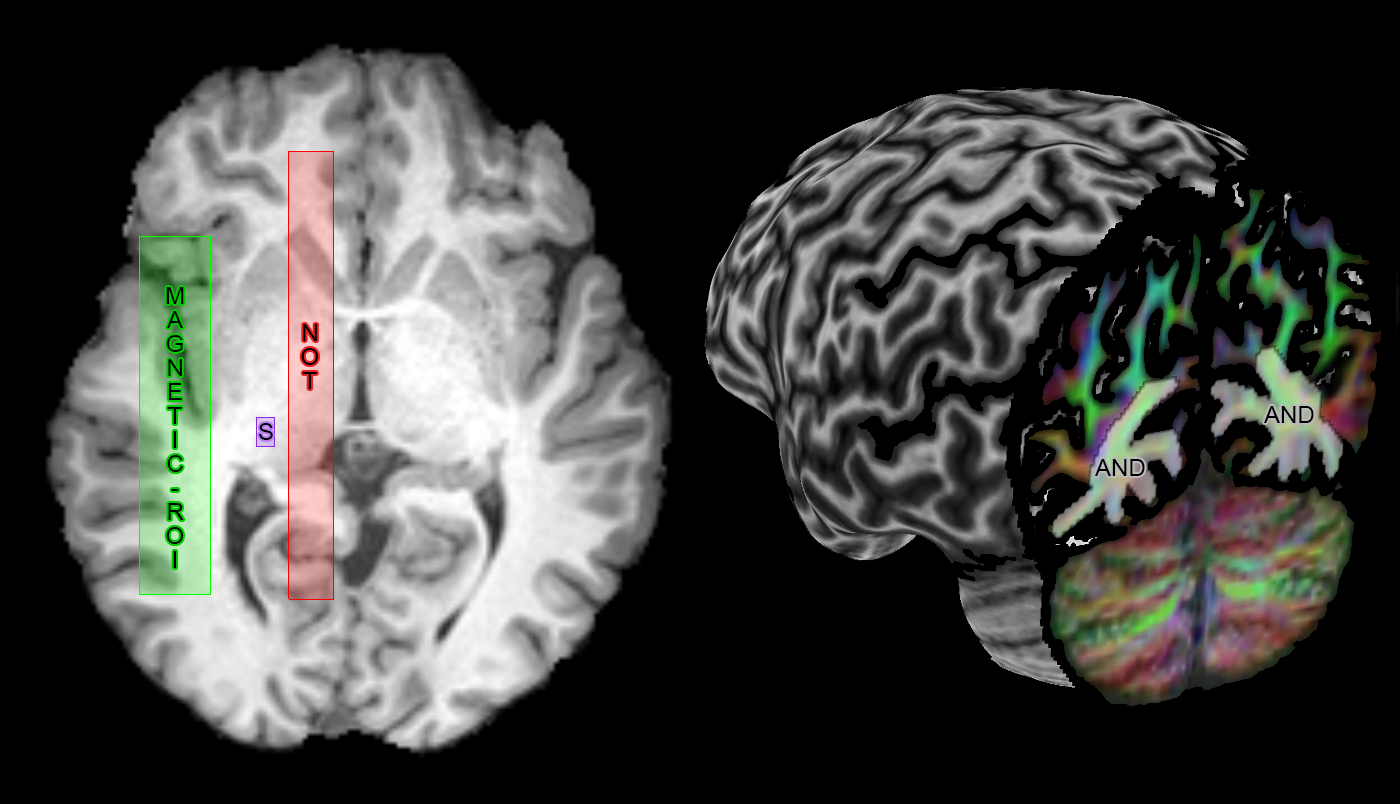
Meyer’s loop (ML) tractography: Resulting fODF peaks (thresholded at amplitudes ≥ 0.1) were used for real-time tractography using MAGNET[1] with default parameters. ROI positioning is described in Fig. 2 and resulting streamlines were quality controlled for all subjects, ensuring that no spurious streamline remained. Next, the distance to temporal pole (ML-TP) was measured using an axial projection of the most anterior part of ML. This distance was then head-size normalized using the most posterior point of the occipital pole ((ML-TP)/(TP-OP)·100%), allowing for group comparisons.
Statistical analysis: A one-way ANOVA was conducted to compare the effect of scanning protocol on the normalized ML-TP distance. Post-hoc results were corrected for multiple comparisons using the Bonferroni-Holm test.
Results
A single subject tractography-derived optic radiation is illustrated in Fig. 3, showing the ML-TP relation across all protocols. At the group level, a significant effect of scanning protocol on reconstructed ML-TP distance was found at the p < 0.05 level for both left [F(4, 60) = 25.05, p = 3.17E-12] and right hemispheres [F(4, 60) = 18.46, p = 6.16E-10]. Fig. 4 shows that i) the mean measurements of ConnectomSA and PrismaSA were significantly different than the GEST (p < 0.0001); ii) both ConnectomST and PrismaST protocols showed significant difference with GEST (p < 0.01 and 0.001). Additionally, both SA reconstructions showed significant differences over all ST reconstructions, with the exception of the right hemisphere’s Prisma SA and ST (p = 0.02) (Fig. 4). These findings are also supported by the spatial localization of SA-derived MLs across subjects and protocols, as shown in Fig. 5 (red-yellow).Discussion & Conclusions
Taken together, we showed that the choice of acquisition protocol (where exactly the same tractography parameters are used) does have an effect on ML reconstruction. Specifically, acquiring a higher spatial and angular resolution[8] with more shells gives rise to a larger anterior delineation of ML. A possible explanation is that the reconstructed fODF directions better reflect the course of the pathway, allowing for the tracking algorithm to propagate on. This has important applications in temporal lobe resection surgery where surgeons may transect part of ML due to an under-estimation of its location; that is assuming that SA reconstructions inferred from tractography do reflect ML’s true location. In conclusion, the reconstruction of ML, and thus the possible surgical outcome for the patient, will be dependent on the hardware and protocol that is available in the hospital. In the absence of widespread accessibility to SA hardware and acquisition protocols, latest advances in image quality transfer[9] may be considered.Acknowledgements
The authors would like to thank funding from the Wellcome Trust and the Natural Sciences and Engineering Research Council of Canada Postdoctoral Fellowships Program, in addition to Dr. Kevin Murphy for his useful comments.References
[1] Chamberland, Maxime, et al. "Active delineation of Meyer's loop using oriented priors through MAGNEtic tractography (MAGNET)." Human brain mapping 38.1 (2017): 509-527.
[2] Andersson, Jesper LR, and Stamatios N. Sotiropoulos. "An integrated approach to correction for off-resonance effects and subject movement in diffusion MR imaging." Neuroimage 125 (2016): 1063-1078.
[3] Andersson, Jesper LR, Stefan Skare, and John Ashburner. "How to correct susceptibility distortions in spin-echo echo-planar images: application to diffusion tensor imaging." Neuroimage 20.2 (2003): 870-888.
[4] Avants, Brian B., et al. "A reproducible evaluation of ANTs similarity metric performance in brain image registration." Neuroimage 54.3 (2011): 2033-2044.
[5] Tournier, J-Donald, Fernando Calamante, and Alan Connelly. "Robust determination of the fibre orientation distribution in diffusion MRI: non-negativity constrained super-resolved spherical deconvolution." Neuroimage 35.4 (2007): 1459-1472.
[6] Jeurissen, Ben, et al. "Multi-tissue constrained spherical deconvolution for improved analysis of multi-shell diffusion MRI data." NeuroImage 103 (2014): 411-426.
[7] Tournier, J., Fernando Calamante, and Alan Connelly. "MRtrix: diffusion tractography in crossing fiber regions." International Journal of Imaging Systems and Technology 22.1 (2012): 53-66.
[8] Vos, Sjoerd B., et al. "Trade-off between angular and spatial resolutions in in vivo fiber tractography." NeuroImage 129 (2016): 117-132.
[9] Alexander, D. C., et al. "Image quality transfer via random forest regression: applications in diffusion MRI." International Conference on Medical Image Computing and Computer-Assisted Intervention. Springer, Cham, 2014.
[10] Calamante, F., et al. "Track-density imaging (TDI): super-resolution white matter imaging using whole-brain track-density mapping." Neuroimage 53.4 (2010): 1233-1243.
Figures
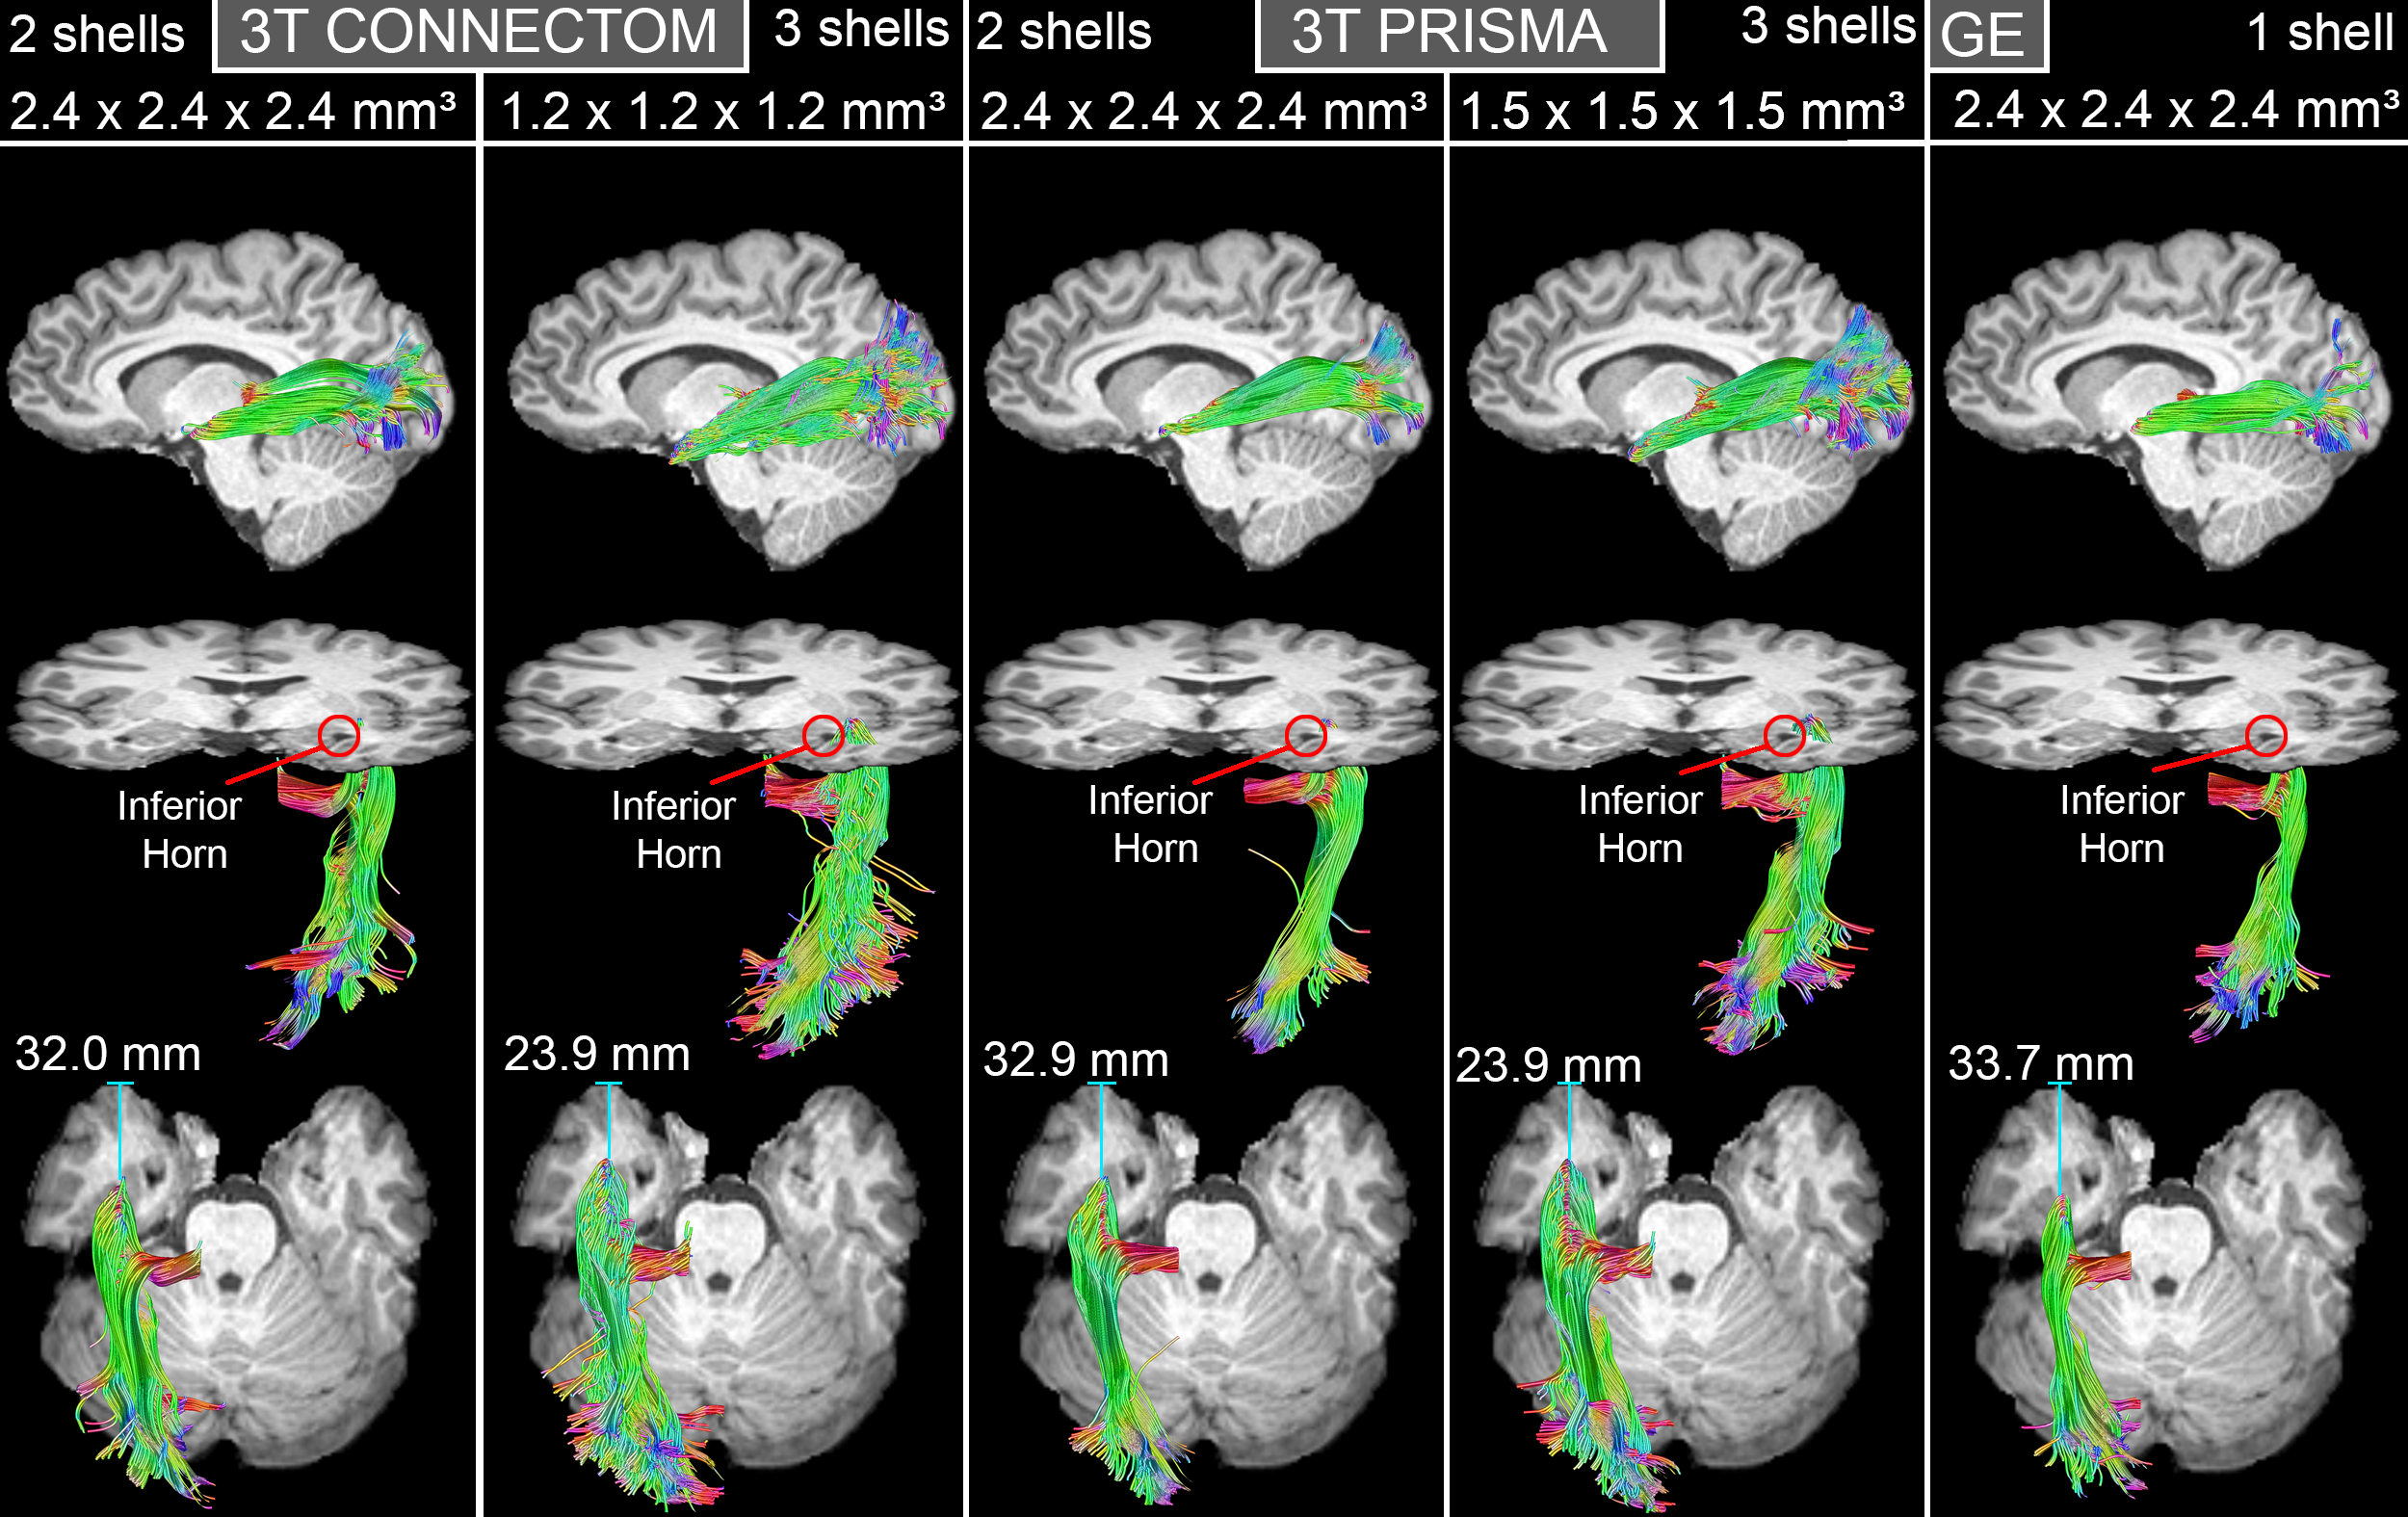
Top: Lateral view of ML reconstructions for one subject across all protocols.
Middle: Inferior oblique view showing the relation between ML and the inferior horn of the lateral ventricle.
Bottom: ML-TP measurements (blue line) shows larger anterior extent for SA acquisitions.
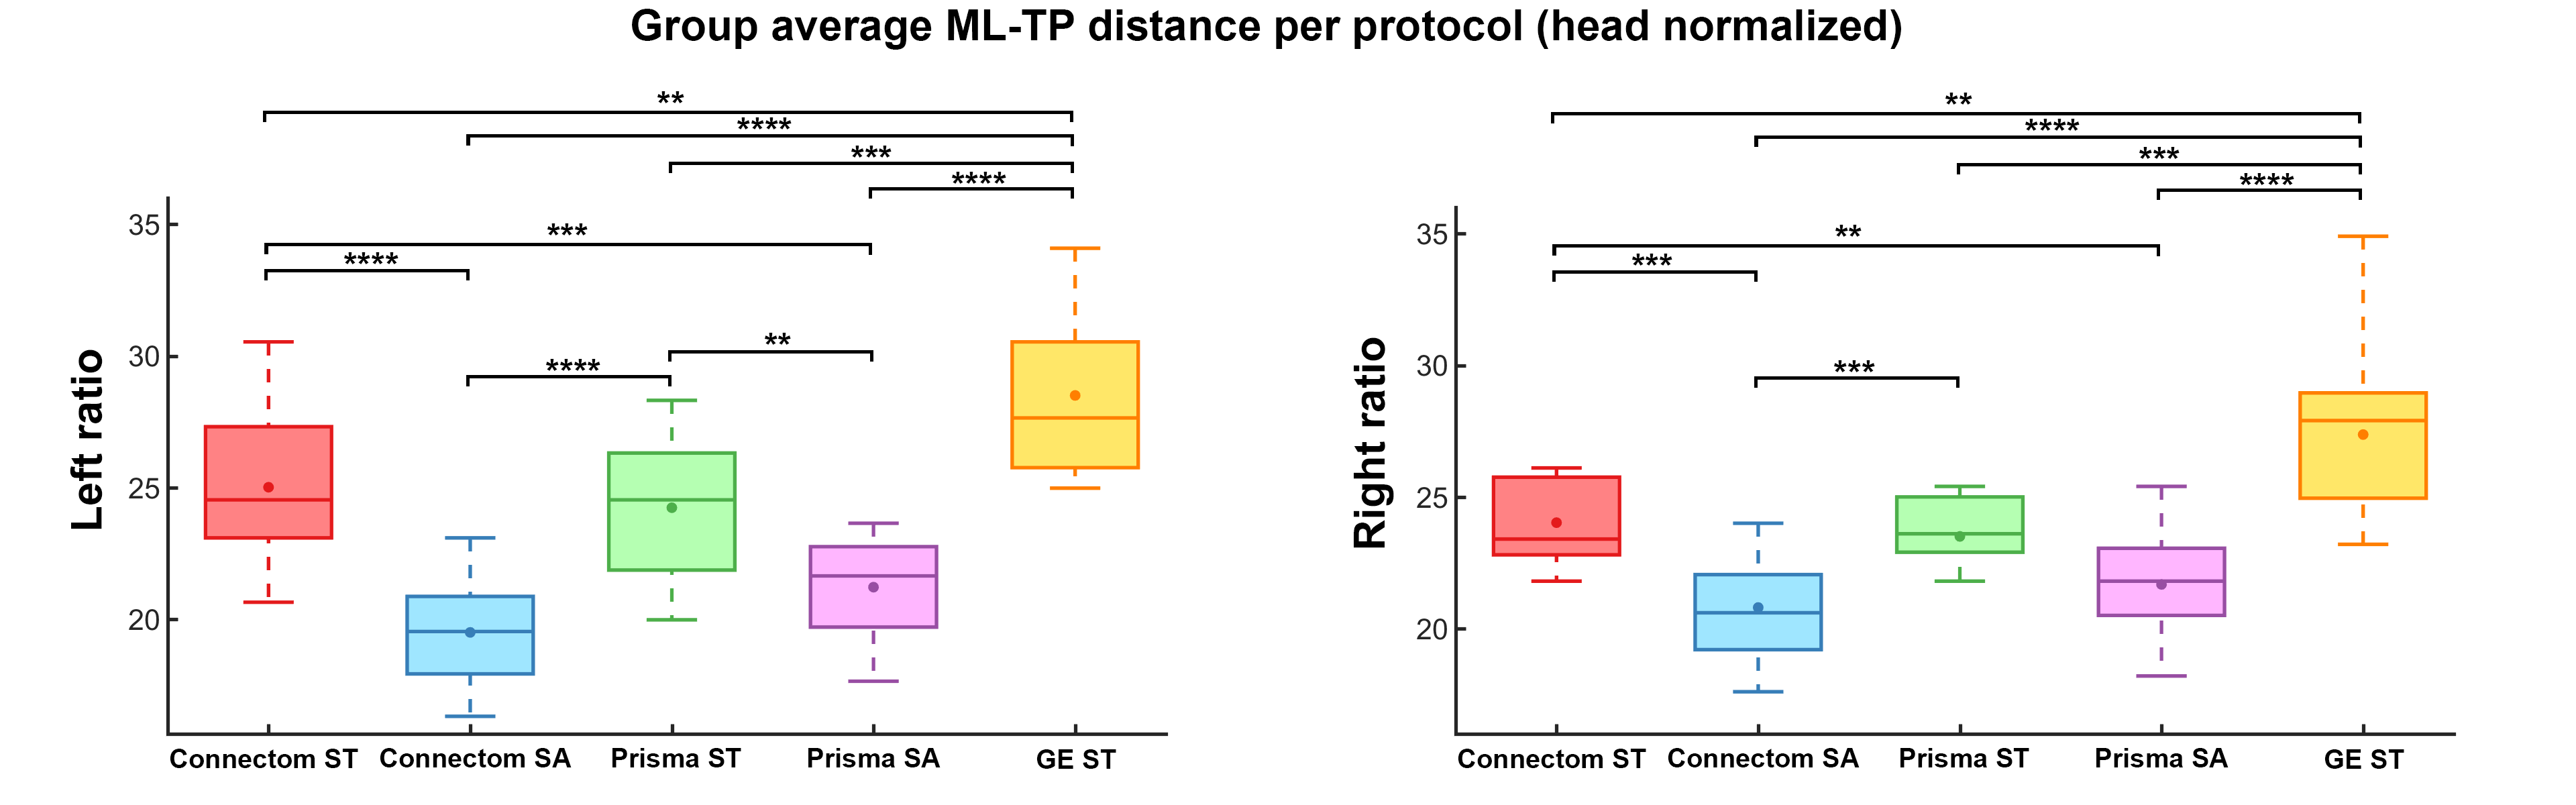
**: p < 0.01 ***: p < 0.001 ****: p < 0.0001 (Bonferroni corrected)
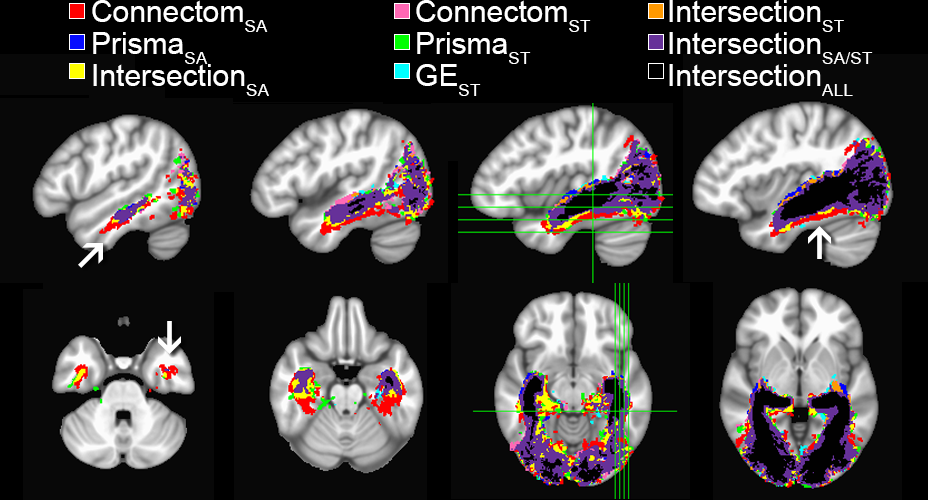
Spatial extent of the optic radiation illustrated using per-scanner
group average track-density imaging[10] maps (thresholded at
95%).
Binary color coding was apply to distinguish voxels where 2 or more protocols overlapped.
One can observe that Connectom SA (red)
shows a larger ML
spatial extent at
the anterior and
ventral aspects of the bundle (arrows).