3093
Wired for music? – a diffusion MRI based study of normative music perception skills1Language,Literacy and Music lab, National Brain Research Centre, Gurgaon, India, 2Department of Electronics and TeleCommunication, Symbiosis Institute of Technology, Symbiosis International University, Pune, India, 3International Laboratory for Brain, Music and Sound (BRAMS), University of Montreal, Montreal, QC, Canada, 4UNESCO Mahatma Gandhi Institute of Education for Peace and Sustainable Development (MGIEP), New Delhi, India
Synopsis
White matter micro-structural correlates of music perception skills have only been studied in expert musicians, although skills can be independent of musical training. We assessed normative variation of music perception skills in adult population by the PROMS-S musicality test. A tract based spatial statistic on high angular diffusion data revealed negative associations between Mode of Anisotropy and d’ measures of total scores, sub-scores of Accent, Embedded Rhythms and Tempo in the Corpus Callosum extending to Corona Radiata. Partial volumes of secondary fiber population also correlated positively to these scores, suggesting the recruitment of inter-hemispheric connections necessary for enhanced music perception.
Introduction
Music is an important social, emotional and communicative stimulus. While much is known about how musical training influences brain structure and organization, past studies have primarily compared musicians with non-musicians. As a consequence, individual differences associated with music perception abilities, without the influence of musical training are not very well understood. Recently, white matter organization has emerged as a sensitive marker for subtle differences in behavior. The objective of this study was to study the normative variation of different musical perception skills in an adult population (N=29) with varying degrees of musical training, and their subsequent correlation with white matter organization.Methods
Twenty-nine adult participants (16 male, age 24.7y ± 3.66) completed the Profile of Music Perception Skills -Short form (PROMS-S)1.The PROMS-S is a test of music perception skills across multiple dimensions such as Melody, Pitch Rhythm, Tempo, Timbre and Tuning2. Performance on the PROMS-S is measured using d-prime (d’) scores.
Participants also completed high angular resolution diffusion imaging (HARDI) scans (64 directions with b=2000s/mm2 and one b=0 image) on a 3T Philips Achieva scanner with a 8-channel head coil. Diffusion images were preprocessed using standard FSL’s tools3-5 and included eddy current correction by registering to the b0 volume, brain extraction4 and fitting a diffusion tensor 5 We used a multi-metric approach using tract-based spatial statistics (TBSS)6 to calculate whole-brain diffusion maps of MD (Mean Diffusivity), AD (Axial Diffusivity), RD (Radial Diffusivity), FA (Fractional Anisotropy) and MO (Mode of Anisotropy). In order to investigate the relation between musical perception abilities and microstructural properties of various white matter tracts, 5 general linear models were used with total d’ scores as the independent variable and age as a nuisance variable and each of MD, RD, AD, FA and MO as dependent variables. Additionally, a crossing fiber model7 was also fitted to the diffusion data in the statistically significant regions to attain deeper insights into the fiber integrity in these regions. Non-parametric permutation statistics (5000 permutations) with threshold-free cluster enhancement (TFCE) was performed for all the voxel-wise analyses. Results were considered significant at p<0.05, TFCE-corrected for multiple comparisons.
Results
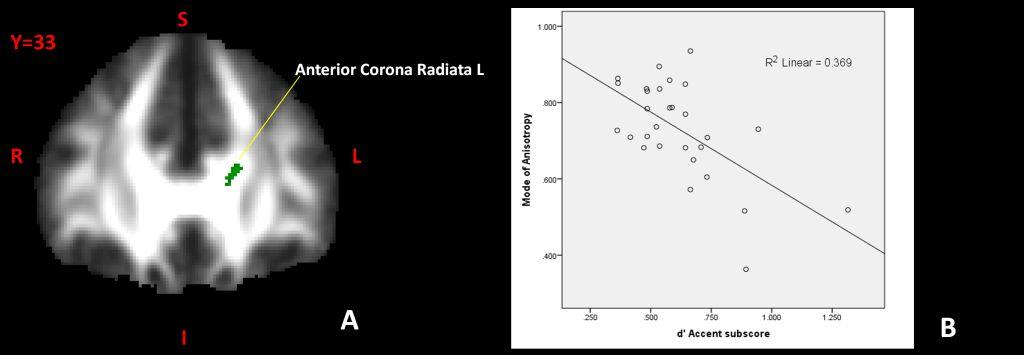
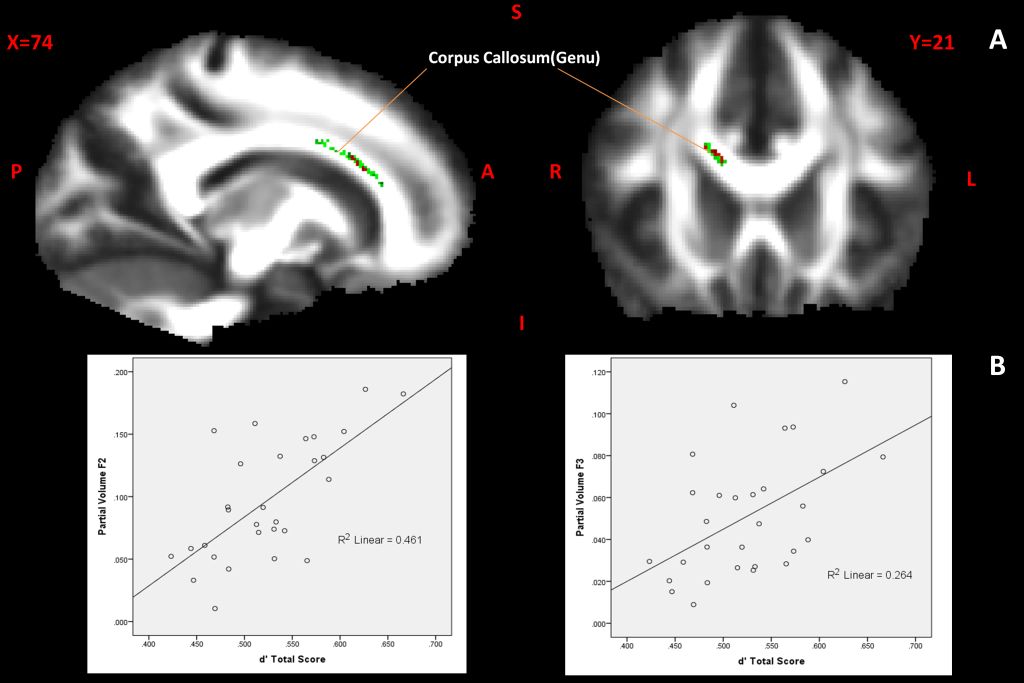
PROMS-S total d’ scores did not show significant correlations with FA, MD, RD or AD maps. However, MO was negatively correlated with the total d’ scores in the genu and body of the corpus callosum extending to anterior parts of the right corona radiata (p<0.05, TFCE-corrected, Figure 1). Subsequent voxelwise regressions revealed that musical features like Accent, Embedded rhythm and Tempo (p<0.05, TFCE corrected) showed significant associations with MO (Figures 2,3,4). However, no significant associations were observed in Pitch, Melody, Rhythm, Tuning or Timbre. The crossing fibers analysis revealed a positive correlation for partial volumes of secondary fiber populations (F2 and F3 at p<.05, TFCE corrected, Figure5) with the total d’ scores.Discussion
This study examined, for the first time, the association between music perception, and white matter microstructure in a diverse population of individuals with varying musical ability. PROMS-S d’ scores significantly correlated with mode of anisotropy (which determines if diffusion is planar or linear), in commissural tracts like corpus callosum extending to the corona radiata. This suggests that complex white matter architecture, such as crossing fibers, maybe associated with increased music perception abilities. Further analysis of the crossing fibers (F2 and F3) reinforced the MO findings, and illustrated higher crossing fiber population with better musical perception. Since past studies8,9,10 comparing musicians and non-musicians have also shown a convergent evidence in these tracts, we speculate that the increased inter-hemispheric pathways connecting the auditory and motor areas might be essential for enhanced music perception, particularly in the temporal domain and may reflect individual differences in musical capacity with or without training.Acknowledgements
No acknowledgement found.References
1. Law, L. N. C., & Zentner, M. (2012). Assessing Musical Abilities Objectively : Construction and Validation of the Profile of Music Perception Skills, 7(12). http://doi.org/10.1371/journal.pone.0052508
2. Zentner, M., & Strauss, H. (2017). Assessing musical ability quickly and objectively : development and validation of the Short-PROMS and the Mini-PROMS, 1400, 33–45. http://doi.org/10.1111/nyas.13410
3. Smith, S. M. (2002). Fast robust automated brain extraction. Human Brain Mapping, 17(3), 143–155. http://doi.org/10.1002/hbm.10062
4. Andersson, J. L. R., Jenkinson, M., & Smith, S. (2007). Non-linear registration aka Spatial normalisation FMRIB Technical Report TR07JA2. In Practice, (June), 22. Retrieved from http://fmrib.medsci.ox.ac.uk/analysis/techrep/tr07ja2/tr07ja2.pdf
5. FMRIB’s Diffusion Toolbox: https://fsl.fmrib.ox.ac.uk/fsl/fslwiki/FDT
6. Smith, S. M., Jenkinson, M., Johansen-Berg, H., Rueckert, D., Nichols, T. E., Mackay, C. E., Behrens, T. E. J. (2006). Tract-based spatial statistics: voxelwise analysis of multi-subject diffusion data. NeuroImage, 31(4), 1487–505. http://doi.org/10.1016/j.neuroimage.2006.02.024
7. Jbabdi, S., Behrens, T. E. J., & Smith, S. M. (2010). Crossing fibres in tract-based spatial statistics. NeuroImage, 49(1), 249–256. http://doi.org/10.1016/j.neuroimage.2009.08.039
8. Schlaug, G., Jäncke, L., Huang, Y., Staiger, J.F., &Steinmetz, H. (1995). Increased corpus callosum size in musicians. Neuropsychologia, 33, 1047–1055.
9. Penhune, V.B. (2011). Sensitive periods in human development: Evidence from musical training. Cortex, 47, 1126–1137
10. Hyde, K.L., Lerch, J., Norton, A., Forgeard, M., Winner, E., Evans, A.C., & Schlaug, G. (2009). Musical training shapes structural brain development. J. Neurosci., 29, 3019–3025.
Figures
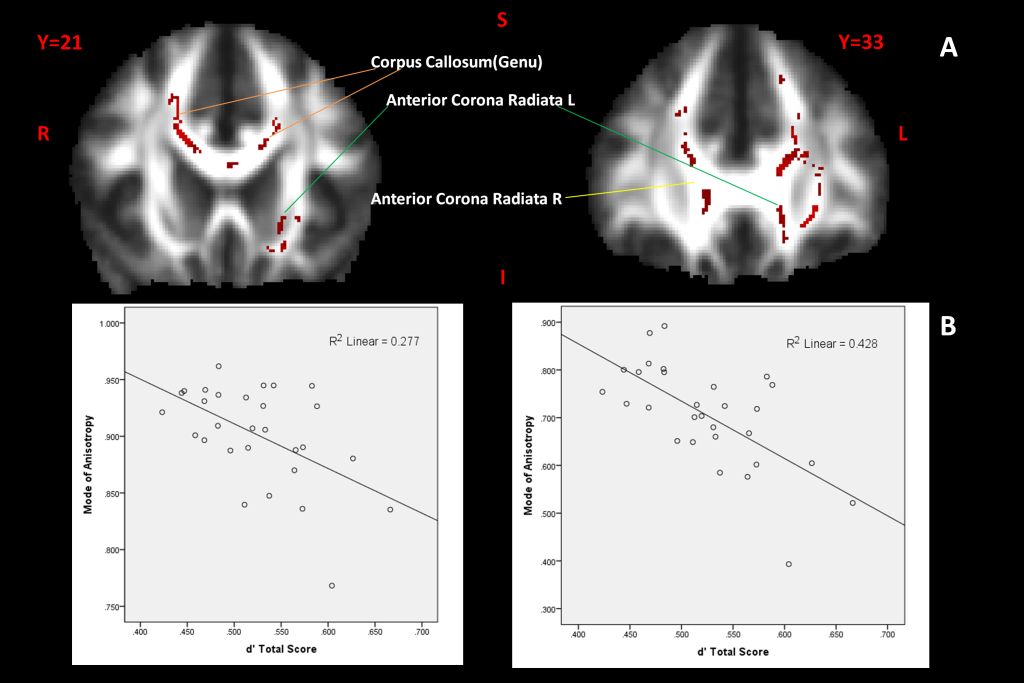
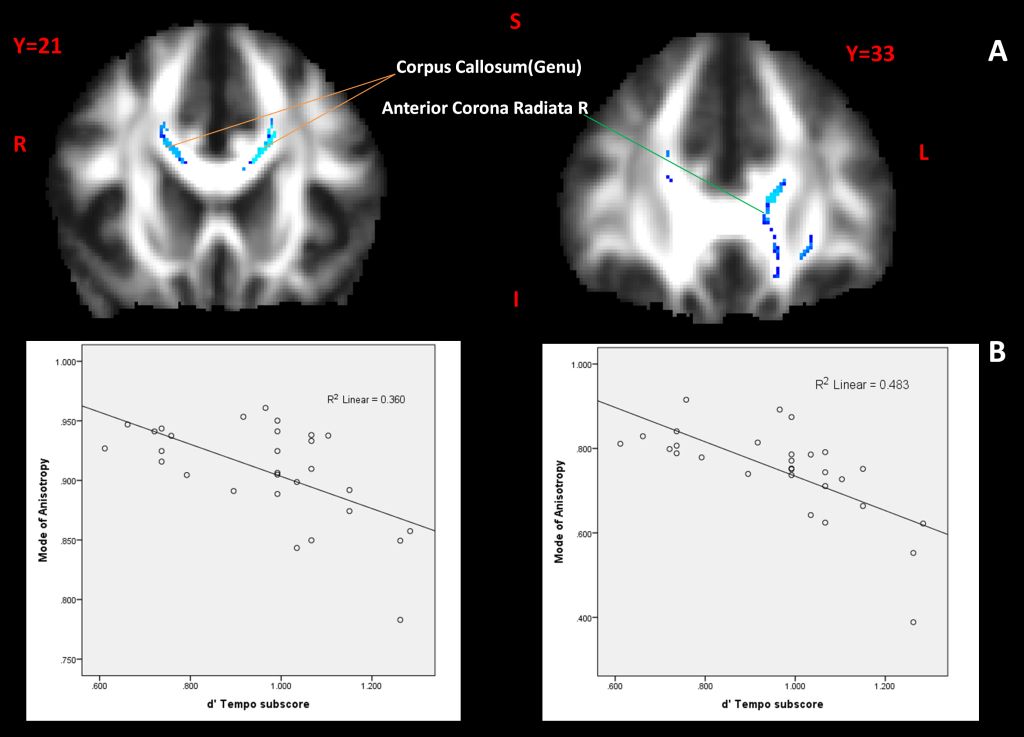
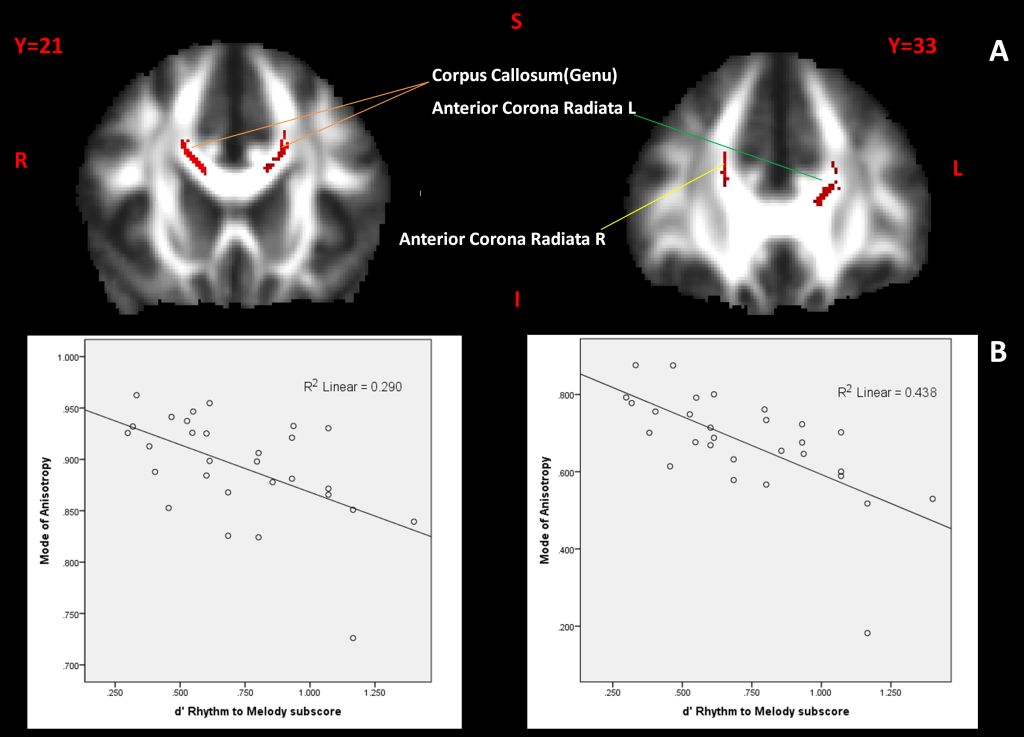
Figure 3 A. TBSS Analysis
of MO with d’ Rhythm to Melody (Embedded Rhythms) sub-score in a limited search region. The
results of sub-scores for Tempo (P<0.05, TFCE corrected,1-P value maps in
Red) are shown on two coronal slices (Y=33,21).The significant clusters were
overlaid on the mean FA image in MNI space. B. Scatter plots between the d’ sub-score and MO in these tracts.