3092
Diffusion MRI as an imaging marker of depression from a large and homogenous population study1Univ Rennes, Inria, CNRS, Inserm, IRISA UMR 6074, VISAGES ERL U-1228, F-35000, Rennes, France, 2Academic Psychiatry Department, Centre Hospitalier Guillaume Régnier, Rennes, France, 3EA 4712 Behavior and Basal Ganglia, CHU Rennes, Rennes 1 University, Rennes, France, Metropolitan, 4Department of Neuroradiology, University Hospital of Rennes, Rennes, France, 52 EA 4712 Behavior and Basal Ganglia, CHU Rennes, Rennes, France
Synopsis
Despite the extensive therapy options available for depression, up to 80% of patients will suffer from a relapse. Consequently, understanding the neural correlates underlying the depression will optimize the diagnosis and treatment of individual depressed patients. The purpose of our study was to investigate alterations of white matter integrity in a large cohort of patients suffering from depression using diffusion tensor imaging. Our findings provide robust evidence that the reduction of white-matter integrity in the interhemispheric connections and fronto-limbic neuronal circuits may play an important role in depression pathogenesis.
Introduction
The mood depressive disorder (MDD) is a common chronically psychiatric disorder with an estimated lifetime prevalence reported to range from 10% to 15% worldwide. This disease is characterized by an intense dysregulation of affect and mood as well as additional abnormalities including cognitive dysfunction, insomnia, fatigue and appetite disturbance. Despite the extensive therapy options available for depression, up to 80% of patients will suffer from a relapse1. Consequently, exhibiting imaging biomarkers of this disease will support both a better understanding of the neural correlates underlying the depression, and a better diagnosis and treatment of individual depressed patients.
Previous studies of structural and functional magnetic resonance imaging have reported several microstructural abnormalities in the prefrontal cortex, anterior cingulate cortex, hippocampus and thalamus2. These observations suggest a dysfunction of the circuits connecting frontal and subcortical brain regions, leading to a "disconnection syndrome"3. Given the small sample size used in the past studies, we proposed a more robust analysis using a larger cohort of patients suffering from depression. We aimed to investigate alterations of white matter integrity using a voxel-based analysis based on fractional anisotropy (FA) and the apparent diffusion coefficient (ADC) in patients with depression.
Material and Methods
LONGIDEP is a routine care cohort of patients suffering from mood depressive disorder who underwent a clinical evaluation, neuropsychological testing and brain MRI. The population sample consists of 125 patients suffering from depression and 65 healthy age and gender-matched, control subjects. A composite measure of medication load for each patient was assessed using a previously established method4.
T1-weighted and diffusion tensor imaging (DTI) were acquired on a 3T Siemens Verio scanner with a 32-channel head coil. The diffusion scans were obtained in 30 directions using an EPI sequence with a b-value of 1000s/mm2. The DTI data were processed with the open source medical image processing toolbox Anima5. All the diffusion images underwent (1) eddy current distortion correction, (2) blockwise non-local means filtering and (3) skull stripping followed by (4) a voxel-wise calculation of FA and ADC. We normalized all of the b = 0 images to the standard Montreal Neurological Institute (MNI) space to estimate the normalization parameters using nonlinear registration6. Then, we applied these parameters to the FA and ADC maps to normalize them to the MNI space. All maps derived from the DTI images of the MDD and control groups were compared by Student’s t-test, with age, gender, duration of disease and medication load as nuisance covariates. The results were corrected for multiple comparisons using FDR correction.
Results
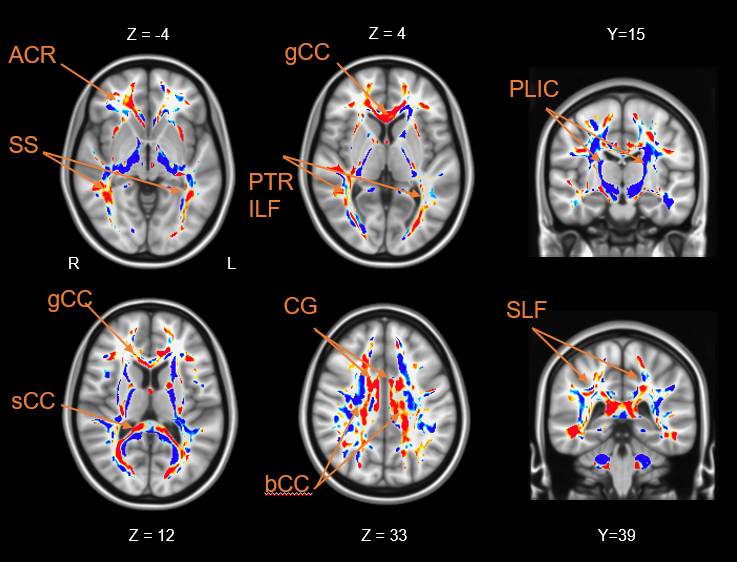
Results of the FA and ADC analysis comparing MDD and CTL subjects are shown in Figures 1 and 2. FA was significantly lower in MDD patient (p<0.05) than in controls in the anterior corona radiata, the sagittal stratum, the corpus callosum, the posterior thalamic radiation, the inferior longitudinal fasciculus, the cingulum and the superior longitudinal fasciculus. Relative to the widespread pattern of FA reduction, ADC abnormalities follow a more restricted distribution, as displayed in Figure 2. As shown in Figure 1, there was only one brain white matter tract (the posterior limb of the internal capsule) with FA increase and ADC decrease in MDD relative to healthy controls.Discussion
This is the first study analyzing diffusion metrics in such a large and homogeneous depression cohort. We observed widespread white matter abnormalities in patients with MDD. As previously reported in many studies, FA reductions were observed in the genu of the corpus callosum (CC) extending to the body of the CC and left anterior limb of the internal capsule in MDD patients relative to healthy controls. However, this analysis also revealed other patterns with decreased FA and increased ADC values in the anterior corona radiata, the sagittal stratum, the posterior thalamic radiation and the cingulum, in patients with depression.
These findings in this large MDD cohort contrast with the previous results obtained with small and heterogeneous samples of patients suffering from depression. Our analysis also revealed increased FA in the bilateral posterior limbs of the internal capsule in patients with depression. Although the changes in FA and MD had a similar spatial distribution (see Figures 2 and 3), FA distribution is more widespread than the one of ADC. However, FA characterizes the shape of the diffusion tensor, while the ADC is an anisotropic measure of the mean diffusivity; therefore, FA is more likely to capture microstructure-induced diffusion differences than ADC7.
Our findings provide robust evidence that the reduction of white-matter integrity in the interhemispheric connections and fronto-limbic neuronal circuits may play an important role in MDD pathogenesis. These results are consistent with an overall hypothesis that depression involves a disconnection of prefrontal, striatal, and limbic emotional areas.
Acknowledgements
Julie Coloigner was supported by INCR fellowship.
MRI data acquisition was supported by the Neurinfo MRI research facility from the University of Rennes I. Neurinfo is granted by the the European Union (FEDER), the French State, the Brittany Council, Rennes Metropole, Inria, Inserm and the University Hospital of Rennes.
References
1. Gotlib, I. H., & Hamilton, J. P. (2008). Neuroimaging and depression: current status and unresolved issues. Current Directions in Psychological Science, 17(2), 159-163.
2. Drevets, W. C. (2001). Neuroimaging and neuropathological studies of depression: implications for the cognitive-emotional features of mood disorders. Current opinion in neurobiology, 11(2), 240-249.
3. Liao, Y., Huang, X., Wu, Q., Yang, C., Kuang, W., Du, M., ... & Gong, Q. (2013). Is depression a disconnection syndrome? Meta-analysis of diffusion tensor imaging studies in patients with MDD. Journal of psychiatry & neuroscience: JPN, 38(1), 49.
4. Sackeim, H. A. (2001). Functional brain circuits in major depression and remission. Archives of General Psychiatry, 58(7), 649-650.
5. ANIMA: open-source software for medical image processing, https://github.com/Inria-Visages/Anima-Public/wiki.
6. Commowick, O., Wiest-Daesslé, N., & Prima, S. (2012). Automated diffeomorphic registration of anatomical structures with rigid parts: Application to dynamic cervical MRI. Medical Image Computing and Computer-Assisted Intervention–MICCAI 2012, 163-170.
7. Westin, C. F., Maier, S. E., Mamata, H., Nabavi, A., Jolesz, F. A., & Kikinis, R. (2002). Processing and visualization for diffusion tensor MRI. Medical image analysis, 6(2), 93-108.
Figures