3091
Predicting treatment outcome of schizophrenia based on white matter tract integrity using a support vector classifier1School of Medicine, National Taiwan University College of Medicine, Taipei, Taiwan, 2Institute of Medical Device and Imaging, National Taiwan University College of Medicine, Taipei, Taiwan, 3Department of Radiology, Wei Gong Memorial Hospital, Miaoli, Taiwan, 4Graduate Institute of Brain and Mind Sciences, National Taiwan University College of Medicine, Taipei, Taiwan, 5Department of Medical Imaging, National Taiwan University Hospital, Taipei, Taiwan, 6Molecular Imaging Center, National Taiwan University, Taipei, Taiwan
Synopsis
Although white matter tract microstructure has been implicated in treatment outcome of schizophrenia, its predictive capability on first-episode patients remains unknown. In the study, diffusion spectrum imaging (DSI) data were acquired from both chronic and first-episode patients, reconstructed by mean apparent propagator (MAP) MRI and analyzed with tract-based automatic analysis (TBAA). Stepwise statistical analysis was then performed to identify specific segments of white matter tracts that were significantly different between remitted and non-remitted chronic patients. We built a support vector classifier on the preprocessed data matrix. The resulting model yielded fair validation and test accuracy on chronic and first-episode patients, respectively.
Introduction
Schizophrenia has been an economic and social burden in developed countries.1 In view of the lack of reliable biomarkers for schizophrenia, this study proposed to use white matter tract integrity derived from diffusion spectrum imaging (DSI) as an imaging biomarker to predict treatment outcome of antipsychotics. From DSI data, mean apparent propagator (MAP) MRI was used to reconstruct a variety of diffusion indices which indicate different aspects of white matter microstructure.2 We hypothesized that there were significant differences in the white matter tract integrity between remitted and non-remitted patients, and that the differences alone can be a clinical biomarker for predicting treatment outcome using machine learning techniques.Methods
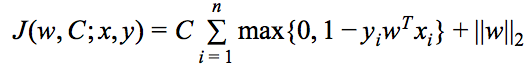
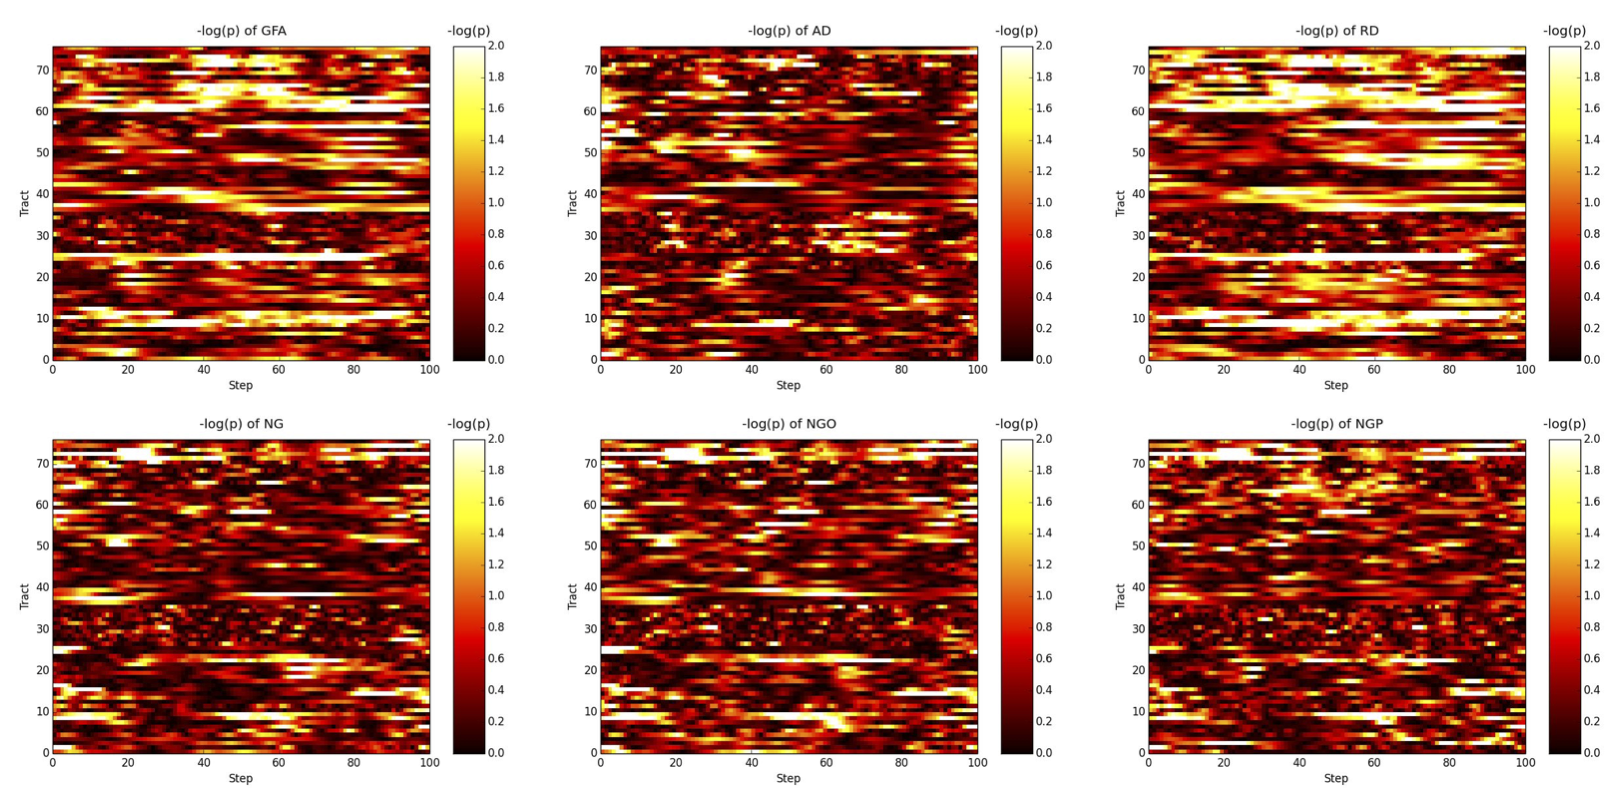
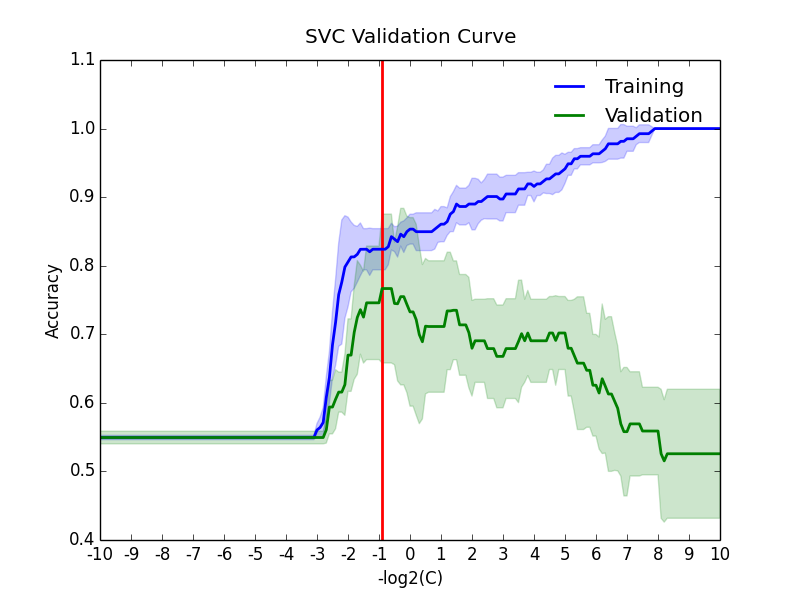
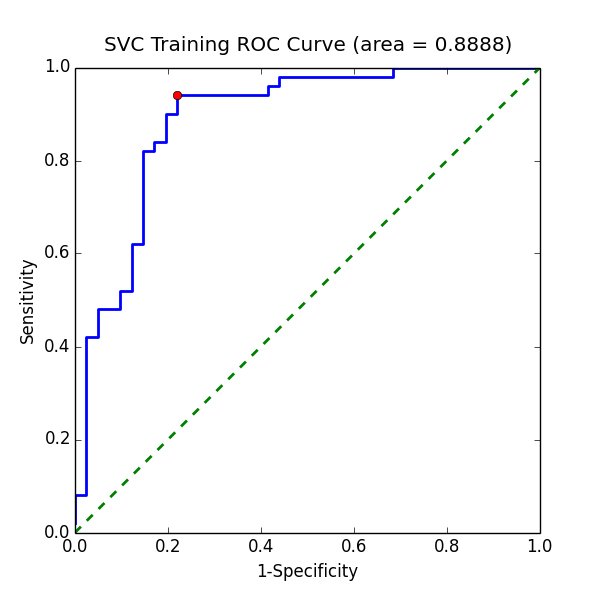
In this study, 91 chronic (50 were remitted and 41 were non-remitted) and 29 first-episode (23 were remitted and 6 were non-remitted) patients with schizophrenia were recruited. The status of remission/non-remission was determined according to the RSWG criteria.3 Each subject’s DSI data were reconstructed via MAP MRI algorithm to yield 6 diffusion indices, including generalized fractional anisotropy (GFA), axial diffusivity (AD), radial diffusivity (RD), non-Gaussianity (NG), non-Gaussianity orthogonal (NGO), and non-Gaussianity parallel (NGP). These indices were sampled along 76 tract bundles of the whole brain using tract-based automatic analysis (TBAA).4 The output of TBAA for each diffusion index is a 76-by-100 2D array of diffusion indices, called connectogram, comprising 76 tract bundles and 100 steps per tract bundle. Consequently, 6 connectograms were produced for each subject. Statistical analysis: We performed stepwise analysis of covariance (ANCOVA) on 76 white matter tracts of chronic patients to select steps that have significant difference (p value < 0.01) between remitted and non-remitted groups, and then, combined those significant steps into significant segments (contiguous significant steps of length above the 95th percentile). Machine learning: Patients with chronic and first-episode schizophrenia were assigned to the training set and test set, respectively. The proposed machine learning model was a Gaussian kernel support vector classifier built under the four-fold cross validation setting using Scikit-learn package.5 A data matrix was constructed as follows: First, the mean values of those significant segments were collected, and the dimensionality was reduced through principal component analysis (PCA) to account for at least 70% of total variance. The data matrix was applied to the classifier, with the “penalty” parameters (Figure 1) in the model determined through validation curves over the range from 2-10 to 210. Finally, to determine the best cutoff value for classification given the classifier, we drew a receiver operating curve (ROC) and proposed the point that yielded the maximum sum of sensitivity and specificity to be the best decision boundary. The performance of the model on chronic and first-episode patients was demonstrated separately with the following indices: accuracy, sensitivity, specificity, positive predictive value (PPV), and negative predictive value (NPV).Results
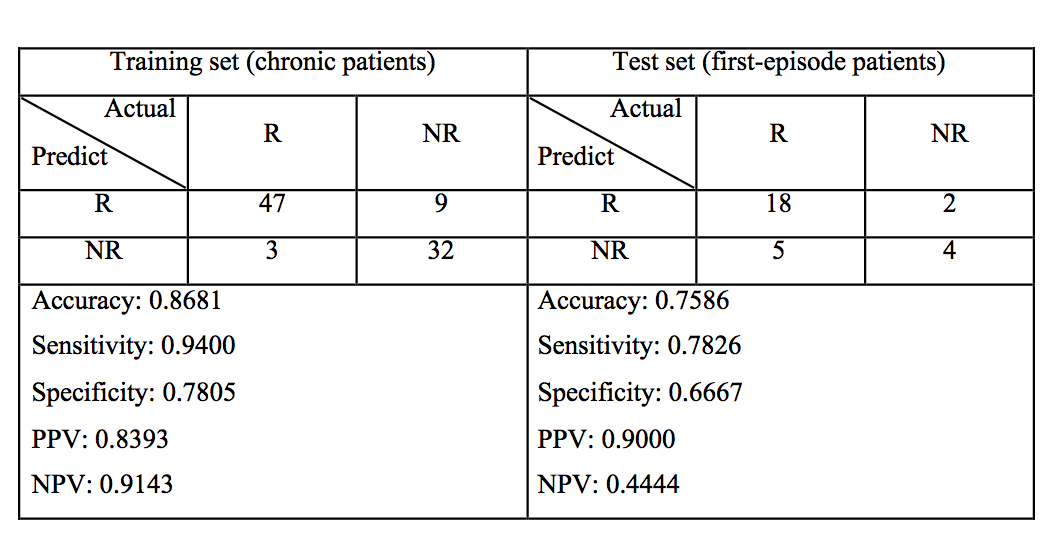
Statistical analysis: Stepwise ANCOVA showed an association between treatment response and the significant segments distributed over the following white matter tracts (Figure 2): (1) uncinate fasciculus, (2) fornix, (3) callosal fibers connecting the orbitofrontal cortex (the genu), dorsolateral prefrontal cortex, precuneus, and hippocampus, (4) frontostriatal tract of the orbitofrontal cortex, and ventral lateral prefrontal cortex, (5) inferior fronto-occipital fasciculus, (6) thalamic radiation of the optic radiation. Machine learning: By adjusting the penalty parameter over the range from 2-10 to 210, the model exhibited a transition from underfitting to overfitting (Figure 3). The ROC of the final support vector classifier showed an area under curve (AUC) of 0.89 (Figure 4). The accuracy of predicting treatment outcome was 0.87 and 0.76 in the training set (chronic patients) and test set (first-episode patients), respectively (Figure 5).Discussion
The white matter tracts that have significant alteration of integrity were identified in this study. The results are consistent with those reported by Mitelman et al,6,7 suggesting that the altered white matter tracts may be used to predict treatment response in schizophrenia. The proposed statistical analysis in this study was able to capture the difference between remitted and non-remitted patients. Despite the limited number of available patients that we were able to recruit, the support vector machine model built upon the DSI data from chronic patients alone still gave us a fair prediction accuracy in first-episode patients. An AUC of nearly 0.9 indicates fair performance of the model on learning the training data and that the model is complex enough to achieve good fit.Conclusion
White matter tracts integrity is a promising biomarker and is potentially useful for predicting treatment outcome of a patient early in the disease course. Further works are required to recruit more patients with first-episode schizophrenia in a longitudinal study to validate the predictive power in clinical settings.Acknowledgements
This work was supported in part by Taiwan Ministry of Science and Technology (grant number: MOST105-2325-B-002-007).References
- Chong HY, Teoh SL, Wu DB, Kotirum S, Chiou CF, Chaiyakunapruk N. Global economic burden of schizophrenia: a systematic review. Neuropsychiatr Dis Treat. 2016;12:357-73.
- Özarslan E, Koay CG, Shepherd TM, et al. Mean apparent propagator (MAP) MRI: a novel diffusion imaging method for mapping tissue microstructure. Neuroimage. 2013;78:16-32.
- Andreasen NC, Carpenter WT, Kane JM, Lasser RA, Marder SR, Weinberger DR. Remission in schizophrenia: proposed criteria and rationale for consensus. Am J Psychiatry. 2005;162(3):441-9.
- Chen YJ, Lo YC, Hsu YC, et al. Automatic whole brain tract-based analysis using predefined tracts in a diffusion spectrum imaging template and an accurate registration strategy. Hum Brain Mapp. 2015;36(9):3441-58.
- Pedregosa et al. (2011). Scikit-learn: Machine Learning in Python. JMLR 12, pp. 2825-2830.
- Mitelman, S. A., Newmark, R. E., Torosjan, Y., Chu, K. W., Brickman, A. M., Haznedar, M. M., ... & Buchsbaum, M. S. (2006). White matter fractional anisotropy and outcome in schizophrenia. Schizophrenia research, 87(1), 138-159.
- Mitelman, S. A., Torosjan, Y., Newmark, R. E., Schneiderman, J. S., Chu, K. W., Brickman, A. M., ... & Buchsbaum, M. S. (2007). Internal capsule, corpus callosum and long associative fibers in good and poor outcome schizophrenia: a diffusion tensor imaging survey. Schizophrenia research, 92(1), 211-224.
Figures