3090
Looking at the structural connectivity of the frontal inferior cortex to better decipher the inhibitory control mechanisms in Obsessive Compulsive Disorder1Grenoble Institut des Neurosciences, Université Grenoble Alpes, Grenoble, France, 2NeuroSpin, CEA Saclay, Gif-sur-Yvette, France, 3Department of Psychology, Université Grenoble Alpes, Grenoble, France, 4LPNC UMR 5105, CNRS, Grenoble, France, 5INSERM U1216, Grenoble, France, 6Unité Mixte de Service IRMaGe, CHU Grenoble Alpes, Grenoble, France, 7Unité Mixte de Service 3552, CNRS, Grenoble, France, 8Department of Psychiatry, CHU Grenoble Alpes, Grenoble, France
Synopsis
Obsessive-compulsive disorder (OCD) is a neuropsychiatric disease affecting 2.5-3% of the population and characterized by repetitive compulsive behaviours with severe complications such as depression, suicide and addiction. Diffusion MRI is a powerful non-invasive technique that evaluates the integrity of the white matter pathways such as those implicated in the impulse control, likely to be impaired in OCD. Here, we investigate the connectivity of the right posterior inferior frontal cortex and in particular to the presupplementary motor area (also involved in inhibition), to the striatum (involved in proactive and/or selective control) and to the primary motor cortex in the contralateral hemisphere.
Purpose
Obsessive-compulsive disorder (OCD), ranked by the World Health Organization as the tenth most disabling illness, is a neuropsychiatric disease affecting 2.5-3% of the population and characterized by repetitive compulsive behaviours with severe complications such as depression, suicide and addiction1,2. Diffusion MRI is a powerful non-invasive technique that evaluates the integrity of the white matter pathways such as those implicated in the impulse control, likely to be impaired in OCD. Here, we investigate the connectivity of the right posterior inferior frontal cortex (rpIFC) and in particular to the presupplementary motor area (preSMA, also involved in inhibition3), to the striatum (involved in proactive and/or selective control3) and to the primary motor cortex M1 in the contralateral hemisphere.Methods and materials
Population – 21 OCD patients (12 women; between 27 and 62 yo) underwent the following protocol.
Clinical Protocol – The anxiety scale was evaluated (using HAM-A questionnaire) along with two neuropsychological tests: the Trail Making Test (TMT) parts A and B, which evaluates cognitive flexibility and the Stroop test, which gives indications on automatic behavior inhibition and resistance to interference. These tests were performed twice: t1=just before the MRI protocol (N=18 for TMT and N=17 for Stroop test) and t2=six months after (N=17).
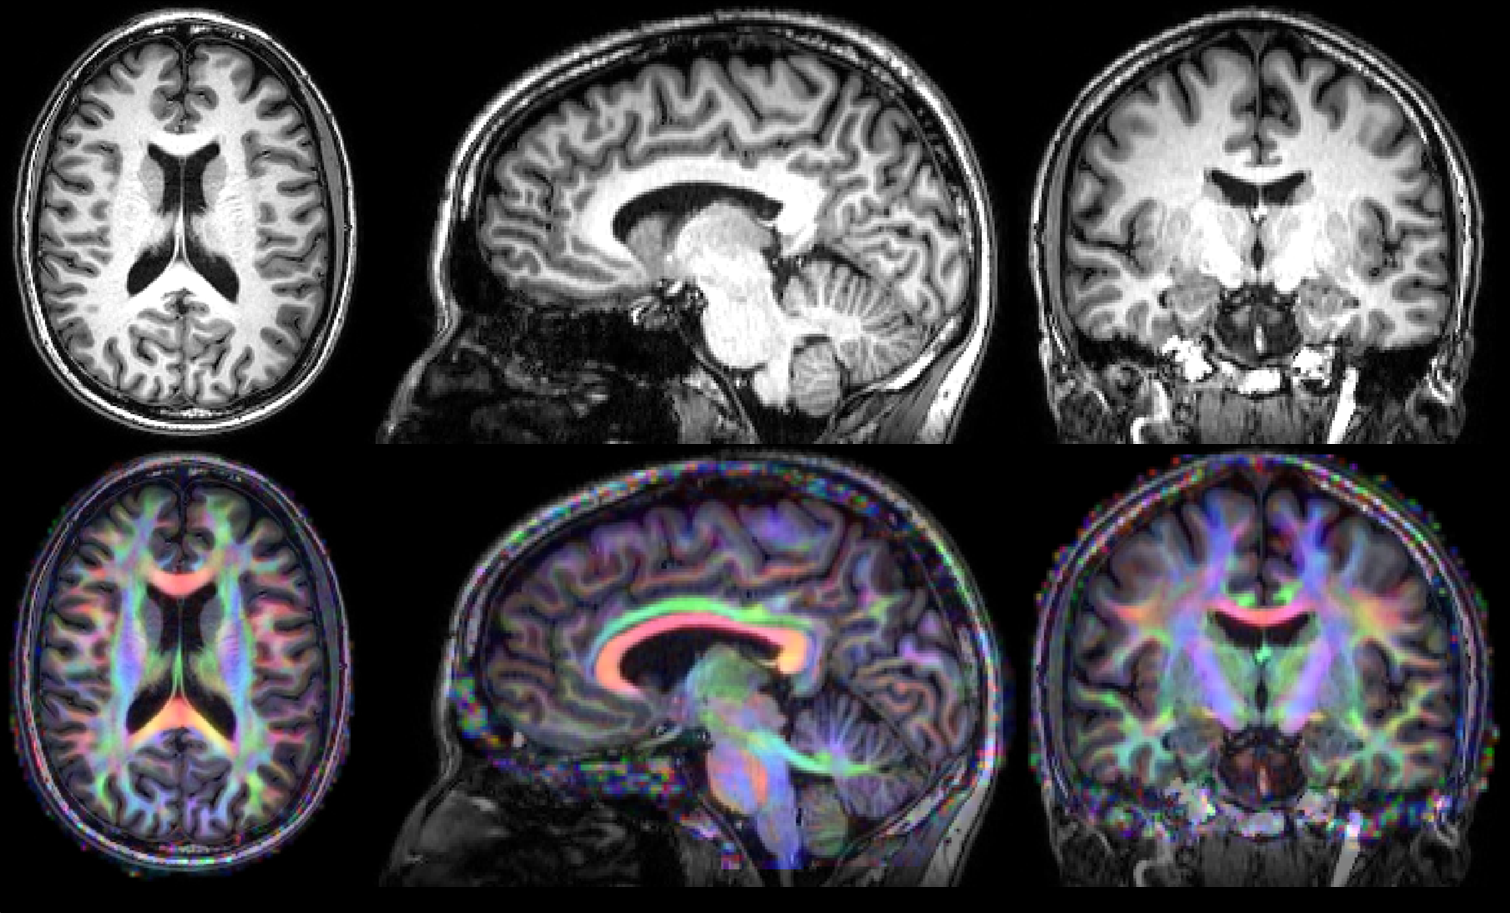
MRI Protocol – Scans were acquired on a 3T Philips Achieva TX MRI scanner. The protocol included a 3D T1-weighted anatomical scan (voxel size:0.88x0.88x1mm), a fieldmap, and 2D diffusion-weighted Spin Echo echoplanar sequences sampling the q-space with 2 shells at 700/2700s/mm² along 30/60 diffusion directions respectively using the following parameters: FOV=256x252mm, slice thickness TH=2mm, matrix 128x126 yielding an isotropic voxel resolution of 2mm; 6 b=0 s/mm² reference volumes; TE/TR=78ms/14.5s, for a total acquisition time of 42 minutes.
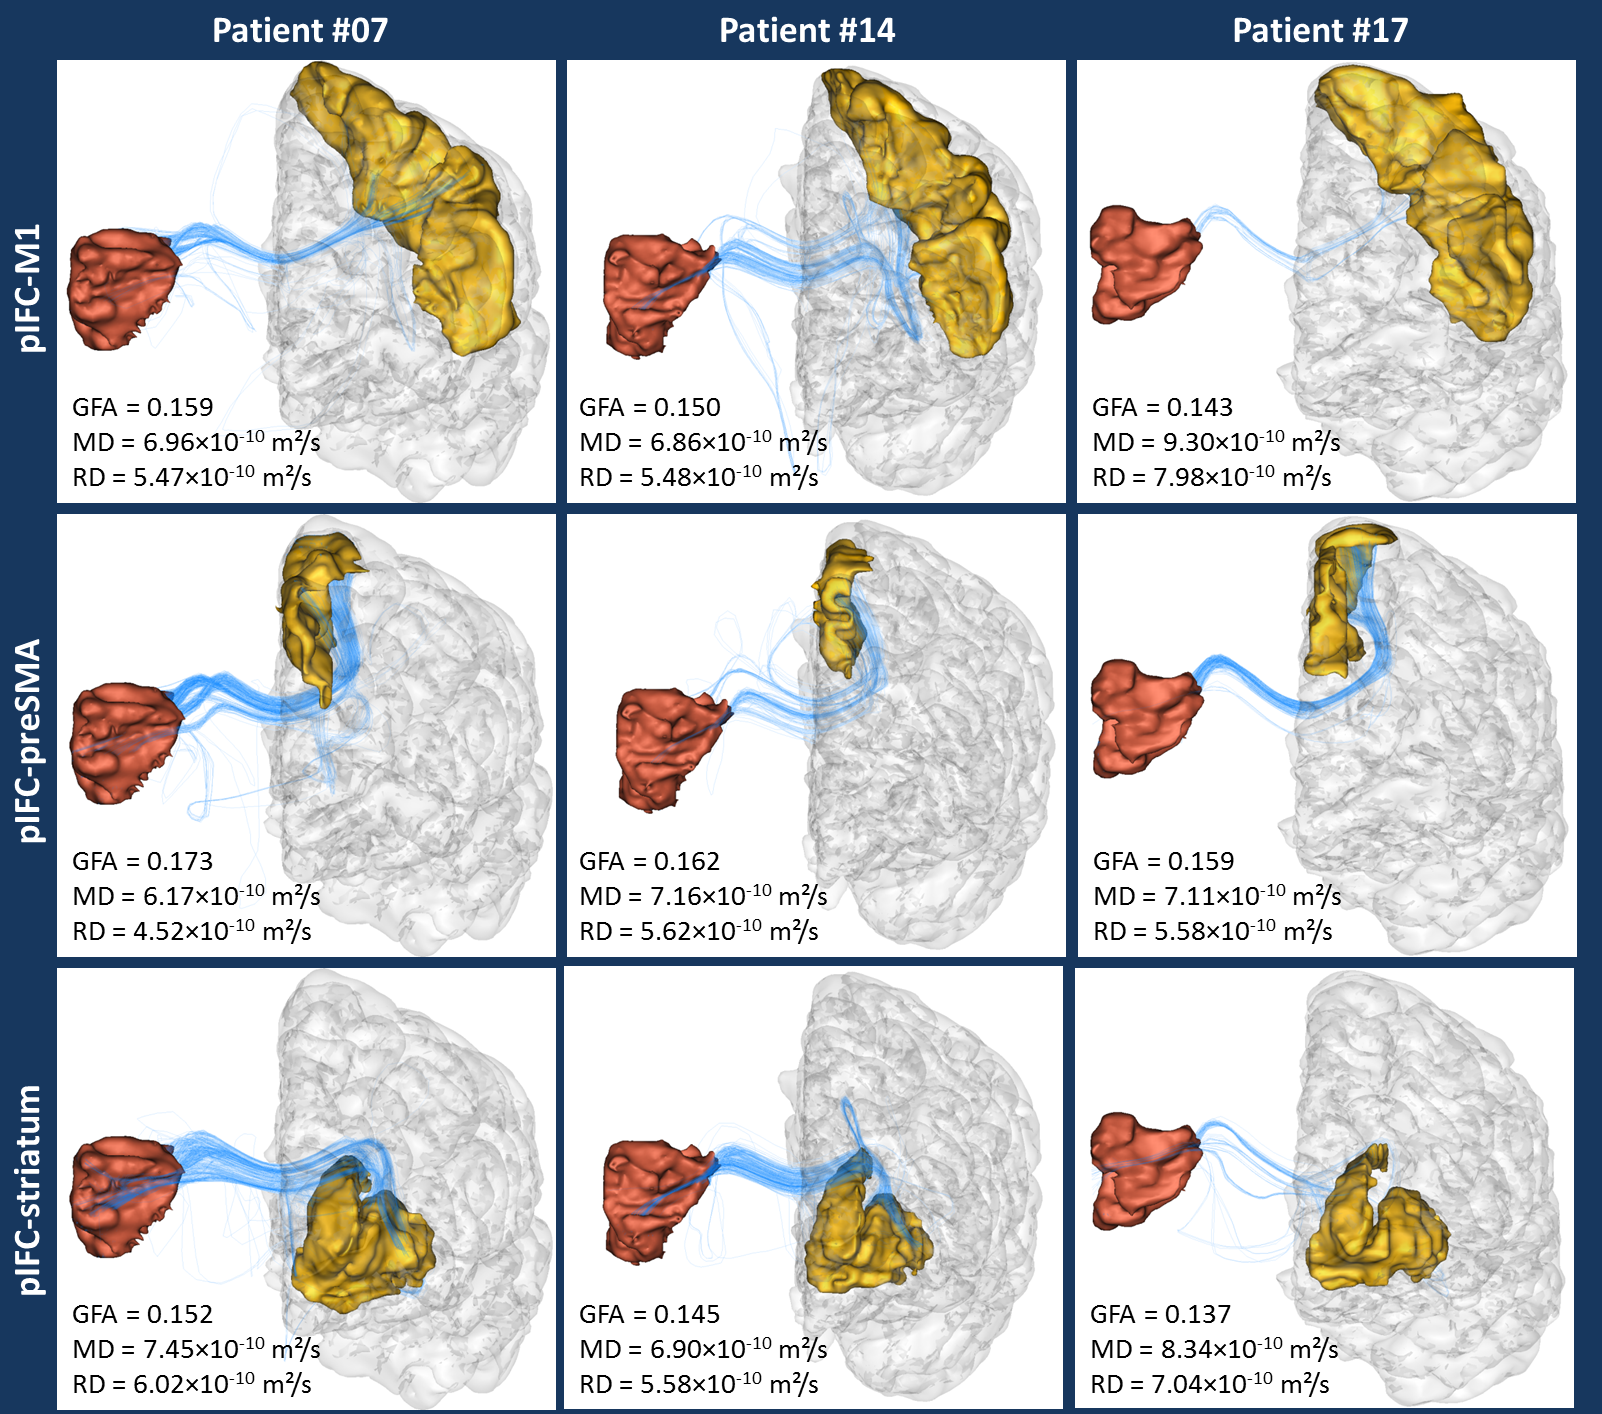
Post-processing – Data analysis was perfomed using the Connectomist toolbox4. After correction for all sources of artifacts (noise, outliers, eddy currents, susceptibility artifacts, motion), the DW data were rigidly matched to their T1-weighted reference. The DW dataset scanned at 2700s/mm² b-value was used to compute the diffusion Orientation Distribution Function (ODF) in each voxel using an analytical Q-Ball model5, and, after computing a precise domain of propagation using the T1-weighted MRI which boundary can be used as a stopping criterion for fibers6, a streamline regularized deterministic algorithm7 was perfomed to infer a dense whole brain connectogram (8 seeds per voxel, aperture angle of 30°). An automatic parcellation of cortical regions was performed using FreeSurfer8 and three bundles of interest coming from the right pIFC and connecting to the left hemisphere were extracted: the pIFC-M1 bundle, the pIFC-preSMA bundle (the preSMA being extracted from the superior frontal gyrus) and the pIFC-striatum bundle (Fig.2). A further filtering of the obtained bundles was performed to only keep fibers passing through the corpus callosum, known to correspond to the pathway connecting the two hemispheres.
For each bundle, we evaluated:
-the number of fibers (normalized by the total number of fibers in the patient's connectogram)
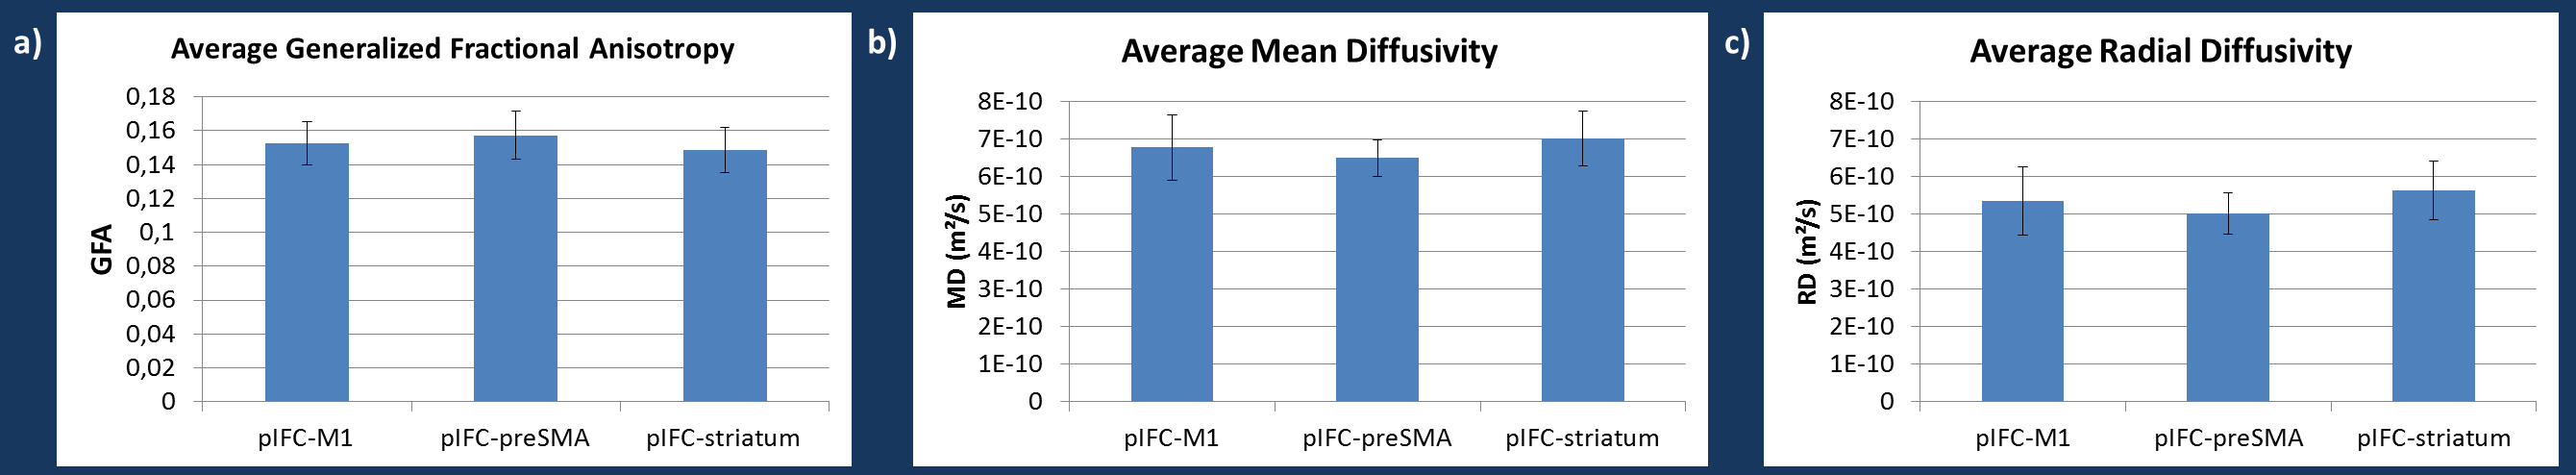
-the generalized fractional anisotropy9 (GFA), the mean diffusivity (MD) and the radial diffusivity (RD) averaged along the centroid (average fiber) of the bundle (Fig.3).
The Pearson correlation was evaluated between each diffusion parameter and each clinical score at t1 and t2.
Results & discussion
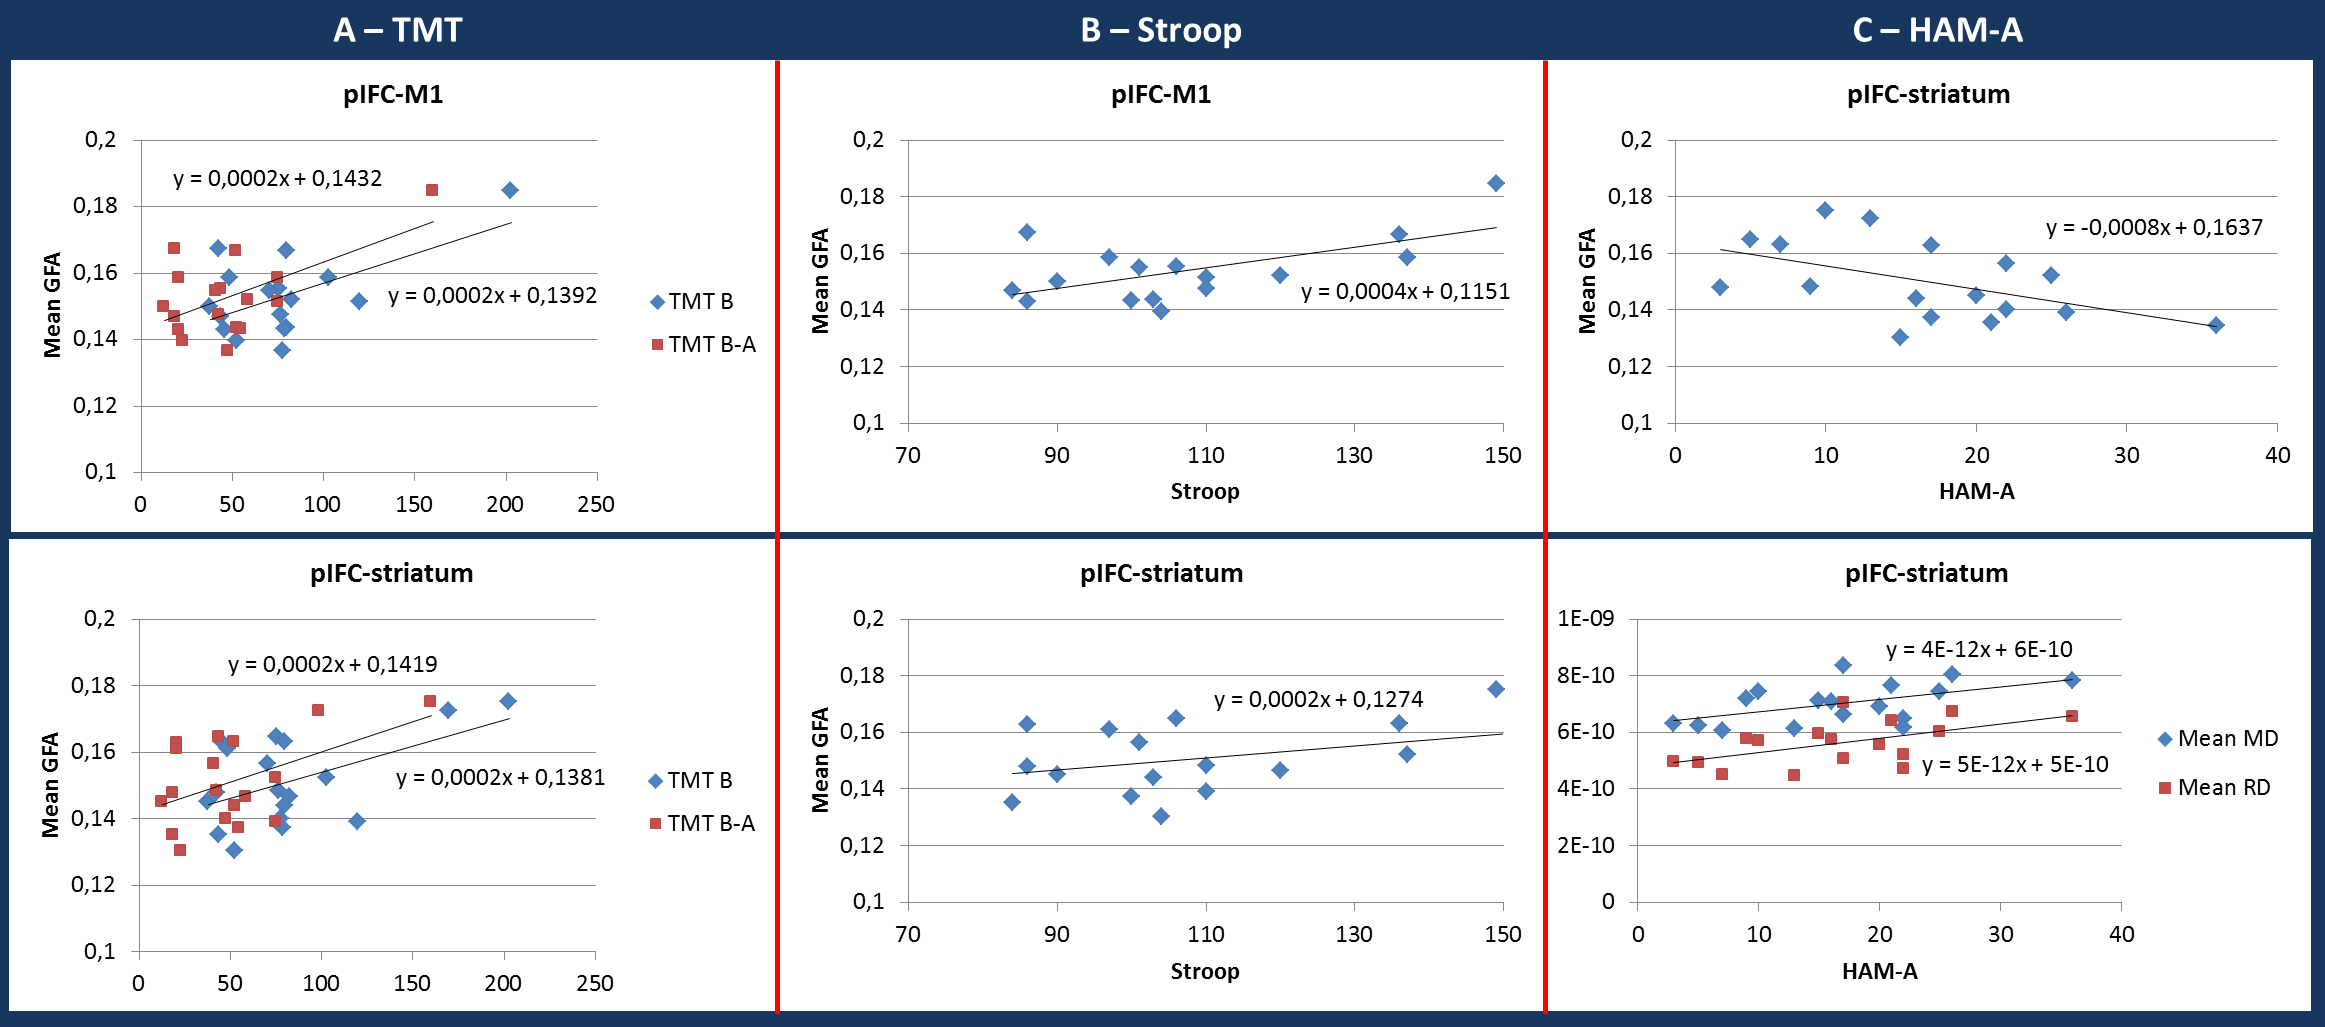
TMT B and B-A (switching time) at t1 were positively correlated with the mean GFA in pIFC-M1 (r=0.58, p=0.02; r=0.59, p=0.01) and pIFC-striatum centroids (r=0.53, p=0.02; r=0.50, p=0.03) (Fig.4A). Stroop results at t1 were also positively correlated with the mean GFA of these two fiber tracts (r=0.61, p=0.01; r=0.56, p=0.02, Fig.4B). This significant increase in GFA (+35% maximum) may be either associated to a denser packing of white matter fibers or to a stronger myelination degree of the fibers10.
A negative correlation was also found between HAM-A measured at t2 with mean GFA measured at t1 in pIFC-striatum centroid (r=-0.51, p=0.04) and positive correlations were found with MD and RD in that same tract (r=0.52, p=0.03; r=0.54, p=0.02) (Fig.4C). The correlations found with the HAM-A scores suggest that a higher GFA at t1 yields a lower HAM-A six months later. The opposite holds for MD or RD: the lower these parameters at t1, the lower the HAM-A score at t2.
Neither the number of fibers in the bundles nor the parameters from the pIFC-preSMA centroid were correlated with any of the clinical scores.
Conclusion
The significant correlations observed within specific circuits involved in inhibition between diffusion MRI features and clinical scores provide new insights to better identify the impaired white matter bundles, and might be of interest to predict the evolution of the pathology in OCD patients. Following the same approach, we will extent our study to the hyperdirect pathway also known to be involved in the inhibitory mechanisms.Acknowledgements
This project is partially funded by the DS0402 2014 program French National Research Agency (ANR) - project ANR-14-CE13-0030 "PHYSIOBS"
Grenoble MRI facility IRMaGe was partly funded by the French program “Investissement d’Avenir” run by the ‘Agence Nationale pour la Recherche’ ; grant 'Infrastructure d’avenir en Biologie Santé' – ANR-11-INBS-0006
References
- Fontenelle, I., Fontenelle, L., Borges, M., Prazeres, A., Rangé, B., Mendlowicz, M., & Versiani, M. (2010). Quality of life and symptom dimensions of patients with obsessive–compulsive disorder. Psychiatry Research, 179(2), 198–203. https://doi.org/10.1016/J.PSYCHRES.2009.04.005
- Ruscio, A. M., Stein, D. J., Chiu, W. T., Kessler, R. C., Mattar, L., Thiébaud, M. R., … Godart, N. (2010). The epidemiology of obsessive-compulsive disorder in the National Comorbidity Survey Replication. Psychiatry Research, 15(2–3), 513–517. https://doi.org/10.1038/mp.2008.94
- Aron R., A. (2011). From Reactive to Proactive and Selective Control: Developing a Richer Model for Stopping Inappropriate Responses. Biol Psychiatry, 42(7), 411–418. https://doi.org/10.1016/j.biopsych.2010.07.024
- Duclap, D., Lebois, A., Schmitt, B., Ri, O., Guevara, P., ... Poupon, C. (2012). Connectomist-2.0: a novel diffusion analysis toolbox for brainvisa. In Proceedings of the European Society Magnetic Resonance in Medicine and Biology.
- Descoteaux, M., Angelino, E., Fitzgibbons, S., & Deriche, R. (2007). Regularized, fast, and robust analytical Q-ball imaging. Magnetic Resonance in Medicine, 58(3), 497–510. https://doi.org/10.1002/mrm.21277
- Perrin, M., Cointepas, Y., Cachia, A., Poupon, C., Thirion, B., Rivière, D., … Mangin, J.-F. (2008). Connectivity-Based Parcellation of the Cortical Mantle Using q-Ball Diffusion Imaging. International Journal of Biomedical Imaging, 2008, 1–18. https://doi.org/10.1155/2008/368406
- Perrin, M., Poupon, C., Cointepas, Y., Rieul, B., Golestani, N., Pallier, C., … Mangin, J.-F. (2005). Fiber tracking in q-ball fields using regularized particle trajectories. In Proc. of IPMI, pages 52–63. https://doi.org/10.1007/11505730_5
- Desikan, R. S., Ségonne, F., Fischl, B., Quinn, B. T., Dickerson, B. C., Blacker, D., … Killiany, R. J. (2006). An automated labeling system for subdividing the human cerebral cortex on MRI scans into gyral based regions of interest. NeuroImage, 31(3), 968–980. https://doi.org/10.1016/j.neuroimage.2006.01.021
- Tuch, D. S. (2004). Q-ball imaging. Magnetic Resonance in Medicine, 52(6), 1358–1372. https://doi.org/10.1002/mrm.20279
- Jito, J., Nakasu, S., Ito, R., Fukami, T., Morikawa, S., & Inubushi, T. (2008). Maturational changes in diffusion anisotropy in the rat corpus callosum: Comparison with quantitative histological evaluation. Journal of Magnetic Resonance Imaging, 28(4), 847–854. https://doi.org/10.1002/jmri.21496
Figures