3089
Brain Microstructure Changes of gray matter detected by DKI in Alzheimer disease with Type 2 diabetes patients1Department of Radiology, The First Affiliated Hospital of Dalian Medical University, Dalian, China
Synopsis
In this paper, the experimental group and the control group were respectively used as the people with Alzheimer disease with type 2 diabetes and Alzheimer disease without type 2 diabetes, the effect of high blood glucose on the microstructure in patients with type 2 diabetes mellitus was studied used DKI study, and it is concluded that the high blood glucose level may have certain damage to the microstructure of the gray matter. In conclusion, DKI study can evaluate secondary brain microstructure changes from hyperglycemia in T2DM patients.
Target audience
Investigators with neuroimaging research related to cognitive impairment from type 2 diabetes mellitus.Purpose
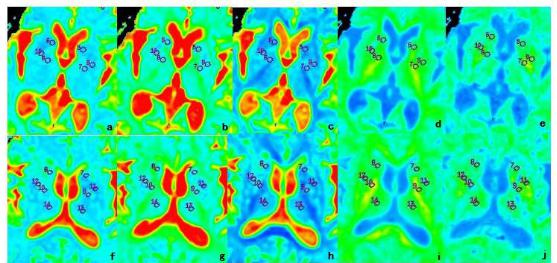
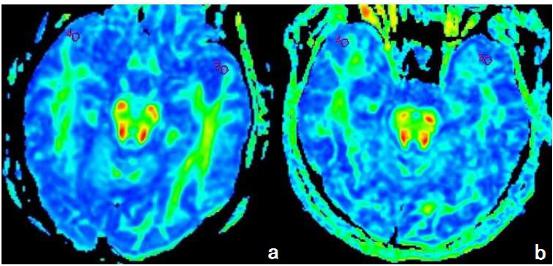
To initially detect the microscopic diffusion changes of cortex and gray nucleus in Alzheimer disease with and without type 2 diabetes(AD+T2DM, AD-T2DM) by measuring the diffusion kurtosis data.Methods
This prospective study was approved by the hospital ethics committee. The study was divided into AD+T2DM group(13 cases, 6 males, age 74.46±8.26 yrs), AD-T2DM group(22 cases, 9 males, age 70.82±8.72 yrs). The mental status was evaluated for everyone through MMSE and MoCA scores by two neurologists.All performed MR protocols included conventional MRI and diffusion kurtosis imaging (DKI), DKI was done with the dual spin echo(SE-EPI) sequence(b=0s/mm2, 1000s/mm2, 2000s/mm2, and diffusion sensitive gradient field is 15 directions). The raw DKI data is processed by using Functool 2 software in ADW4.6 workstation. Bilateral MK, Ka, Kr, MD, Da, Dr and FA values in the superior frontal gyrus(SFG) and middle temporal gyrus(MTG), hippocampus(HIP),head of caudate nucleus(HCN), putamen(PUT), globus pallidus(GP) and thalamus(THA) were manually measured twice by two radiologists.Two independent samples t-test was used to compare the diffusion parameters in all regions between groups. The relations between DKI parameters and MMSE, MoCA score were analyzed using Spearman's correlation.Result
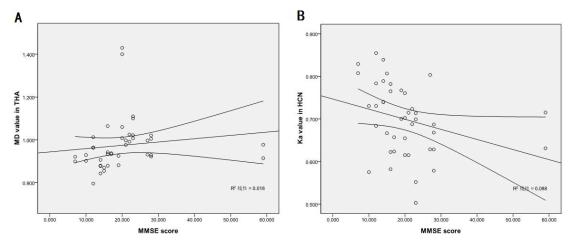
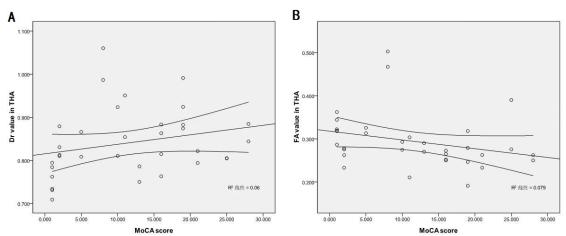
Compared with those in AD-T2DM group, FA value significantly increased only in MTG (P< 0.05), and then MD and Da value also increased in HCN and THA(P< 0.05) in AD+T2DM group. Only in THA did MK and Ka value significantly decrease (P< 0.05) in AD+T2DM than AD-T2DM group.The MD value in THA has the best positive correlation with MMSE score (r=0.474, P=0.002). Simultaneously, the Ka value in HCN showed the best negative correlation with the MMSE score (r=-0.458, P=0.002).Moreover, positive correlation with MoCA score was only found at Dr value in THA (r=0.365, P=0.034), and then the FA value in THA has the best negative correlation with MoCA score(r=-0.466, P=0.006).Discussion
In this studies, significant abnormal diffusion in the MTG, THA and HCN illustrate the microstructure complexity changes due to neuron degeneration, Louis corpuscles formation, microglia aggregation in AD+T2DM than AD-T2DM group[1]. There is a clear relationship between DKI parameters and MMSE and MoCA score which is suggested that the high blood glucose level could aggravate decline in cognitive function. Furthermore, DKI can be used to detect the microstructure changes in gray matter[2, 3].Conclusion
For AD patients, hyperglycemia may aggravate the microstructure damage in gray matter and nucleus, and HCN and THA are probably the parts that most easily affected. DKI parameters also reflect of cognitive status to some extent.Acknowledgements
No acknowledgement found.References
[1] Lenglet C, Abosch A, Yacoub E, De Martino F, Sapiro G, Harel N. Comprehensive in vivo mapping of the human basal ganglia and thalamic connectome in individuals using 7T MRI. PLoS One, 2012, 7 (1):e29153
[2] Biessels G J. Brain MRI correlates of cognitive dysfunction in type 2 diabetes: the needle recovered from the haystack?[J]. Diabetes Care, 2013, 36(12):3855.
[3] Biessels G J, Reijmer Y D. Brain changes underlying cognitive dysfunction in diabetes: what can we learn from MRI?[J]. Diabetes, 2014, 63(7):2244.
Figures