3087
Regional Brain Changes in Autonomic, Mood, and Cognitive Control Areas in Adolescents with Single Ventricle Heart Disease1Department of Anesthesiology, University of California Los Angeles, Los Angeles, CA, United States, 2UCLA School of Nursing, University of California Los Angeles, Los Angeles, CA, United States, 3Division of Pediatric Cardiology, University of California Los Angeles, Los Angeles, CA, United States, 4Division of Pediatric Cardiology, Children’s Hospital Los Angeles, Los Angeles, CA, United States, 5Department of Radiological Sciences, University of California Los Angeles, Los Angeles, CA, United States, 6Department of Bioengineering, University of California Los Angeles, Los Angeles, CA, United States, 7Brain Research Institute, University of California Los Angeles, Los Angeles, CA, United States
Synopsis
Adolescents with single ventricle heart disease (SVHD) show both white and gray matter injury in multiple brain areas that control autonomic, mood, and cognitive functions that are deficient in the condition. However, the nature and extent of brain injury in SVHD are unclear. Using diffusion tensor imaging based MD procedures, we showed wide-spread chronic tissue changes in SVHD subjects in areas involved in autonomic, mood, and cognitive regulatory functions. These findings may have resulted from hypoxia/ischemia- or developmental-induced processes accompanying the condition.
Introduction
Adolescents
with single ventricle congenital heart disease (SVHD) show brain gray and white
matter changes in multiple sites that control autonomic, mood, and cognitive
functions, which are deficient in the condition.1,2 However, the nature
(whether acute or chronic tissue changes) and extent of brain injury in SVHD adolescents
are unclear. Diffusion tensor imaging (DTI)-based mean diffusivity (MD)
procedures measure average water diffusion within tissue and show reduced MD
values in acute and increased MD values in chronic pathological conditions,3
and may be helpful to examine nature and extent of tissue changes in SVHD adolescents.
Our aim was to evaluate the nature and extent of regional brain tissue changes
in SVHD over control adolescents using DTI-based MD procedures.
Materials and Methods
We studied 17 SVHD (age, 15.8±1.4 years; 10 male) and 29 control adolescents (age, 15.9±1.2 years; 15 male). All SVHD subjects (age range, 14-18 years), who have undergone surgical palliation with Fontan completion, were recruited via flyers or provider referrals from the pediatric cardiology clinics and private practice cardiology groups. Control subjects were healthy, with no medications, and no diagnosed history of head injury or other conditions that may introduce brain changes, and were recruited from the neighboring area. All procedures were approved by the Institutional Review Boards and each subject provided written informed consent prior to participate in the study. Brain imaging studies were performed using a 3.0-Tesla MRI scanner (Magnetom Prisma, Siemens, Erlangen, Germany). High-resolution T1-weighted images were acquired using a magnetization-prepared rapid gradient echo sequence (MPRAGE) (TR = 2200 ms; TE = 2.4 ms; inversion time = 900 ms; FA = 9°; matrix size = 320×320; field of view (FOV) = 230×230 mm2; slice thickness = 0.9 mm; number of slices = 192). DTI data were collected using a single-shot echo planer imaging with twice-refocused spin-echo pulse sequence (TR = 12,200 ms; TE = 87 ms; flip-angle = 90°; band width = 1,345 Hz/pixel; matrix size = 128×128; FOV = 230×230 mm2; slice thickness = 1.7 mm, diffusion values = 0 and 800 s/mm2, diffusion directions = 30, separate series = 2). The diffusion tensor matrices were calculated and diagonalized, and principal eigenvalues (λ1, λ2, and λ3) were quantified using the Diffusion toolkit software.4 Using the principal eigenvalues, MD values [(λ1+λ2+λ3)/3] were calculated at each voxel, with voxel intensities on the MD maps representing the corresponding MD values. We realigned and averaged MD maps computed from each DTI series, normalized to Montreal Neurological Institute (MNI) space, and smoothed with a Gaussian filter (8 mm). High resolution T1-weighted images of a control subject were normalized to MNI space, and were used as background images for structural identification. The smoothed MD maps were compared voxel-by-voxel between the groups using ANCOVA (SPM12; covariates, age and gender; uncorrected threshold p < 0.001; extended cluster size, 10 voxels). The brain clusters with significant differences between SVHD and control groups were overlaid onto background images for structural identification.Results
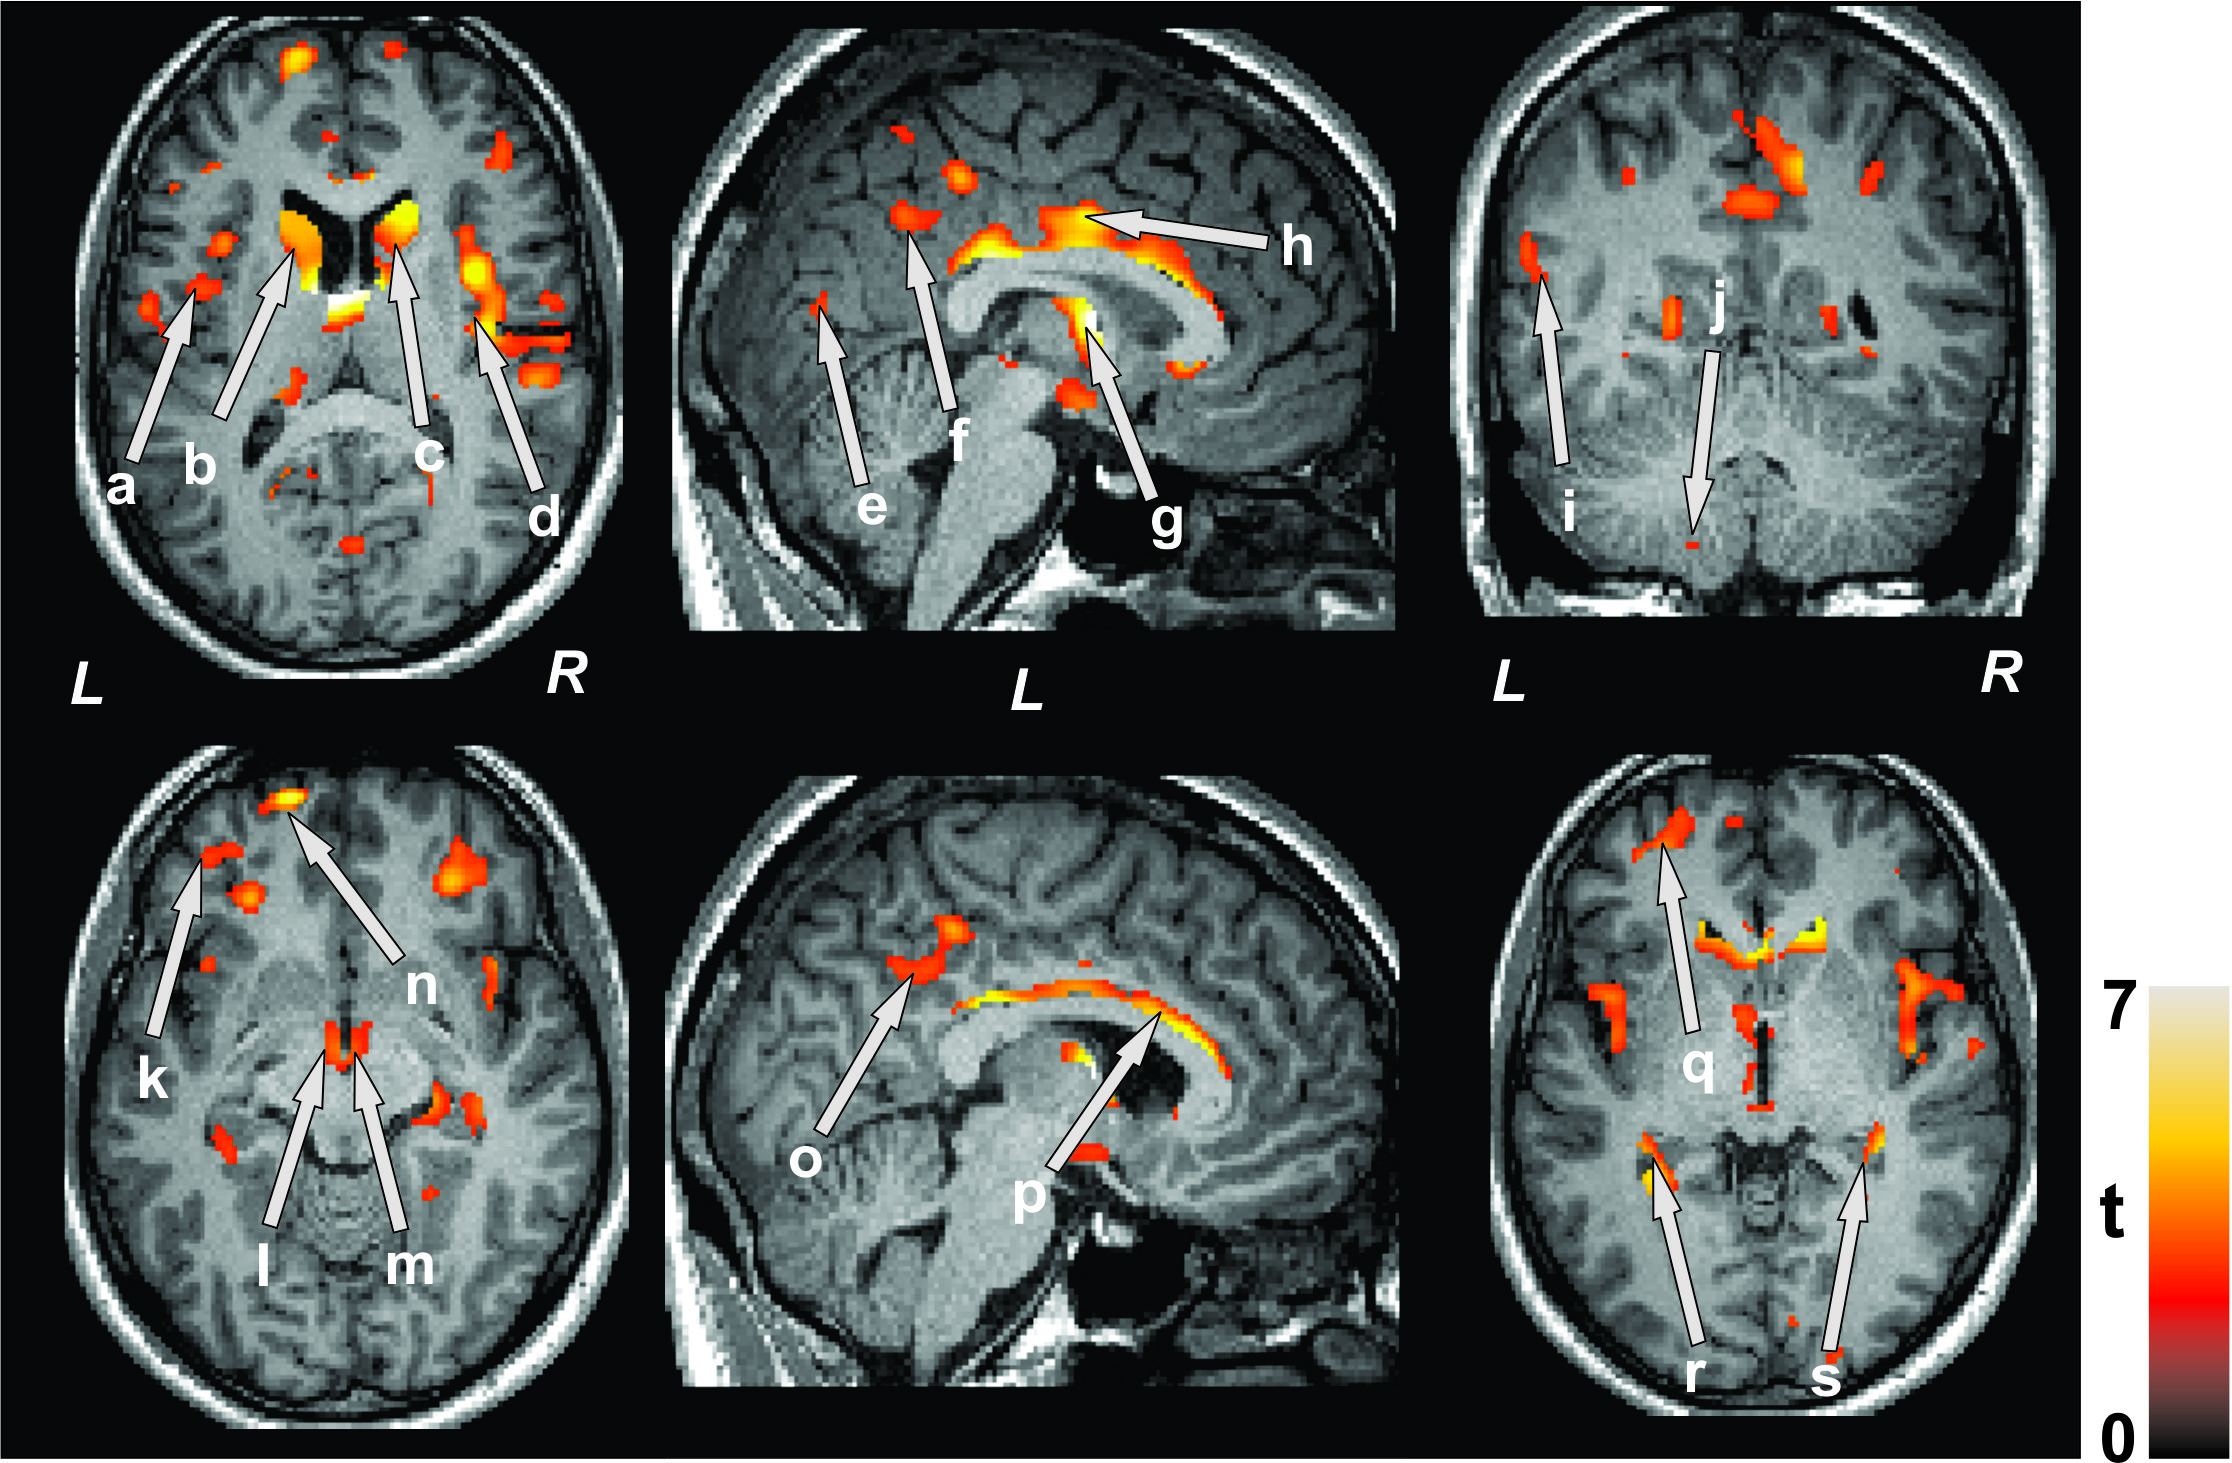
No significant differences in age (p = 0.73), gender (p = 0.64), or body mass index (BMI) (p = 0.89) appeared between groups. Multiple brain areas in SVHD subjects showed increased MD values, indicating chronic tissue changes, compared to control subjects (Figure 1). None of the brain regions showed decreased MD values in SVHD over control subjects. Brain sites that showed increased MD values in SVHD subjects included the insular cortices (a, d), caudate nuclei (b, c), occipital cortices (e), inferior parietal lobule (f), thalamus (g), cingulate cortices (h, o), temporal gyrus (i), cerebellum (j), prefrontal cortices (k, n, q), mammillary bodies (l, m), corpus callosum (p), bilateral hippocampus (r, s), in SVHD subjects compared to controls.Discussion and Conclusion
Adolescents with SVHD showed wide-spread brain injury in areas that regulate autonomic, mood, and cognition, functions that are compromised in the condition. These findings indicate that brain injury is in chronic pathological stage in those sites in SVHD patients, which may result from hypoxia/ischemia- or developmental-induced processes.Acknowledgements
This work was supported by National Institutes of Health R01-NR013930 and R01-NR016463.References
1. Mulkey SB, Ou X, Ramakrishnaiah RH, et al. Pediatr Neurol. 2014; 51(3):377-383.
2. Rollins CK, Watson CG, Asaro LA, et al. J Pediatr. 2014; 165(5):936-944 e931-932.
3. Ahlhelm F, Schneider G, Backens M, et al. Eur Radiol. 2002; 12(9):2322–2329.
4. Zhang H, Yushkevich PA, Alexander DC, et al. Med Image Anal. 2006; 10(5):764-785.
Figures