3081
Apparent diffusion coefficient for molecular subtyping of non-Gadolinium-enhancing WHO grade II/III glioma1Lysholm Department of Neuroradiology, National Hospital for Neurology & Neurosurgery UCLH NHS FT, London, United Kingdom, 2Department of Brain Repair and Rehabilitation, UCL Institute of Neurology, London, United Kingdom, 3Imaging Department, University College Hospital UCLH NHS FT, London, United Kingdom, 4Neurology Department, Natl Hosp for Neurology & Neurosurgery UCLH NHS FT, London, United Kingdom, 5Department of Neurodegenerative Disease, UCL Institute of Neurology and Division of Neuropathology, London, United Kingdom, 6Department of Neuroinflammation, Queen Square MS Centre, UCL Institute of Neurology, London, United Kingdom
Synopsis
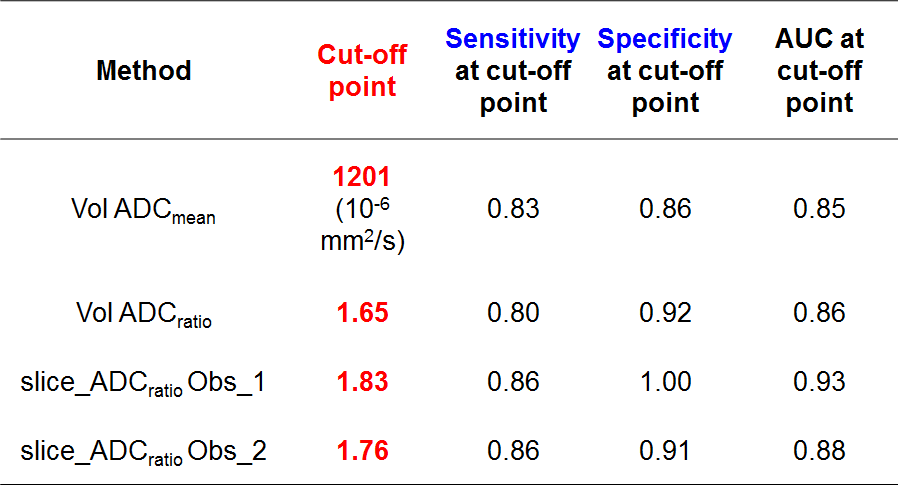
A proportion of non-enhancing intrinsic presumed low-grade-gliomas(LGG), rapidly progresses. Hypothesis: ADC can predict glioma molecular subtypes of the revised 2016 World_Health_Organization brain tumours classification. Methods..44 non-Gadolinium-enhancing LGG divided in three molecular subgroups. 2D and 3D T2-derived tumour and normal-appearing-white-matter (NAWM) masks co-registered to ADC_maps(b=1000s/mm2). Linear-regression, ROC-analysis and logistic-regression compared ADC_values with tumour type. Results..ADCmean and ADCratio(tumour/NAWM) were lowest (p<0.001) in the most malignant tumour type (IDHwt). An ADCmean(ADCratio) threshold of 1201*10-6mm2/s(1.65) identified IDHwt with sensitivity=83%(80%) and specificity=86%(92%) (AUC=0.9-0.94). Between-observers (2D-versus-3D) intraclass-correlation-coefficient=0.98(0.92). Conclusions..ADC measurements can support the distinction of non-enhancing glioma subtypes. 3D and 2D measurements were both accurate.
Introduction
In common clinical practice non-enhancing intrinsic
tumours are considered probable low grade gliomas (LGG)[1-4]. However, a proportion of them rapidly progresses
to develop malignant features[4–8]. The optimal treatment for LGG remains
disputed with one strategy being observational management. Two recent surveys showed
approximately 50% of neurosurgeons adopting a ‘wait and see’ approach balanced
against surgical risk[9], and only 21% performing an upfront biopsy[10]. Consequently, non-enhancing higher
grade gliomas may reveal their aggressive nature through progression and
receive treatment with a delay.
The discovery of key genetic alterations as principal
determinants of glioma prognosis[11] prompted a 2016 revision of the World Health
Organization (WHO) brain tumours classification to incorporate molecular data[12]. For WHO grade II/III gliomas, 3 molecular subgroups
have been defined: Isocitrate-Dehydrogenase (IDH) wild type (IDHwt) with survival
similar to that of glioblastoma, IDH mutant with intact 1p19q (IDHmut_1p19-int)
and an intermediate prognosis, and IDH mutant 1p19q co-deleted (IDHmut_1p19q-del)
with the best prognosis and greatest chemosensitivity[13].
Diffusion-weighted imaging (DWI) is of interest in
cancer, because water diffusivity is impaired in highly cellular tissues, which
reflects tumour proliferative rate and aggressiveness[14]. Reduced diffusion preceding fulminant radiological
progression of presumed LGG has been observed prior to molecular typing[7].
This study aimed to: i) investigate whether apparent
diffusion coefficient (ADC) is associated with glioma molecular subtype; ii)
assess whether ADC could reliably diagnose non-enhancing WHO II/III gliomas
with a molecular signature linked to a worse prognosis (IDHwt).
Methods
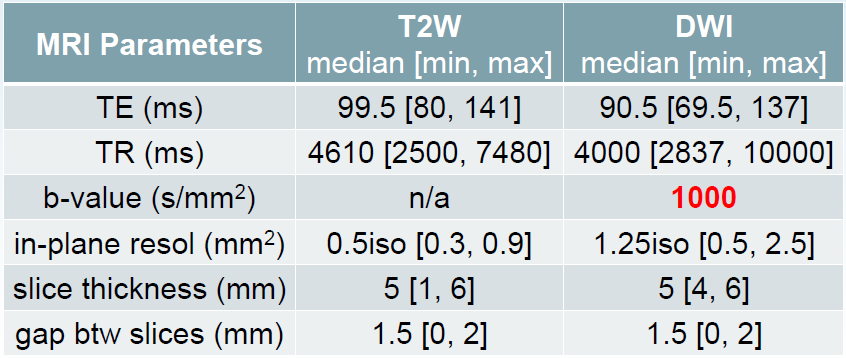
Institutional board approved this retrospective study. 44 non-enhancing gliomas were subdivided in 3 molecular groups: 14 IDHwt, 16 IDHmut_1p19q-int and 14 IDHmut_1p19q-del. The routine MRI sequences were acquired in 10 different referring institutions, on 18 different scanners (31 @1.5T, 13 @3T) from all major vendors: 4 General Electric, 7 Siemens, 6 Philips and 1 Toshiba. All acquisitions included axial T2-weighted images, and axial 3-directional whole-brain DWI (acquisition parameters in Table1)
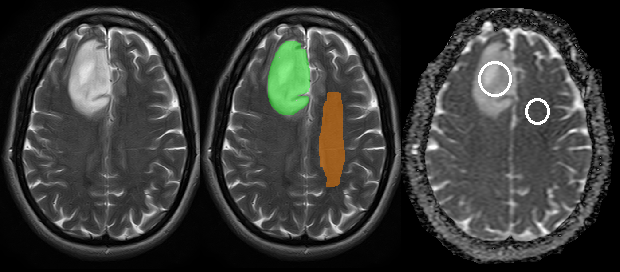
Volumetric (3D, ITK snap,www.itksnap.org[15]) and single-slice (2D, clinical PACS software, IMPAX_6.5.1.1008, Agfa-Gevaert, Belgium) regions of interest (ROIs, Fig.1) were identified on T2W_MRI in tumour and in contralateral normal-appearing-white-matter (NAWM) by two neuroradiologists blinded to molecular typing. The corresponding measured ADC_values were: tumour ADCmean and tumour/NAWM ADCratio (fslstats [16,17]).
Statistical analysis (Stata_version14, CollegeStation, TX:StataCorpLP): i) linear regression between tumour type and ADC_values (ii) logistic regression to determine if ADC_values can differentiate IDHwt from IDHmut gliomas. A Receiver-Operating-Characteristic (ROC) analysis quantified the logistic regression accuracy with area-under-ROC measurements (AUC). The ‘nearest to (0,1)’ method identified a cut-off point for the logistic regression. Statistical significance=0.05. Inter-rater agreement assessed with intraclass correlation coefficient (ICC).
Results
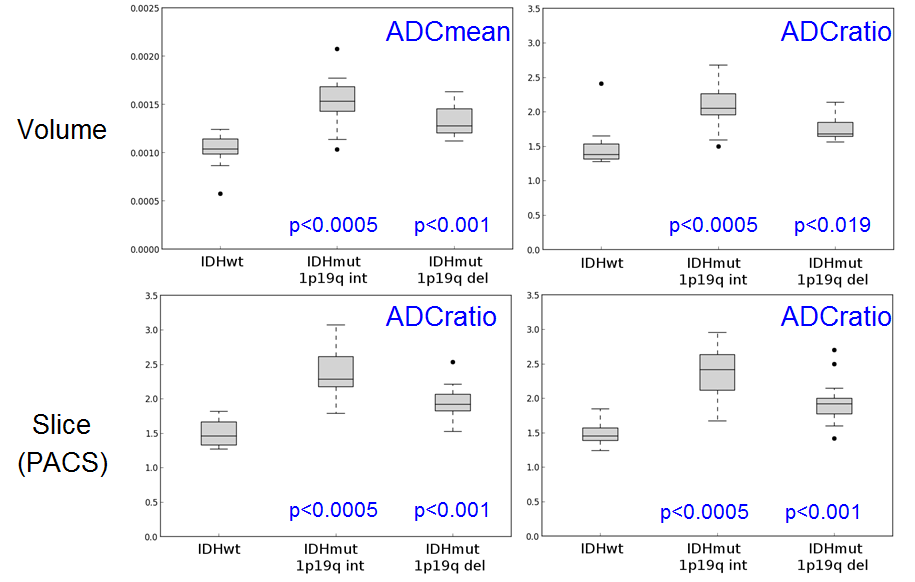
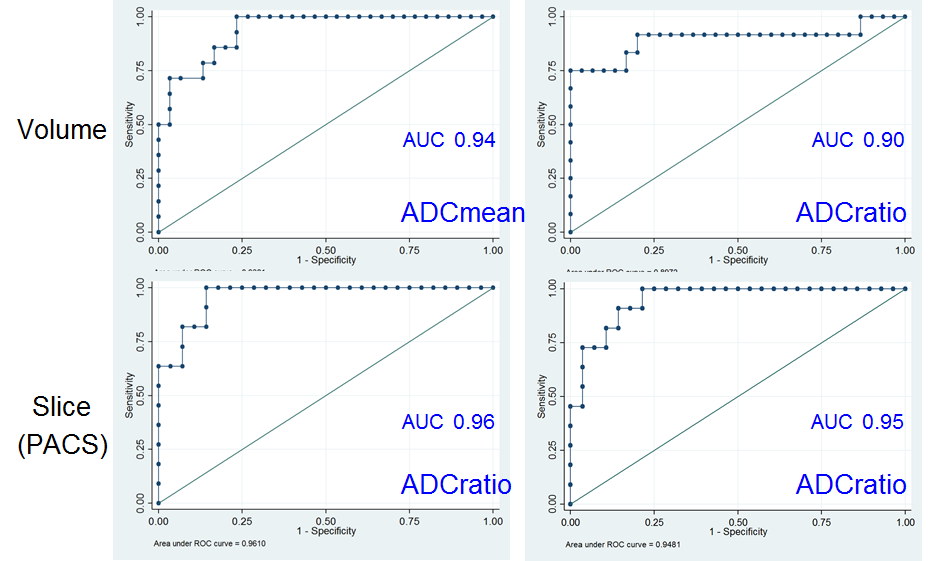
(i) IDHwt tumours showed significantly lower ADCmean and ADCratio than IDHmut_1p19q-int and IDHmut_1p19q-del in both volumetric and single-slice analyses (Fig.2). The ADC_values in the IDHmut_1p19q-int group were also significantly higher than in the IDHmut_1p19q-del group (3D: p=0.0047 for ADCmean, p=0.0054 for ADCratio; 2D: p=0.0008 for ADCratio_observer_1, p=0.0025 for ADCratio_observer_2). The ICC showed a very high intra-rater agreement (0.98 for correlation and consistency ICC) with no systematic differences (correlation-of-measurements=consistency-agreement) between observers but 2D ADCratio was slightly systematically higher than volumetric ADCratio (correlation ICC=0.89(0.88) for observer_1(observer_2), consistency ICC=0.93(0.92) for observer_1(observer_2)). (ii) The AUC ranged from 0.90 to 0.96 for the various measurements (Fig.3). Cut-off points for the ADC_values are reported in Table2. The odds of IDHwt increase per unit variation in ADC_values were: 3D: 78% in ADCmean, 46% in ADCratio; 2D: 62% in ADCratio_observer_1 and 57% in ADCratio_observer_2.Discussion
Our ADC_values from routine clinical DWI highly significantly predicted non-enhancing glioma IDH status. Furthermore, ADCratio were closely reproducible between volumetric and single-slice ROI analyses. A consistent and valid association exists between glioma low ADC, increased cellularity and poor prognosis, supported by comparisons of diffusivity, histological specimens and clinical data in multiple studies[5,18–22]. Low diffusivity predicts poor astrocytoma survival independent from WHO grade[23], but no linear relation exists between ADC and prognosis[24]. Past studies to distinguish astrocytoma and oligodendroglioma using ADC values yielded variable success[25,26], and may have been influenced by the incomplete overlap between histological and molecular groups. The similarity of our volumetric and single-slice results could be explained by non-enhancing, non-necrotic glioma homogeneity. The accuracy of the single-slice ROI results for non-enhancing LGG IDH typing suggests that a PACS-derived ADCratio can complement advanced MR modalities such as perfusion and 2HG-spectroscopy[27,28] pending tissue diagnosis.Conclusions
ADC measurement appears to be a simple and powerful method for molecular subtyping of non-enhancing WHO II-III gliomas in accordance with the 2016 WHO classification, specifically to identify IDHwt neoplasms. In our patient cohort, a two-dimensional ROI measurement in the largest lesion cross-section appeared representative of the entire tumour with comparable accuracy.Acknowledgements
This study was supported by the National Institute for Health Research University College London Biomedical Research Centre.References
1. Pierallini A, Bonamini M, Bozzao A, et al (1997) Supratentorial diffuse astrocytic tumours: proposal of an MRI classification. Eur Radiol 7:395–399. doi: 10.1007/s003300050173
2. Watanabe M, Tanaka R, Takeda N (1992) Magnetic resonance imaging and histopathology of cerebral gliomas. Neuroradiology 34:463–469.
3. Tervonen O, Forbes G, Scheithauer BW, Dietz MJ (1992) Diffuse “fibrillary” astrocytomas: correlation of MRI features with histopathologic parameters and tumor grade. Neuroradiology 34:173–178.
4. Ideguchi M, Kajiwara K, Goto H, et al (2015) MRI findings and pathological features in early-stage glioblastoma. J Neurooncol 123:289–297. doi: 10.1007/s11060-015-1797-y
5. Cuccarini V, Erbetta A, Farinotti M, et al (2016) Advanced MRI may complement histological diagnosis of lower grade gliomas and help in predicting survival. J Neurooncol 126:279–288. doi: 10.1007/s11060-015-1960-5
6. Olar A, Raghunathan A, Albarracin CT, et al (2012) Absence of IDH1-R132H mutation predicts rapid progression of nonenhancing diffuse glioma in older adults. Ann Diagn Pathol 16:161–170. doi: 10.1016/j.anndiagpath.2011.08.010
7. Baehring JM, Bi WL, Bannykh S, et al (2007) Diffusion MRI in the early diagnosis of malignant glioma. J Neurooncol 82:221–225. doi: 10.1007/s11060-006-9273-3
8. Ginsberg LE, Fuller GN, Hashmi M, et al (1998) The significance of lack of MR contrast enhancement of supratentorial brain tumors in adults: histopathological evaluation of a series. Surg Neurol 49:436–440.
9. Seiz M, Freyschlag CF, Schenkel S, et al (2011) Management of patients with low-grade gliomas - a survey among German neurosurgical departments. Cent Eur Neurosurg 72:186–191. doi: 10.1055/s-0031-1275351
10. Khan OH, Mason W, Kongkham PN, et al (2016) Neurosurgical management of adult diffuse low grade gliomas in Canada: a multi-center survey. J Neurooncol 126:137–149. doi: 10.1007/s11060-015-1949-0
11. Dang L, White DW, Gross S, et al (2009) Cancer-associated IDH1 mutations produce 2-hydroxyglutarate. Nature 462:739–744. doi: 10.1038/nature08617
12. Louis DN, Perry A, Burger P, et al (2014) International Society Of Neuropathology--Haarlem consensus guidelines for nervous system tumor classification and grading. Brain Pathol Zurich Switz 24:429–435. doi: 10.1111/bpa.12171
13. Cancer Genome Atlas Research Network, Brat DJ, Verhaak RGW, et al (2015) Comprehensive, Integrative Genomic Analysis of Diffuse Lower-Grade Gliomas. N Engl J Med 372:2481–2498. doi: 10.1056/NEJMoa1402121
14. Patterson DM, Padhani AR, Collins DJ (2008) Technology insight: water diffusion MRI--a potential new biomarker of response to cancer therapy. Nat Clin Pract Oncol 5:220–233. doi: 10.1038/ncponc1073
15. Yushkevich PA, Piven J, Hazlett HC, et al (2006) User-guided 3D active contour segmentation of anatomical structures: significantly improved efficiency and reliability. NeuroImage 31:1116–1128. doi: 10.1016/j.neuroimage.2006.01.015
16. Jenkinson M, Beckmann CF, Behrens TEJ, et al (2012) FSL. NeuroImage 62:782–790. doi: 10.1016/j.neuroimage.2011.09.015
17. Jenkinson M, Bannister P, Brady M, Smith S (2002) Improved optimization for the robust and accurate linear registration and motion correction of brain images. NeuroImage 17:825–841.
18. Karavaeva E, Harris RJ, Leu K, et al (2015) Relationship Between [18F]FDOPA PET Uptake, Apparent Diffusion Coefficient (ADC), and Proliferation Rate in Recurrent Malignant Gliomas. Mol Imaging Biol MIB Off Publ Acad Mol Imaging 17:434–442. doi: 10.1007/s11307-014-0807-3
19. Fudaba H, Shimomura T, Abe T, et al (2014) Comparison of multiple parameters obtained on 3T pulsed arterial spin-labeling, diffusion tensor imaging, and MRS and the Ki-67 labeling index in evaluating glioma grading. AJNR Am J Neuroradiol 35:2091–2098. doi: 10.3174/ajnr.A4018
20. Ellingson BM, Malkin MG, Rand SD, et al (2010) Validation of functional diffusion maps (fDMs) as a biomarker for human glioma cellularity. J Magn Reson Imaging JMRI 31:538–548. doi: 10.1002/jmri.22068
21. Higano S, Yun X, Kumabe T, et al (2006) Malignant astrocytic tumors: clinical importance of apparent diffusion coefficient in prediction of grade and prognosis. Radiology 241:839–846. doi: 10.1148/radiol.2413051276
22. Miloushev VZ, Chow DS, Filippi CG (2015) Meta-analysis of diffusion metrics for the prediction of tumor grade in gliomas. AJNR Am J Neuroradiol 36:302–308. doi: 10.3174/ajnr.A4097
23. Zulfiqar M, Yousem DM, Lai H (2013) ADC values and prognosis of malignant astrocytomas: does lower ADC predict a worse prognosis independent of grade of tumor?--a meta-analysis. AJR Am J Roentgenol 200:624–629. doi: 10.2214/AJR.12.8679
24. Cui Y, Ma L, Chen X, et al (2014) Lower apparent diffusion coefficients indicate distinct prognosis in low-grade and high-grade glioma. J Neurooncol 119:377–385. doi: 10.1007/s11060-014-1490-6
25. Khayal IS, Vandenberg SR, Smith KJ, et al (2011) MRI apparent diffusion coefficient reflects histopathologic subtype, axonal disruption, and tumor fraction in diffuse-type grade II gliomas. Neuro-Oncol 13:1192–1201. doi: 10.1093/neuonc/nor122
26. Tozer DJ, Jäger HR, Danchaivijitr N, et al (2007) Apparent diffusion coefficient histograms may predict low-grade glioma subtype. NMR Biomed 20:49–57. doi: 10.1002/nbm.1091
27. Kickingereder P, Sahm F, Radbruch A, et al (2015) IDH mutation status is associated with a distinct hypoxia/angiogenesis transcriptome signature which is non-invasively predictable with rCBV imaging in human glioma. Sci Rep 5:16238. doi: 10.1038/srep16238
28. Andronesi OC, Rapalino O, Gerstner E, et al (2013) Detection of oncogenic IDH1 mutations using magnetic resonance spectroscopy of 2-hydroxyglutarate. J Clin Invest 123:3659–3663. doi: 10.1172/JCI67229
Figures