3080
Application of Reduced Field-of-View Diffusion-Weighted Imaging in Evaluation of Normal Pituitary Glands and Pituitary Macroadenomas1Department of Diagnostic Radiology, the First Affiliated Hospital of Xi’an Jiaotong University, Xi’an, China
Synopsis
Field-of-view optimized and constrained undistorted single-shot (FOCUS) imaging provides relatively high resolution images with few artifacts. However, application of this technique for evaluation of normal pituitary glands and pituitary macroadenomas has not been reported to date. The study aims to evaluate the image quality and value of FOCUS DWI in evaluation of normal pituitary glands and pituitary macroadenomas. Our results suggest that FOCUS DWI exhibited obviously superior image quality both in normal pituitary glands and macroadenomas in a clinically feasible scan time. Moreover, it might be helpful for evaluating the consistency of pituitary macroadenomas.
INTRODUCTION
Diffusion weighted imaging (DWI) can help assess the consistency of pituitary macroadenomas, evaluate the diffusivity of normal pituitary glands, and predict the success of surgical treatment.1,2 The most widely used EPI DWI technique has limitations such as low spatial resolution, strong susceptibility artifacts and distortion due to eddy currents in the sellar region.3 Recently, Field-of-view optimized and constrained undistorted single-shot (FOCUS) imaging provides relatively high resolution images with few artifacts. However, application of FOCUS DWI for evaluation of normal pituitary glands and pituitary macroadenomas has not been reported to date. The study aims to evaluate the image quality and value of FOCUS DWI in evaluation of normal pituitary glands and pituitary macroadenomas.METHODS
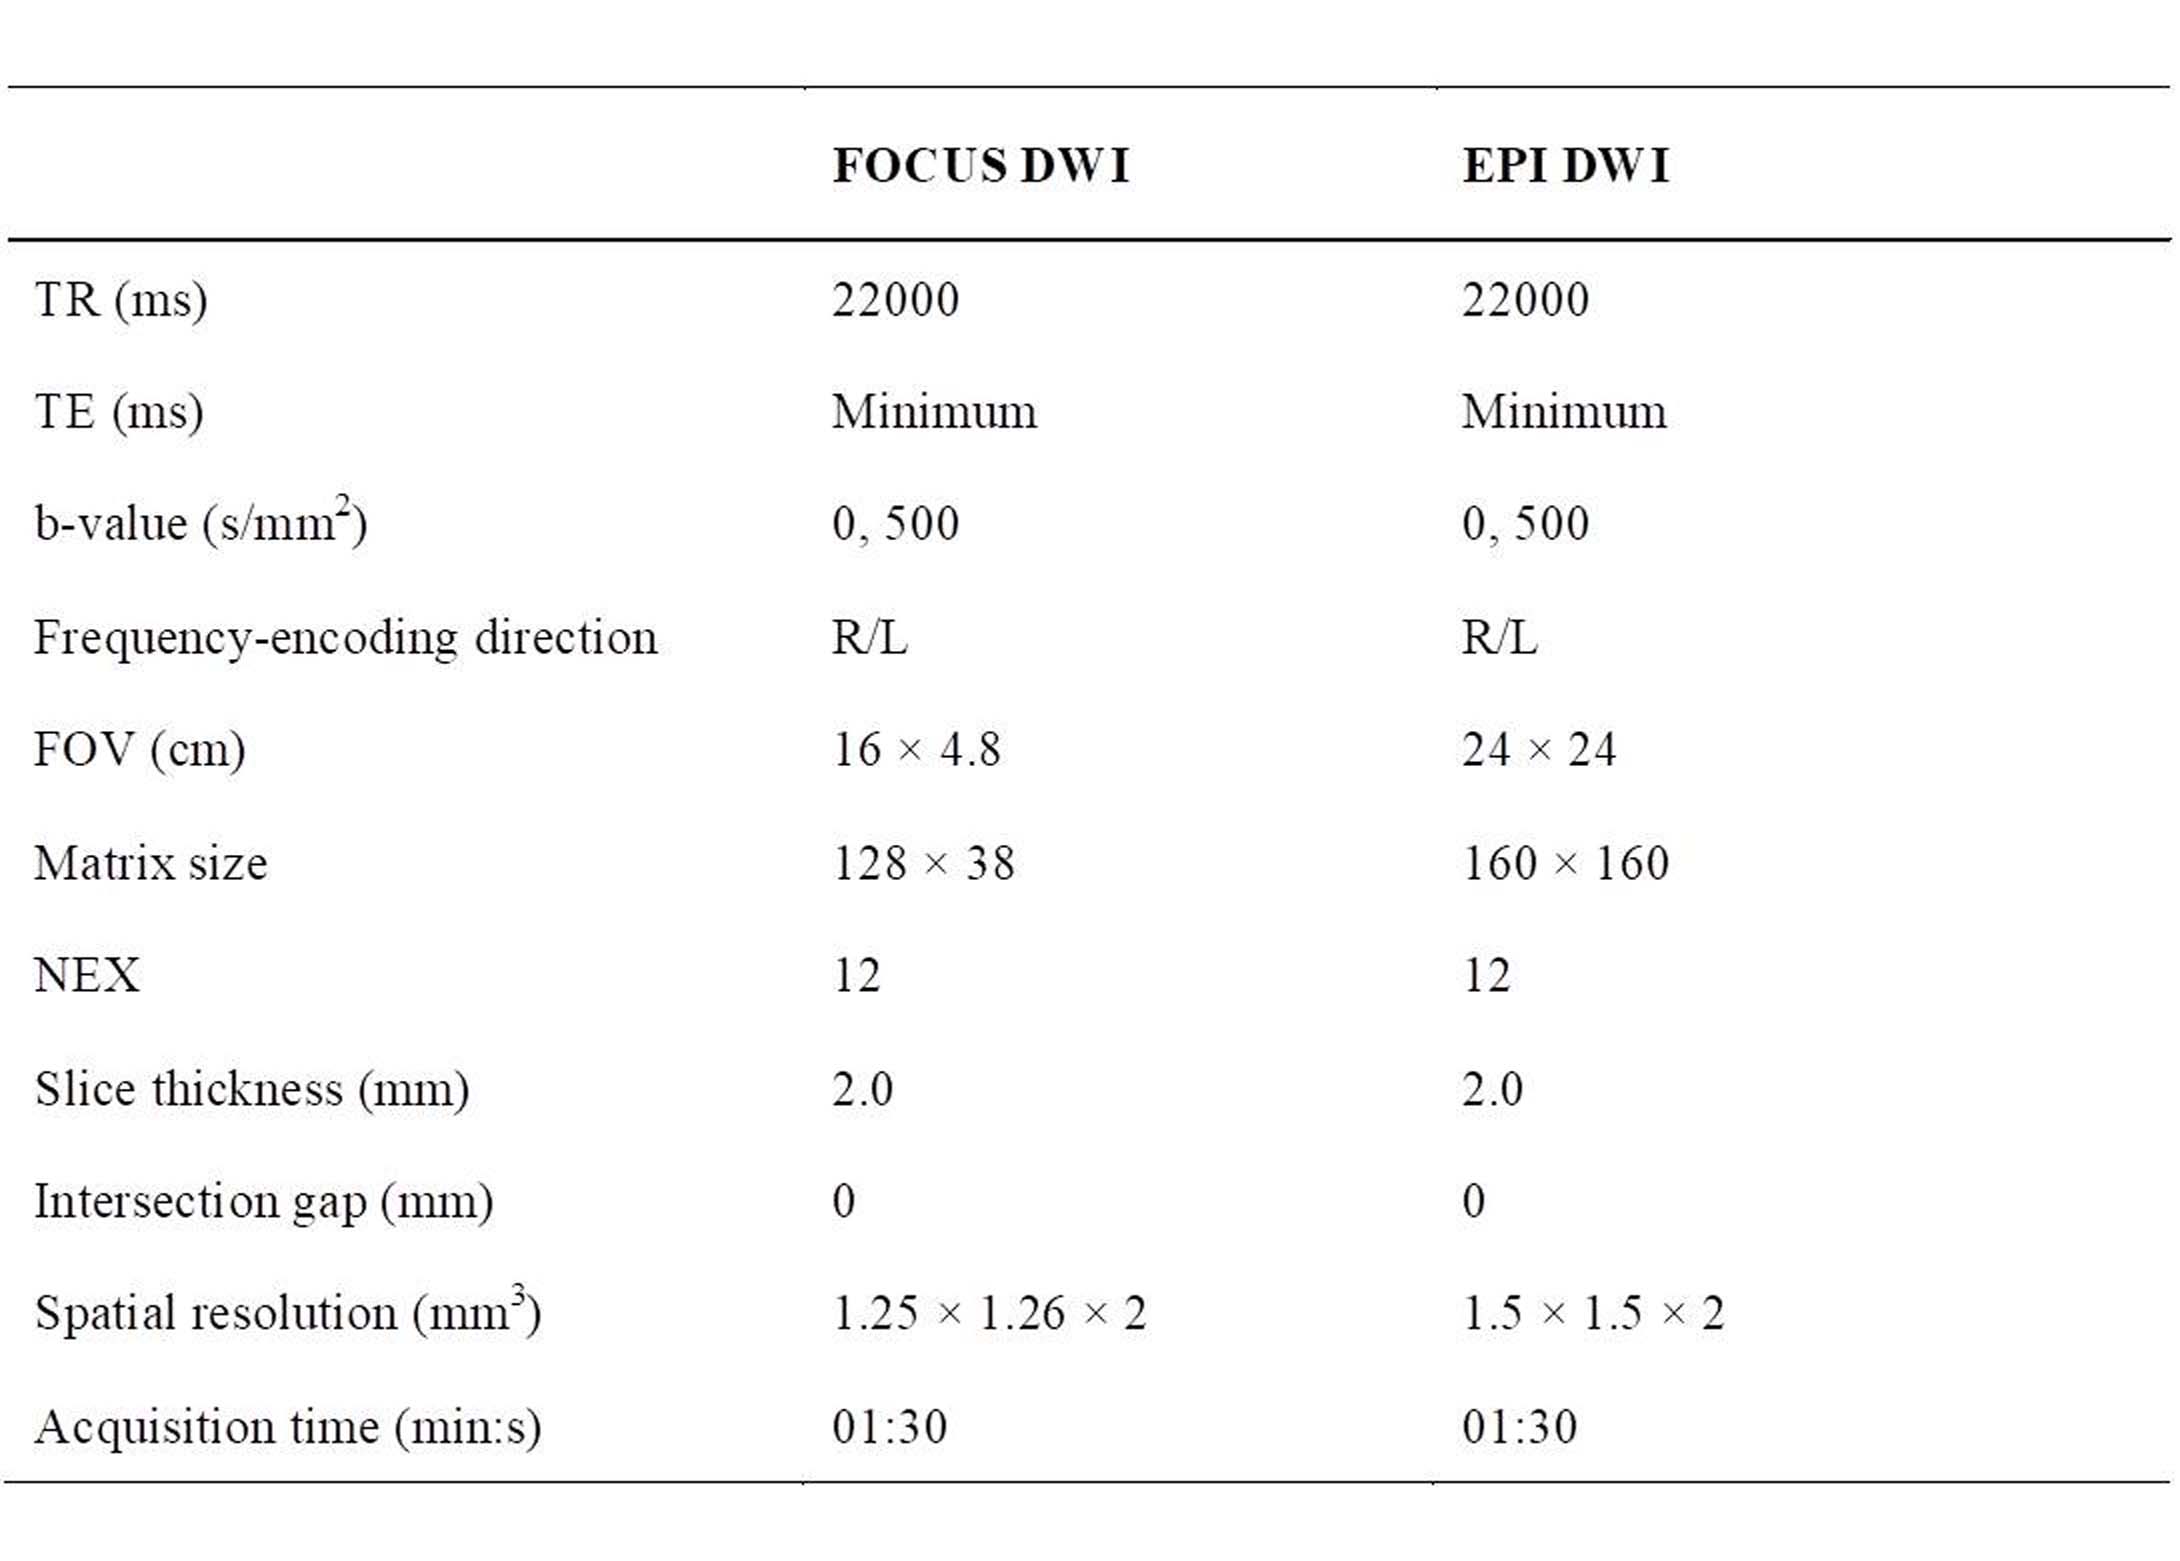
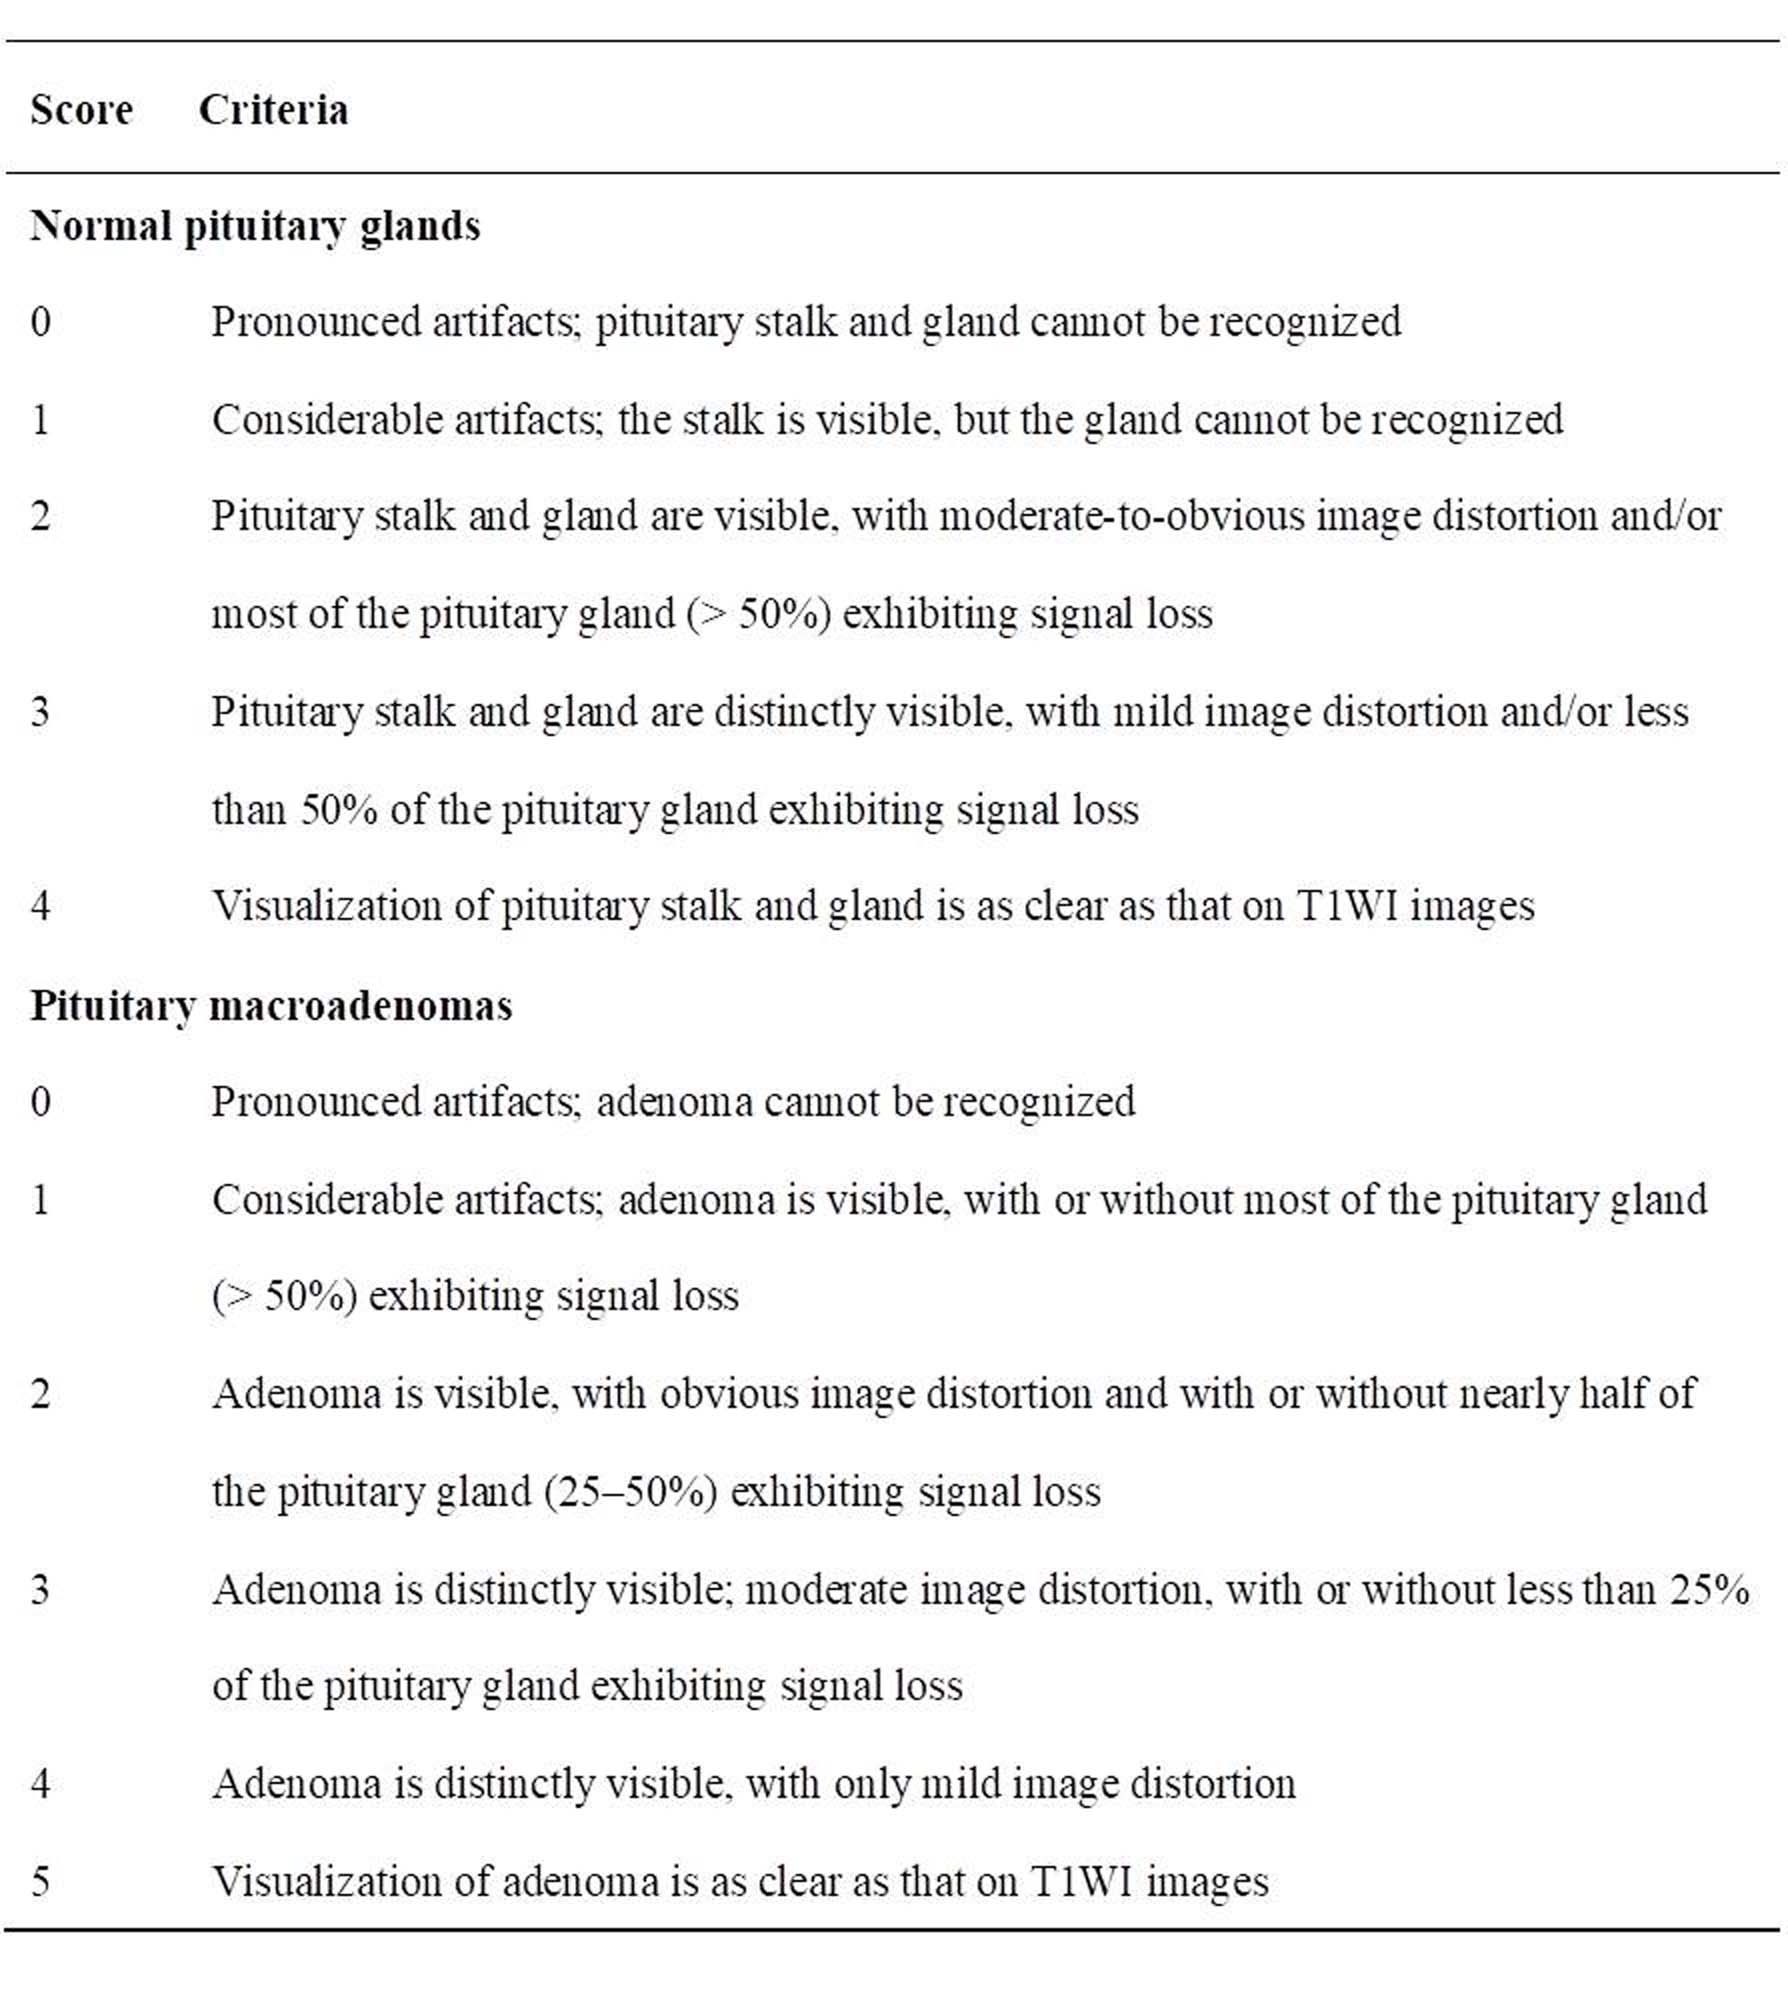
Subjects Healthy volunteers and patients with pituitary macroadenomas underwent FOCUS and EPI DWI were included. MRI Protocols All MR images were acquired using a 3.0T system (Discovery 750w, GE Healthcare, Milwaukee, WI, USA) with a 24-channel head coil. The protocols included sequences: sagittal and coronal T1WI (TR/TE = 400 ms/minimum; FOV = 20 cm×20 cm; slice thickness, 2 mm without intersection gap) and sagittal and coronal T2WI (TR/TE = 3880/128 ms; FOV = 18 cm×18 cm; slice thickness, 2 mm without intersection gap). In some patients, enhanced coronal T1WI were acquired after injection of 0.2 mmol/kg contrast medium (Gd-DTPA; Magnevist, Bayer Health Care, Berlin, Germany). Before Gd-DTPA administration, FOCUS and EPI DWI images were acquired in the coronal plane. Image acquisition parameters are presented in Table 1. Data and statistical analysis Two neuroradiologists graded image quality based on visualization of the normal pituitary stalk, pituitary gland, and pituitary macroadenomas (Table 2). Intra and interobserver agreement were assessed by kappa statistics. ROI-based apparent diffusion coefficient (ADC) values were placed on the anterior lobe of normal pituitary glands and solid appearance of macroadenomas. Image quality and ADCs were compared between the two methods by the paired Wilcoxon signed-rank test and t-test. Differences in ADC between normal pituitary glands and macroadenomas were analyzed by the independent-sample t-test. All statistical analysis were performed by using SPSS 19.0 (SPSS, Chicago, IL, USA); p<0.05 was considered as statistically significant difference.RESULTS
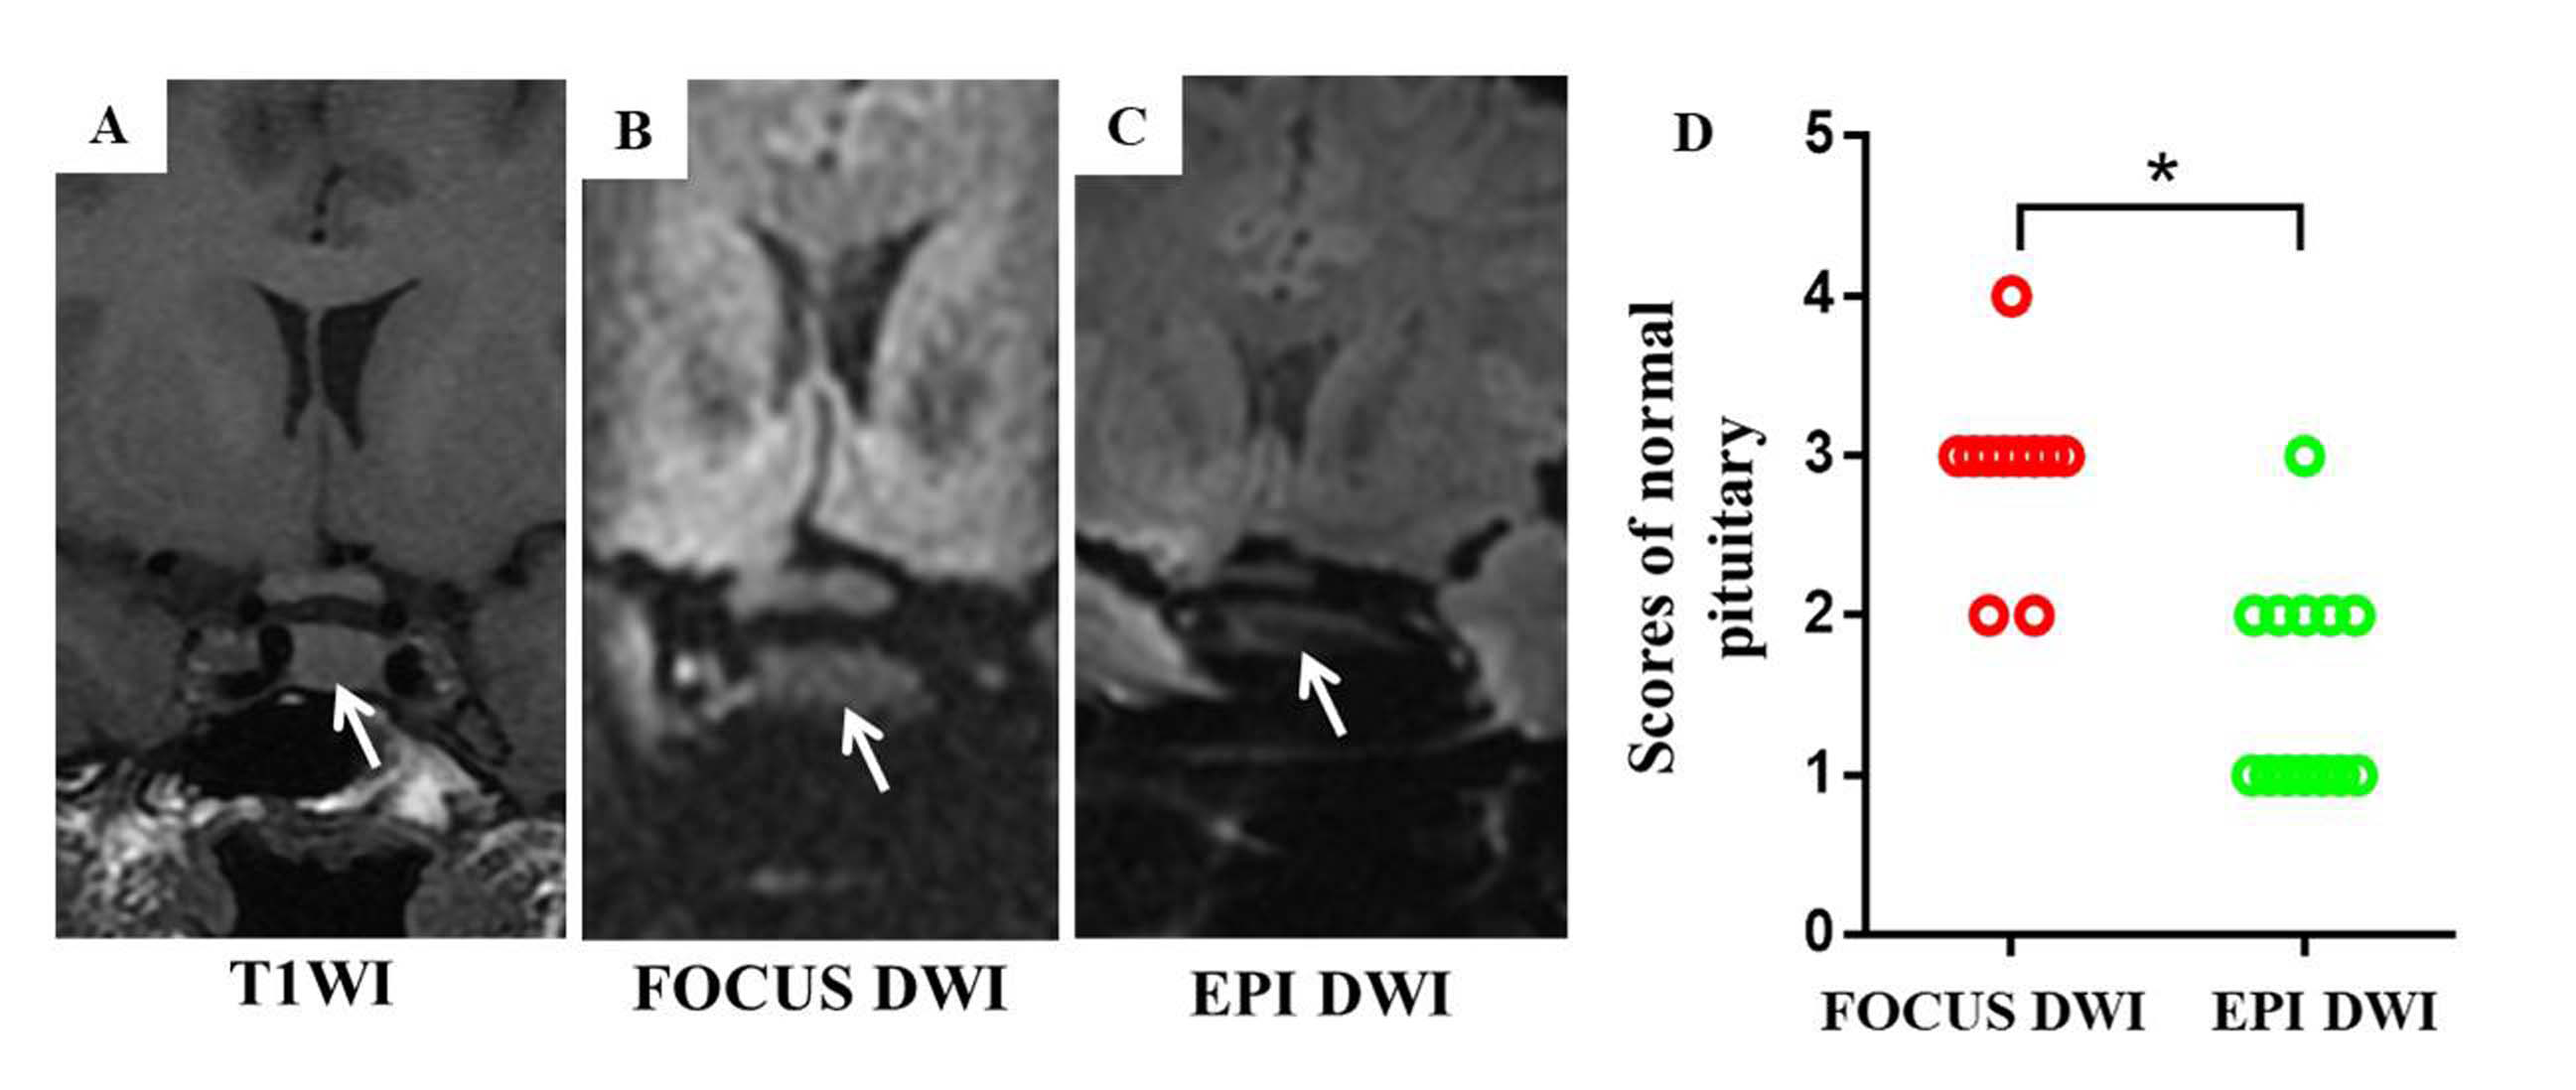
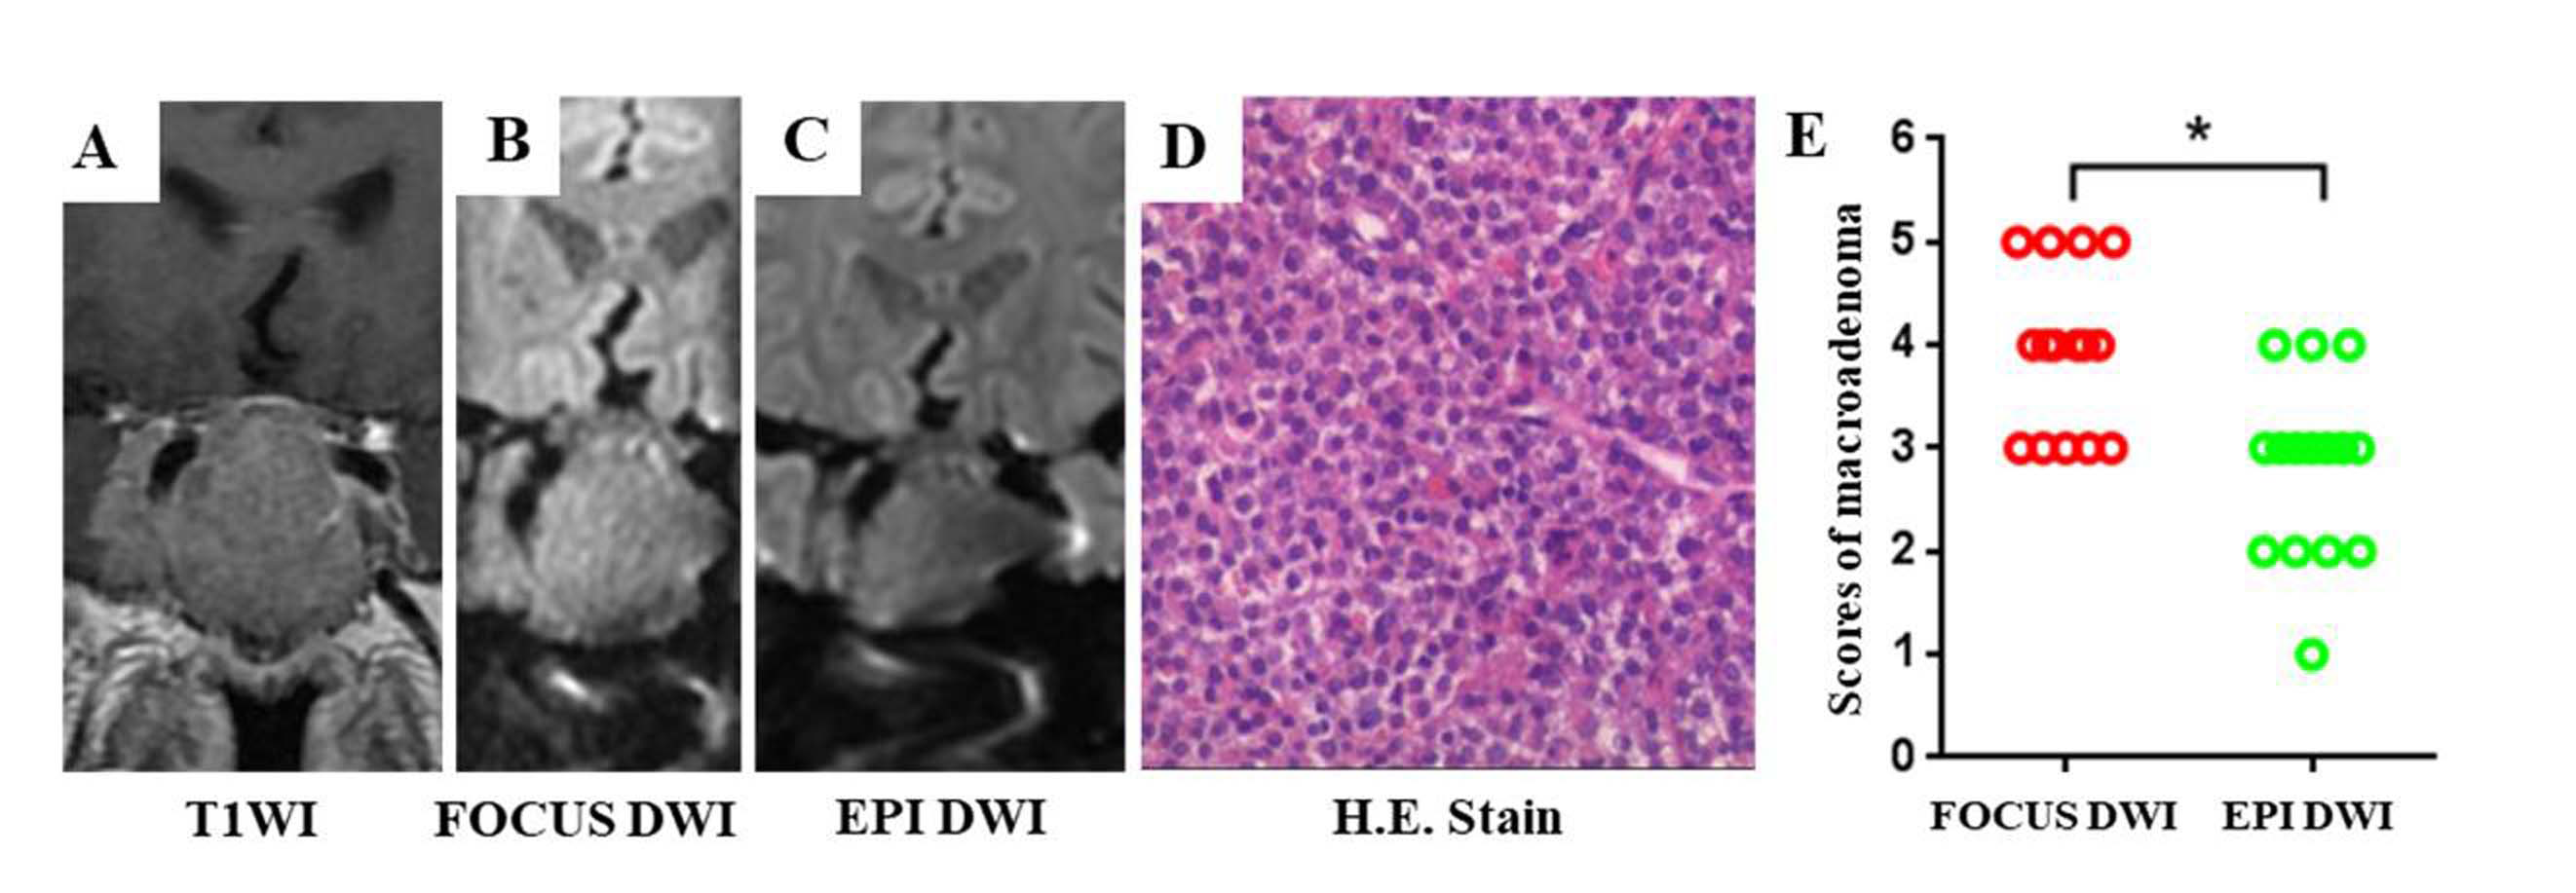
Thirteen healthy volunteers (male/female, 2/11; age range, 22-30 years) and fifteen patients (male/female, 8/7; age range, 28-73 years) were enrolled. All macroadenomas were considered as soft consistency after the operation and pathology staining. Intra and interobserver agreement for image quality assessment were moderate to substantial (kappa, 0.59~0.73, p<0.001). Relative to EPI DWI, FOCUS DWI exhibited obviously better image quality both in normal pituitary glands and macroadenomas (p<0.001). There was no significant difference in ADCs of macroadenomas between the two methods (p=0.085). Moreover, macroadenomas with soft consistency (0.79 ± 0.14 × 10⁻³ mm2/s) exhibited significantly lower mean ADC than normal pituitary glands (1.12 ± 0.19 × 10⁻³ mm2/s, p<0.001; Figure 1and 2).DISCUSSION
This study demonstrated that FOCUS DWI enables acquisition of high-resolution images of both normal pituitary glands and pituitary macroadenomas with fewer artifacts and less distortion than EPI DWI. Moreover, the diffusivity distribution of macroadenomas with soft consistency was lower than that of the anterior lobe of normal pituitary glands. Due to EPI DWI is vulnerable to the off-resonance effect, it has a severely limited capability for imaging the sellar region, especially in case of structures located near the skull base.4 In this study, EPI DWI images exhibited greater degrees of obvious artifacts, geometrical distortion, and signal loss than FOCUS DWI images. In terms of ADC values, lack of myelination and hypervascularity might contribute to diffusivity of normal pituitary glands.2 Since ROI-based measurement of both sequences evaluated the same bulk tumor, the macroadenoma would be presumed to have the same mean ADC. Furthermore, possible explanations for the low ADC of soft macroadenomas include increase in cellularity, reduction in extracellular space, and presence of cytoplasmic content with relatively high nucleus-to-cytoplasm ratio.5 Besides, low expression levels of laminin, fibronectin, reticulin, and type IV collagen in adenomatous pituitary tissues might also contribute to the low ADC.6CONCLUSION
FOCUS DWI helps acquire high-resolution images of normal pituitary glands and pituitary macroadenomas with relatively few susceptibility artifacts in a clinically feasible scan time. This sequence might be helpful for evaluating the consistency of pituitary macroadenomas.Acknowledgements
This study was supported by the National Key Research and Development Program of China (2016YFC0100300), National Natural Science Foundation of China (No. 81471631, 81771810 and 51706178), the 2011 New Century Excellent Talent Support Plan of the Ministry of Education, China (NCET-11-0438) and the Clinical Research Award of the First Affiliated Hospital of Xi’an Jiaotong University (No. XJTU1AF-CRF-2015-004).References
1. Boxerman JL, Rogg JM, Donahue JE, et al. Preoperative MRI evaluation of pituitary macroadenoma: imaging features predictive of successful transsphenoidal surgery. AJR Am J Roentgenol 2010;195:720-728
2. Hiwatashi A, Yoshiura T, Togao O, et al. Evaluation of diffusivity in the anterior lobe of the pituitary gland: 3D turbo field echo with diffusion-sensitized driven-equilibrium preparation. AJNR Am J Neuroradiol 2014;35:95-98
3. Le Bihan D, Poupon C, Amadon A, et al. Artifacts and pitfalls in diffusion MRI. J Magn Reson Imaging 2006;24:478-488
4. Yiping L, Hui L, Kun Z, et al. Diffusion-weighted imaging of the sellar region: a comparison study of BLADE and single-shot echo planar imaging sequences. Eur J Radiol 2014;83:1239-1244
5. Pierallini A, Caramia F, Falcone C, et al. Pituitary macroadenomas: preoperative evaluation of consistency with diffusion-weighted MR imaging--initial experience. Radiology 2006;239:223-231
6. Jarzembowski J, Lloyd R, McKeever P. Type IV collagen immunostaining is a simple, reliable diagnostic tool for distinguishing between adenomatous and normal pituitary glands. Archives Pathol Lab Med 2007;131:931-935
Figures