3073
Quantitative Data Analysis of in vivo Hyperpolarized 13C NMR Data: 1D vs 2D1Radiology and Nuclear Medicine, Radboud University Medical Center, Nijmegen, Netherlands, 2Applied Physics, TU Delft, Delft, Netherlands
Synopsis
13C-DNP hyperpolarization (HP) in MR allows for single shot detection of 13C-labeled metabolites in vivo. The dynamic acquisition of 13C MR signals after injection of a HP 13C-substrate results in a two-dimensional time-domain dataset. Often the 1D NMR time domain is fitted first and the results are fed into a kinetic model. We present a 2D method, in which all data points in both NMR and kinetic time dimensions are fitted simultaneously. This results in an improved accuracy for all determined kinetic parameters compared to the 1D method, in particular for low-SNR metabolites. CRBs are significantly smaller using 2D analysis.
Introduction
In human or animal applications of 13C-labeled compounds hyperpolarized (HP) by Dynamic Nuclear Polarization (DNP) single shot in vivo 13C NMR detection of these compounds is possible1. Dynamic acquisition of 13C signals after injection of a HP 13C-substrate results in a two-dimensional time-domain dataset (TD1: kinetic/metabolic time dimension and TD2: NMR time domain signal). Usually first the amplitudes of the NMR signals of the metabolites are fitted, and then these amplitudes are used in a kinetic model for fitting the kinetic parameters. This is a 1D method, since each NMR signal is fitted independent of the others. Alternatively it is possible to apply a 2D method, in which all data points of the complete 2D dataset are fitted in one process, as we presented for the first time using simulated data3. The aim of the present study is to demonstrate the advantage of 2D analysis to process in vivo data, for which we use results of HP [1-13C]pyruvate studies of prostate tumors in mice2.Methods
Experimental: All experiments were approved by the Animal Ethical Committee. LNCaP and PC3 prostate tumor cells were injected subcutaneously at the right hind leg of Balb/c nude mice until a tumor of 0.5 - 1 cm diameter was grown. [1-13C]pyruvate was hyperpolarized using DNP. After the mice were anesthesized, HP pyruvate (final concentration 80 mM) is injected intravenously. The 1H/13C NMR measurements were performed on a 7T MR system (Bruker, Clinscan) with a dedicated 13C/1H RF probe. The conversion of pyruvate into lactate was followed by measuring a 13C-FID every 2s (FA=30°) from a slice covering the tumor (Fig.1).
Steps for 1D data analysis: (1) jMRUI AMARES1,4,5 based fitting of the single NMR signal, obtained by summing all NMR signals of the HP dataset. (2) Batch fitting of the zero-order phases and metabolite amplitudes of all individual NMR signals of the dataset (again with AMARES), using fixed values of the first-order phase, metabolite frequencies and damping factors, obtained in the previous step. (3) Making an educated guess for starting values of the parameters, describing the kinetics of the HP compound. (4) Calculating (the first time with the starting values) theoretical values of the metabolite amplitudes by applying the ODE solver of the Scilab open-source software system6. (5) Updating in an iterative way the kinetic parameters with the Levenberg-Marquardt based Scilab function lsqrsolve, using in each iteration updated values of the differences between the theoretical and AMARES-produced metabolite amplitudes. (6) Obtaining estimations for the parameter statistical errors by calculating the Cramér-Rao bounds (CRBs).
Steps for 2D data analysis: [1] As in steps (1), (2), (3) and (4) above. [2] In essence as in step (5), now however in each iteration with updated values of the differences between theoretical NMR data points and the experimental data points. [3] To realize the previous step, the theoretical metabolite amplitudes, mentioned in step (4), now are used as inputs for a new function NMRmodel, which calculates theoretical values of all data points of the dataset. In this function the fitted zero-order phases and the fixed values of the first-order phase, the metabolite frequencies and damping factors, mentioned in step (2), are used. [4] As in step (6).
Results
Typical 13C NMR spectra obtained of the tumor after injecting HP [1-13C]pyruvate show resonances of pyruvate, pyruvate hydrate, alanine and lactate (Fig. 1B and 2). 1D and 2D data analysis was applied to low and high SNR data (Fig. 2) using a kinetic model (Fig. 3) with the following parameters: the metabolic exchange rates kpx (with p=pyruvate and x=lactate, alanine or pyruvate-hydrate), the amplitude u0 and blood relaxation time Tbl of the pyruvate input function and the RF flip-angle term1,2. For high SNR data the kinetic parameters derived via 1D and 2D analysis are almost equal, but are slightly different for low SNR data. However, the CRBs are lower for all determined parameters for the 2D analysis compared to the 1D analysis (Table 1). The relaxation time T1h of pyruvate-hydrate could be fitted for the high SNR dataset. Inspection of Fig. 4 (right) shows a clear difference for the 1D (AMARES) and 2D analysis of the low SNR metabolites alanine and pyruvate hydrate. The CRBs for such metabolites are significantly smaller in 2D than in 1D. Remarkable is that the fit shows a lower RF flip angle than the intended 30 degrees.Conclusion
We demonstrate a 2D method that improves the analysis of dynamic HP data in vivo, in particular to increase the accuracy of the kinetic parameters for low-SNR downstream metabolites.Acknowledgements
No acknowledgement found.References
[1]Brindle K e,a, Magn Res Med 66:505–519 (2011)
[2]Van
Heijster,F.,e.a.ISMRMBenelux2017-O005(2017)
[3]Van Ormondt,D,.e.a.,ISMRMBenelux2017-P015(2017)
[4]Stefan,D.,e.a.,Meas. Sci. Technol.,20(2009)
[5]Vanhamme,L.e.a.,J. Magn. Res.,129(1997)
[6]Scilab,http://www.scilab.org(2017)
Figures
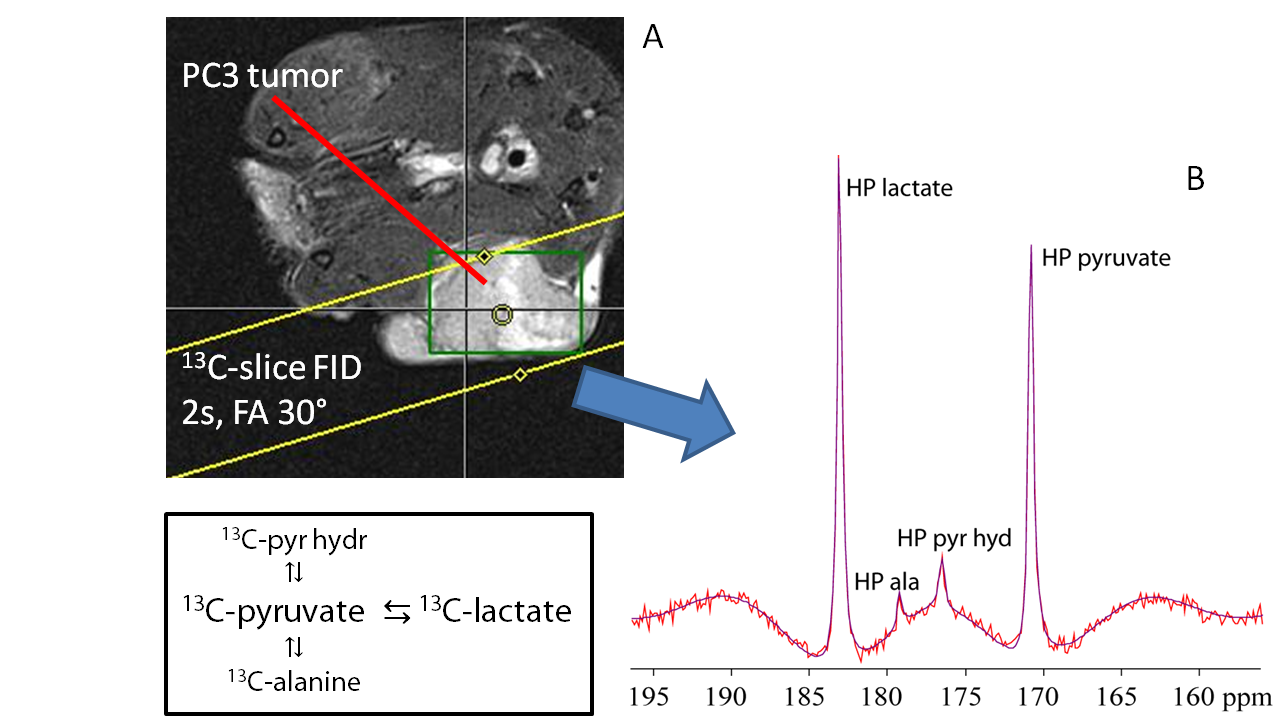
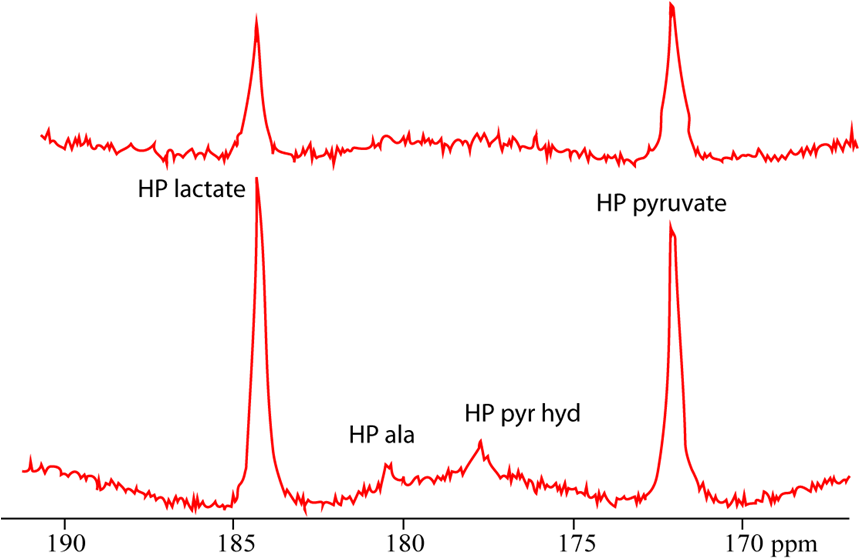
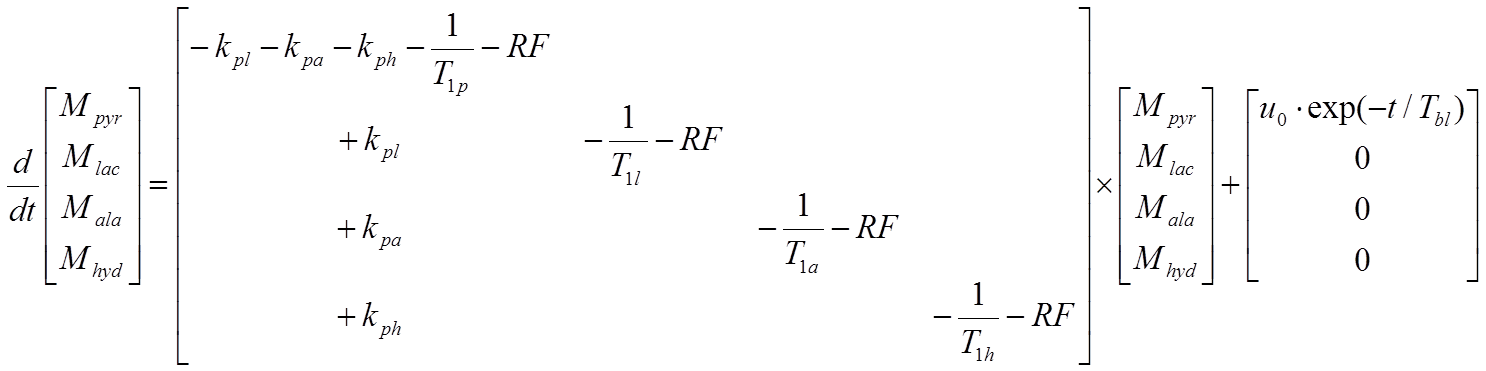
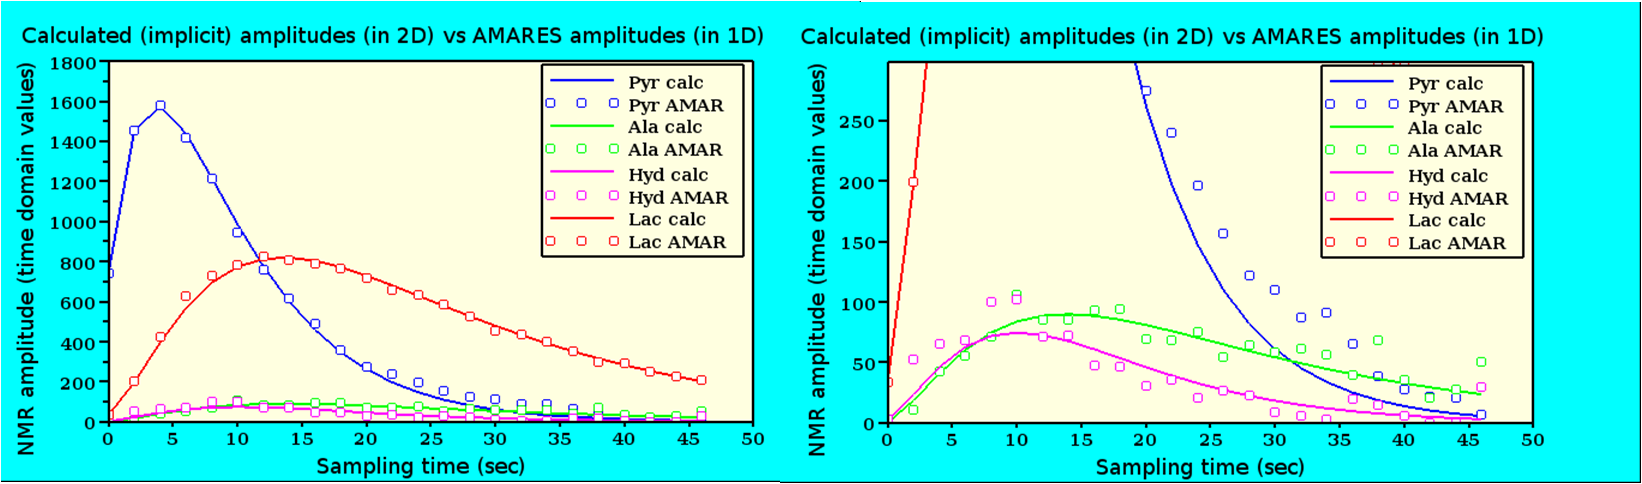
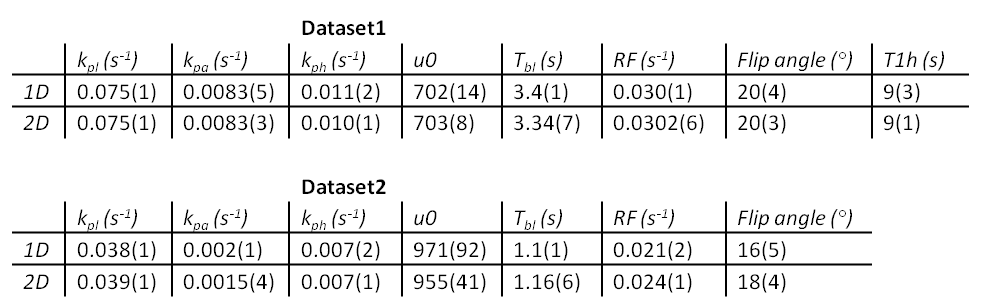
Table 1: Kinetic parameters of two datasets. SNR1 > SNR2. Flip angle is calculated from corresponding RF term.