3070
Multiscale Imaging of Breast Cancer Metabolism using Fluorescence Lifetime Imaging Microscopy and Hyperpolarized Magnetic Resonance Spectroscopy11111 Highland Ave., University of Wisconsin, Madison, WI, United States, 2University of Wisconsin, Madison, WI, United States
Synopsis
Every day in the U.S. 100 women die of metastatic breast cancer. Current clinical methods cannot determine from the primary site which tumors will metastasize and spread to other areas of the body. Herein, multiple imaging scales are used to assess the metabolic signatures of metastatic and dormant tumor cell lines. Fluorescence lifetime imaging microscopy (FLIM) and hyperpolarized magnetic resonance spectroscopy (hMRS) imaging studies are performed in 3D cell culture using an MRI compatible bioreactor and in vivo mouse models to evaluate metabolic signatures at the individual cellular and tumor mass scales to predict metastasis versus dormancy.
Introduction
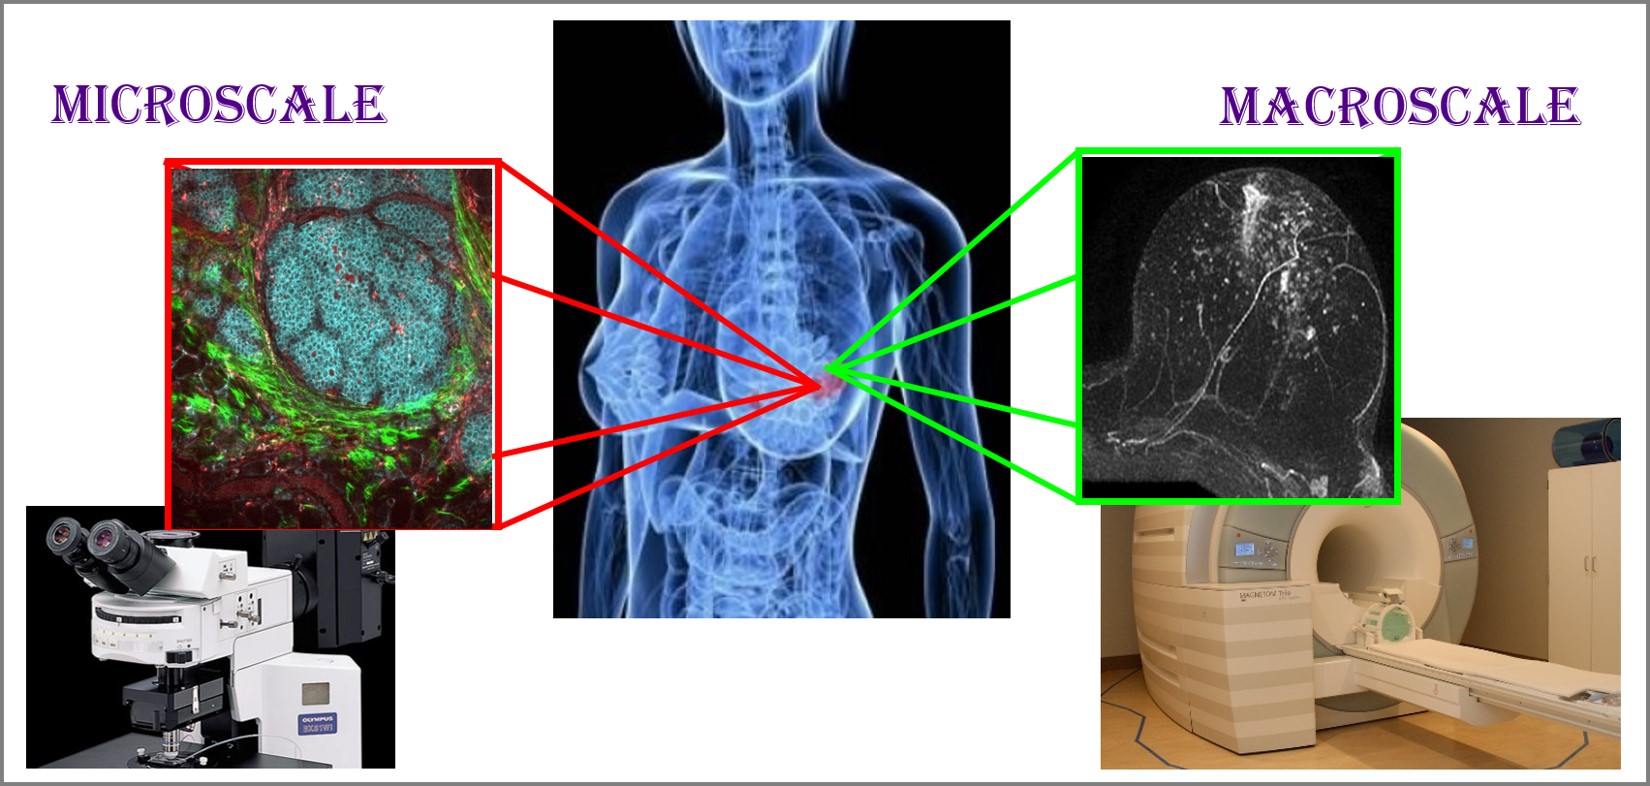
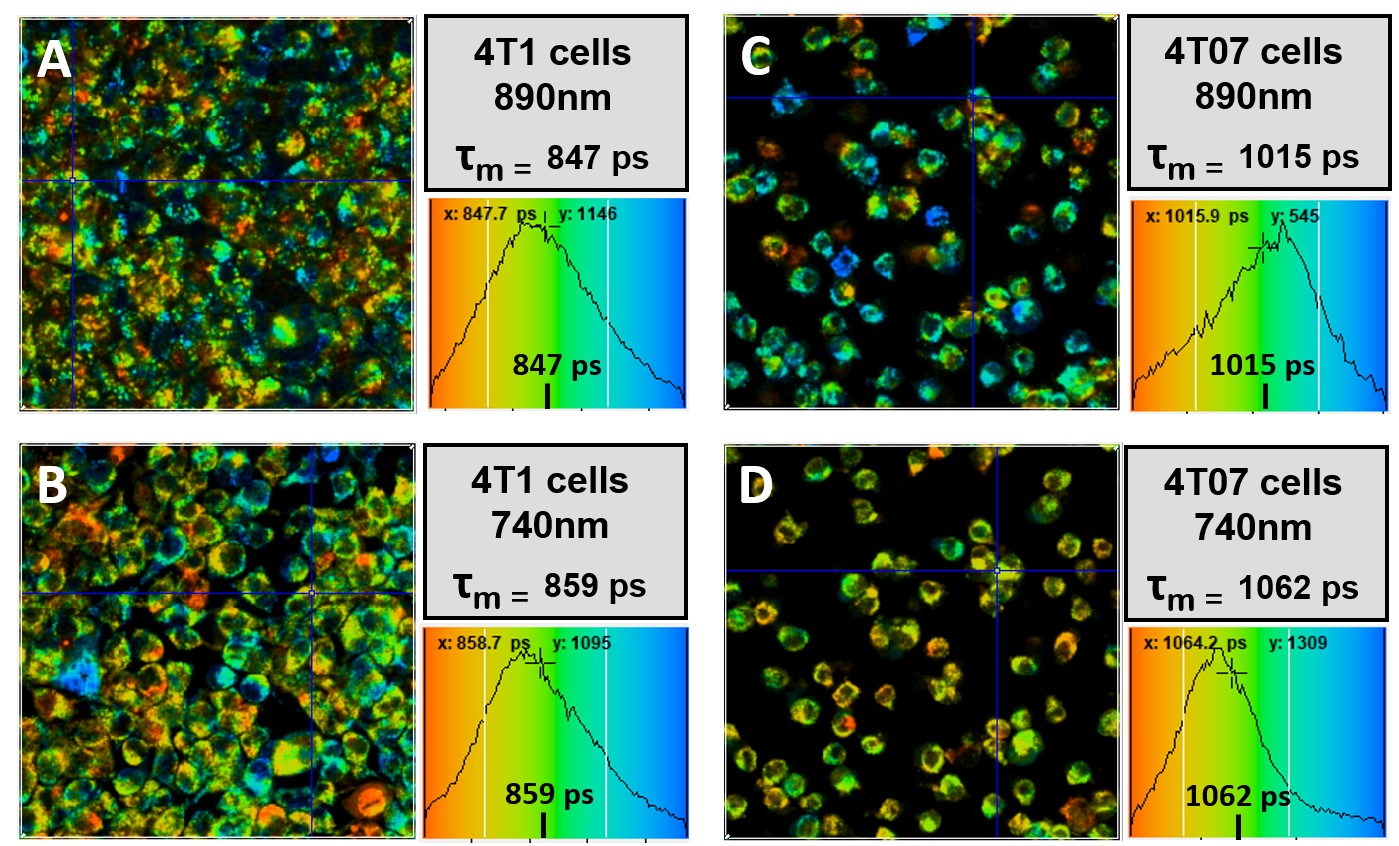
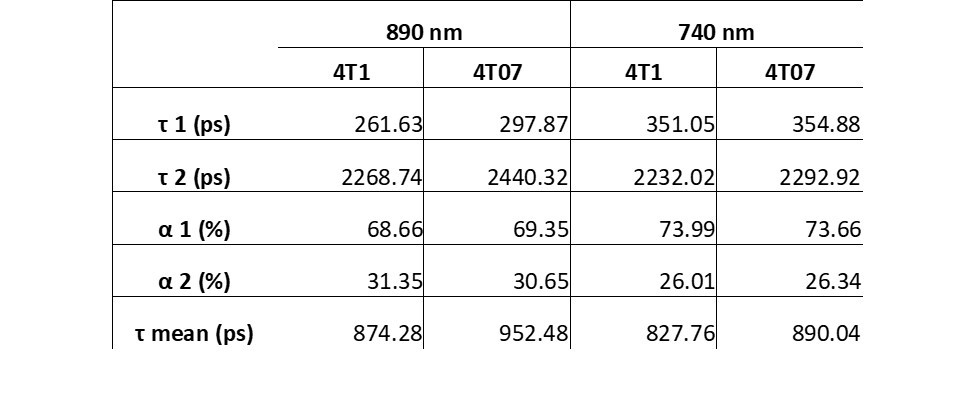
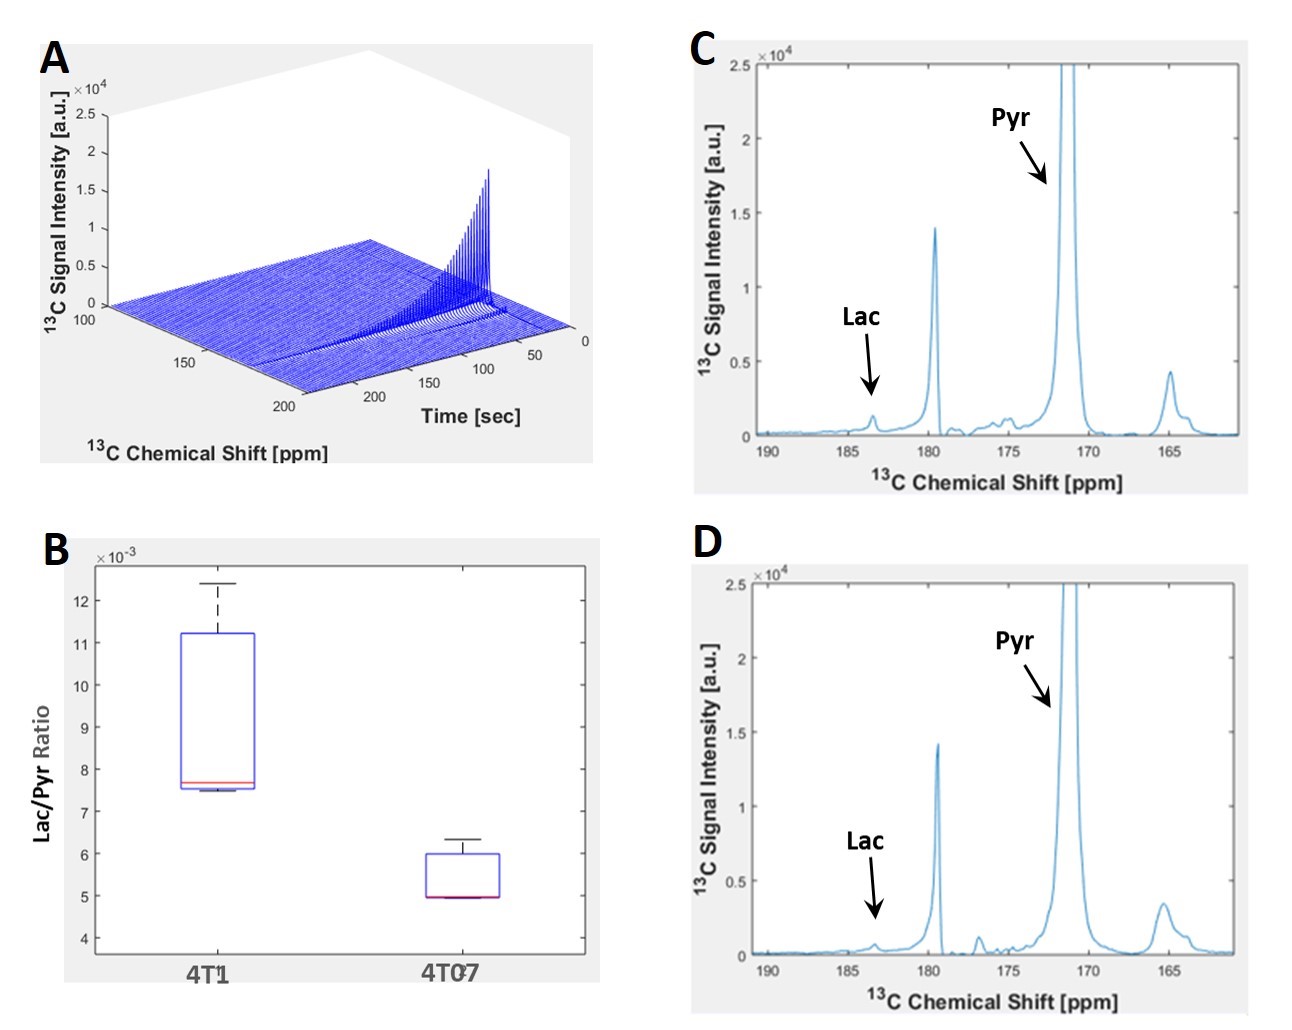
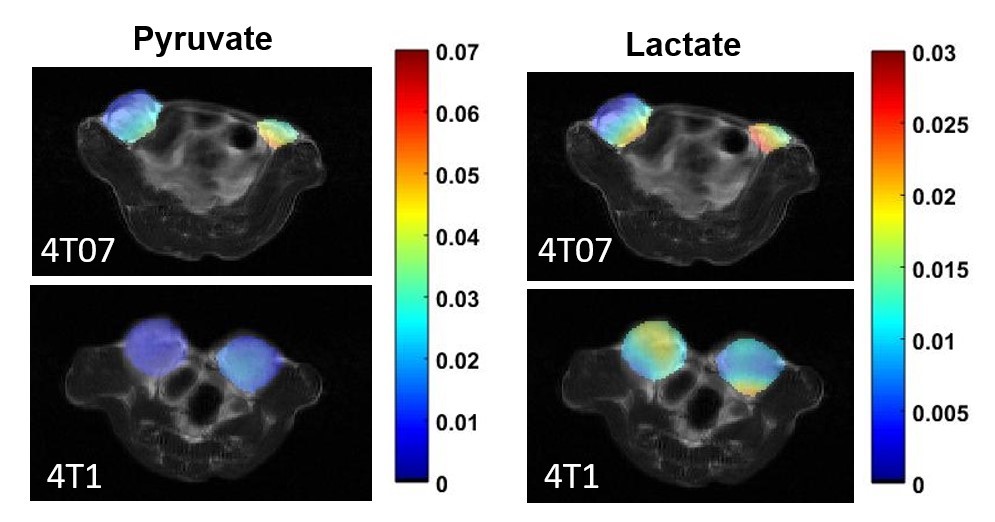
INTRODUCTION Novel imaging techniques are crucial for the prediction of cancer mortality based on metastasis. This study aims to develop a clinically relevant imaging platform (Figure 1), which combines information at micro- and macro- scales to discriminate which tumors are likely to metastasize. Fluorescence lifetime imaging microscopy (FLIM) and hyperpolarized magnetic resonance spectroscopy (hMRS) imaging studies are performed in 3D cell culture using an MRI compatible bioreactor1 and in vivo mouse models to evaluate metabolic signature at the individual cellular and tumor mass scales to predict metastasis versus dormancy. METHODS 4T1 (metastatic) and 4T07 (dormant) cell lines were cultured in RPMI 1640 media with 10% fetal bovine serum at 37 °C with 5% CO2. 3D collagen gels (1.5 mL) were prepared the day of imaging using ~8 million cells per gel at 2 mg/mL collagen density. Multiscale imaging using both FLIM and MRS was performed in the 3D cell cultures maintained at 35-37 °C using an MRI compatible bioreactor designed and built in house. FLIM was performed using the Optical Workstation (LOCI, UW-Madison) described previously.2 Each fluorescence lifetime image was collected for 150 seconds using a 20x VC objective (Nikon), and the FLIM data was fitted and analyzed using SPC Image (Becker and Hickl). MRS experiments were performed in vitro using [1- 13C] pyruvic acid as the hyperpolarized agent. During scanning, dynamic spectra were acquired (FA=10degrees, TR=3000ms), centered on the frequency for pyruvate. Thirty µL of [1- 13C] PA (Cambridge Isotope Laboratories Inc., Tewksbury, MA) and 15mM trityl radical (Ox063, GE Healthcare) were polarized at 1.4 K in a Hypersense polarizer (Oxford Instruments) for ~1 hour. Four mL of solvent containing 1.2mL 426 mM NaOH, 1.4mL 400 mM Tris buffer and 1.4mL 250mg/L EDTA was used to dissolute the sample. The [1-13C] PA was drawn off and rapidly injected into the sample volume of the bioreactor or the mouse using a tail vein cannulation. Dynamic global spectra were acquired with a Doty volume coil All animal studies were approved by and adhered to IAUCUC guidelines. For mouse studies, 500,000 cells (either 4T1 or 4T07) were injected into the mammary fat pad of Balb/c mice and allowed to form tumors for 23 days. The mice were anesthetized using isofluorane during imaging studies. A tail vein cannulation was used for injection of the hyperpolarized contrast agent for magnetic resonance studies. RESULTS Figure 2 shows Fluorescence lifetime imaging microscopy (FLIM) images of metastatic (4T1) and dormant (4T07) murine breast cancer cells. The 4T1 cells are shown in A and B were imaged at 890 and 740 nm for FAD and NADH, respectively, and the 4T07 cells are shown in C and D imaged at 890 and 740 nm for FAD and NADH, respectively. At both wavelengths, the mean lifetime was greater in the 4T07 cells than the 4T1 cells. The average values of the fluorescent lifetime components (τ1, τ2, α1, α2, τ mean) are summarized in Table 2. The average τ mean was greater for 4T07 cells than 4T1 cells at both wavelengths. Figure 3 shows the hyperpolarized magnetic resonance spectra of 4T1 and 4T07 cells in vitro. The pyruvate hydrate peak is visible at ~180 ppm and the lactate can be seen as a very small peak to the left of the pyruvate hydrate. The lactate peak is higher in 4T1 cells than 4T07 indicating a greater pyruvate to lactate conversion. A preliminary study was performed using two mice who were imaged, one injected with 4T1 (metastatic) and the other with 4T07 (dormant) cells. A volume coil encompassing the entire mouse was used to perform standard proton imaging (for anatomical reference) followed by hyperpolarized 13C-pyruvate imaging. The pyruvate and lactate signals from the tumors are presented as overlays on the anatomical proton images. The images indicate differences in the in vivo metabolic signatures between dormant (4T07) and metastatic (4T1) cancer cell lines that are consistent with. DISCUSION The results presented here show preliminary data from multiple imaging scales which indicate different metabolic signatures from metastatic and dormant cells. FLIM data shows that the mean fluorescent lifetime is greater in 4T07 cells 4T1 cells. MRS spectra show that the pyruvate to lactate conversion is greater in 4T1 cells than 4T07 cells. Future studies will be performed in vivo using an imaging window3 to image the same tumor with FLIM and MRS in live mice. CONCLUSION This study aimed to combine imaging methods at multiple scales which could be used to predict metastasis and improve patient outcomes.Acknowledgements
Funding for this project was provided by The Morgridge Institute for Research, the Departments of Medical Physics and Radiology at UW-Madison, UL1TR000427 to UW ICTR from NIH/NCATS and the AAPM 2014 Graduate Fellowship.References
(1) Cox, et al. Bioreactor for in vitro optical fluorescence and magnetic resonance spectroscopy. ISMRM, 2017.
(2) Pugh, et al. A shift in energy metabolism anticipates the onset of sarcopenia in rhesus monkeys. PMC 2014.
(3) Szulczewski, et al. In Vivo Visualization of Stromal Macrophages via label-free FLIM-based metabolite imaging. Scientific Reports, 2016.
Figures