3067
Dynamic Hyperpolarized 13C MRSI using the SPICE technique: A feasibility study1Department of Electrical and Electronic Engineering, Yonsei University, Seoul, Republic of Korea, 2Yonsei University College of Medicine, Seoul, Republic of Korea, 3Yonsei Biomedical Science Institute, College of Medicine, Yonsei University, Seoul, Republic of Korea
Synopsis
In this study, we investigated the use of SPICE (SPectroscopic Imaging by exploiting spatiospectral CorrElation) technique for dynamic hyperpolarized 13C MRSI by in vitro phantom experiment and in vivo mouse experiment. In vitro phantom experiment, the dynamic images from SPICE were compared to the dynamic data from FIDCSI. In vivo experiment, the dynamic images were acquired in normal and high fat diet (HFD) mouse kidney.
Introduction
Hyperpolarized 13C MRSI allows to image metabolic substrates in vivo with increased SNR. Among hyperpolarized 13C substrates, the metabolic conversion rate of pyruvate to lactate is correlated with cancer metabolism1. Therefore, the conversion rate (Kp) has been studied by incorporating with fast imaging2,3. However, it is still challenging to acquire dynamic images with high spatial resolution. The SPICE (SPectroscopic Imaging by exploiting spatiospectral CorrElation) technique which has been developed for 1H MRSI capable of rapid MRSI by utilizing the partially separability of spatial and spectral functions, allowing acquisition of high spatial and/or spectral resolution CSI4. Here, we investigated the use of SPICE for dynamic hyperpolarized 13C MRSI by in vitro phantom experiment and in vivo mouse experiment.
Methods
[SPICE Reconstruction and Pulse Sequence]
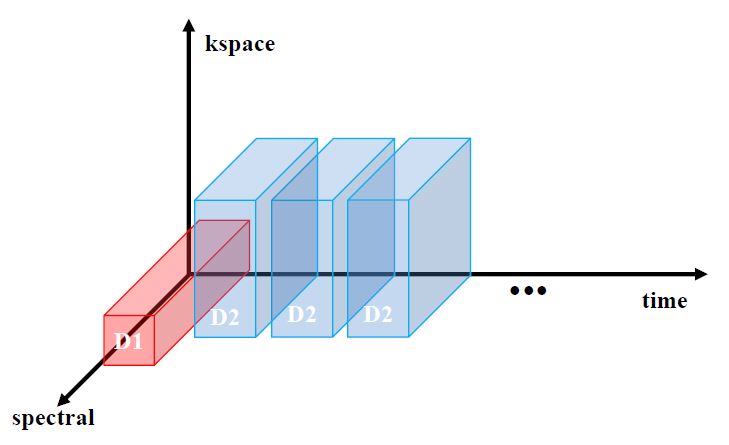
To apply the SPICE method, two dataset were acquired; 1. D1 dataset (D1 obtains the temporal basis over the FOV) using a low spatial and high spectral resolution centric ordered free induction decay chemical shift imaging (FIDCSI) sequence 2. D2 dataset (D2 obtains the spatial coefficients for the D1 temporal basis) using a high spatial and low spectral resolution echo-planar spectroscopic imaging (EPSI) sequence with bipolar readout gradient. To acquire dynamic imaging, D2 dataset were acquired for 10 repetitions (Fig.1). After data acquisition, the D1 dataset was decomposed using singular value decomposition (SVD) to obtain the temporal basis. The spatial coefficients of each D2 dataset were reconstructed with locally low rank (LLR) regularization5 of local size 4x4 on the temporal basis and each D2 dataset. Using the acquired temporal basis and spatial coefficients, the spectroscopic dynamic images were reconstructed:
$$\hat{\alpha} = min_\alpha\frac{1}{2}||d_2-F\left\{\phi_k\alpha\right\}||_2^2 + \lambda\sum_r||R_r(\alpha)||_{\star}$$
d2 is the kspace of D2 dataset, F is Fourier transform, ΦK is temporal basis obtained from D1 dataset, α is spatial coefficients, λ is regularization parameter, Rr extracts a block of size r x r from spatial coefficients α. The nuclear norm is used which represents the sum of singular values from the extracted block to reduce the complexity of minimization problem5.
[In vitro experiment: vial enzyme phantom]
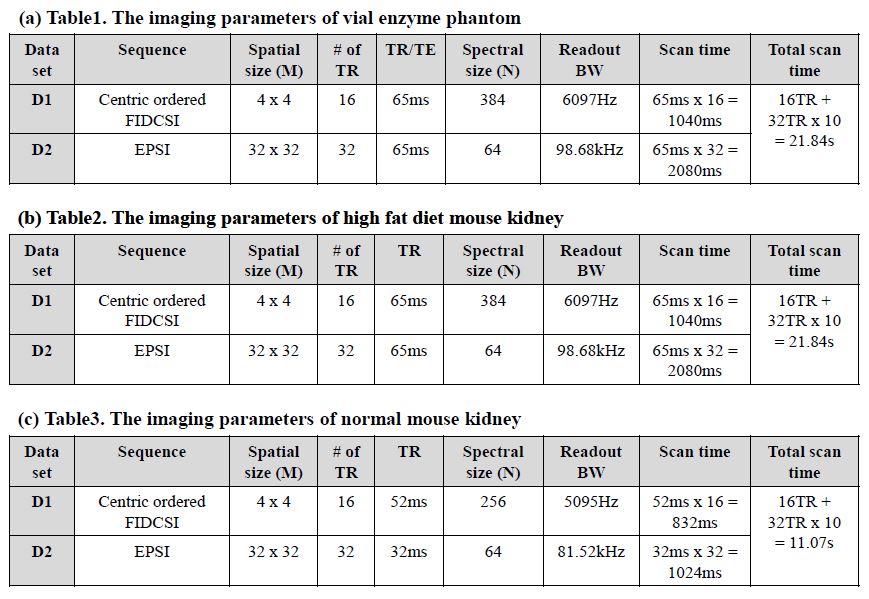
Single voxel dynamic FIDCSI experiment and dynamic SPICE experiment were carried out under the same vial phantom conditions to verify the feasibility of Kp (reaction constant of the pyruvate to lactate) value estimation from SPICE data. Vial phantom with one 15ml Falcon tube filled with fivefold concentrated phosphate buffered saline (PBS) at 14ml, nicotinamide adenine dinucleotide (NADH) at 4.4 mM (Sigma-Aldrich, Gillingham, UK) and LDH from rabbit muscle at 120U (Sigma-Aldrich, Gillingham, UK) was set6. 1ml of the hyperpolarized solution was injected to Falcon tube. In single voxel dynamic FIDCSI experiment, TE/TR 27/1000ms, FOV 30x30mm2, slice thickness 60mm, matrix size 1x1, spectral bandwidth 6510Hz, FID points 2048, flip angle 5°. Dynamic pyruvate and lactate curves used to Kp value estimation. In dynamic SPICE experiment, FOV 30x30mm2, slice thickness 30mm, flip angle 5°. The rank of the temporal basis was set to 5. The imaging parameters for FIDCSI and EPSI were set as in Table 1.
[In vivo experiment: mouse kidney]
Dynamic SPICE experiments were carried out on high fat diet (HFD) and normal mouse. In HFD mouse kidney, FOV 40x40mm2, slice thickness 14mm, flip angle 5°. The imaging parameters for FIDCSI and EPSI were set as in Table 2. The rank of the temporal basis was set to 6. In normal mouse kidney, FOV 32x32mm2, slice thickness 5mm, flip angle 5°. The imaging parameters for FIDCSI and EPSI were set as in Table 3. The rank of the temporal basis was set to 5.
Results
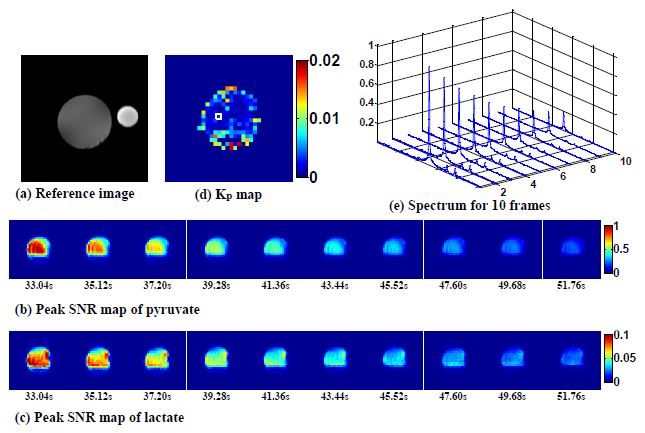
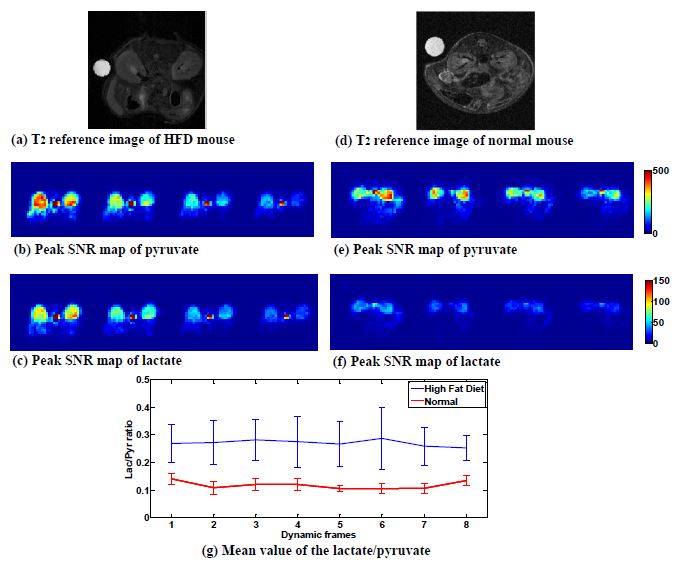
In the vial enzyme phantom, peak SNR map of pyruvate and lactate for 10 dynamic frames are shown in Fig. 2b and Fig. 2c. The signal decay during the dynamic frames was used to estimate Kp in Fig. 2d. The fitted Kp of single voxel dynamic was 0.0020. The average of fitted Kp which was masked for values from 0 to 0.02 was 0.0027. In vivo mouse kidney, peak SNR map of pyruvate and lactate for 4 dynamic frames are shown in Fig. 3b, Fig. 3c, Fig.3e and Fig. 3f. Time evolution of the metabolites can be seen with high spatial resolution. HFD mouse showed elevated lactate compared to normal mouse for the given time frame data in Fig. 3g.Conclusion
The SPICE technique can be effectively used for high resolution dynamic MRSI with reduced scan time. Phantom studies show that Kp can be reliably estimated using the technique. Further studies using in in vivo estimation of Kp are underway.Acknowledgements
This research was supported by a grant of the Korea Health Technology R&D Project through the Korea Health Industry Development Institute (KHIDI), funded by the Ministry of Health & Welfare, Republic of Korea (grant number : HI15C2422)References
1. Matthew L. Zierhut, YHi-Fen Yen, Albert P. Chen, et al. Kinetic modeling of hyperpolarized [1-13C]-pyruvate metabolism in normal rats and TRAMP mice. JMR. 2010;202:86-92
2. Wenwen Jiang, Michael Lustig, and Peder E. Z. Larson. Concentric Rings K-Space Trajectory for Hyperpolarized 13C MR Spectroscopic Imaging. MRM. 2016;75:19-31
3. Jian-Xiong Wang, Matthew E. Merritt, A. Dean Sherry, et al. Accelerated Chemical Shift Imaging of Hyperpolarized 13C Metabolites. MRM. 2016;76:1033-1038
4. F. Lam, C. Ma, B. Clifford, et al. High-Resolution 1H-MRSI of the Brain Using SPICE: Data Acquisition and Image Reconstruction. MRM. 2016;76(4):1059-1070.
5. J.Trzasko, and A.Manduca. A. Local versus global low-rank promotion in dynamic MRI series reconstruction. ISMRM. 2011. p. 4371.
6. Lin Z. Li, Stephen Kadlececk, He N. Xu, et al. Ratiometric analysis in hyperpolarized NMR (I): test of the two-site exchange model and the quantification of reaction rate constants. NMR in Biomed. 2013;10:1308-1320
Figures