3062
In Vivo Spectroscopic Detection of Arginase Enzyme Activity with Hyperpolarized [6-13C,15N3]-Arginine1Weill Cornell Graduate School, New York, NY, United States, 2Memorial Sloan Kettering Cancer Center, New York, NY, United States
Synopsis
Aberrations in arginase enzyme expression are associated with a variety of pathologies, and an in vivo probe to quantify flux through this pathway may hold utility towards patient stratification. We propose the use our custom synthesized compound, [6-13C,15N3]-arginine, as a hyperpolarized MRI probe for arginase activity. 15N enrichment reduces quadrupolar relaxation and extends T2, facilitating in vivo imaging. We were able to acquire 13C spectroscopic data on a healthy mouse and detected in vivo conversion of hyperpolarized arginine to urea, which warrants further exploration of this imaging probe in the future.
Purpose
One of several mammalian enzymes that utilize arginine as a substrate is arginase, which catalyzes its hydrolysis to urea and ornithine1,2. Arginase is primarily expressed in the liver due to its role in the urea cycle, but it is also present to a lesser degree in a variety of tissue types2. Aberrations in arginase expression have been associated with a variety of pathologies, including psoriasis3, pulmonary diseases4, inflammatory bowel disease5, and cancer6. Thus, an imaging probe with the ability to characterize arginase activity may be useful for patient stratification across a variety of diseases.
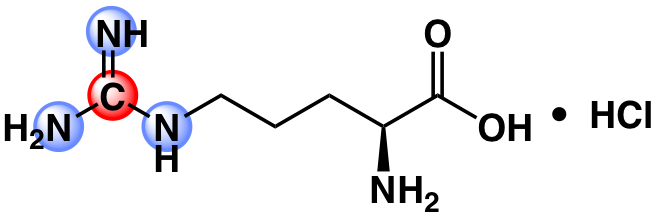
Previously, researchers have used commercially-available [6-13C]-arginine to measure arginase activity in vitro by monitoring the hyperpolarized carbon-6 resonance and its conversion to urea7. However, the T1 and T2 values of this arginine resonance are relatively short due to the presence of 3 directly-bonded quadrupolar 14N-nuclei (99.6% natural abundance), limiting its in vivo translational potential. To address these limitations, we propose the use of [6-13C,15N3]-arginine (Fig.1), a custom compound synthesized in-house, for use as a hyperpolarized MRI probe. We have characterized the physical chemical properties of this compound and have used this probe to detect in vivo arginase activity.
Methods
[6-13C,15N3]-arginine-HCl was synthesized using an eight step synthesis adapted from Qu et al. and Hailton et al8,9. For hyperpolarized experiments, arginine was polarized in a SpinLab (General Electric) for 1.5h (3.35T, 0.8K, 93.98GHz). Inversion recovery and Carr-Purcell-Meiboom-Gill acquisitions for T1 and T2 measurements of the [6-13C,15N3]- and [6-13C]-arginine carbon-6 resonance (157ppm) were performed on a Bruker 14.1T NMR. Hyperpolarized T1 and carbon-6 resonance linewidth (to approximate relative T2) were measured at low field on a 1T 13C-NMR. A previously described colorimetric assay10 for urea quantification was used to measure enzyme kinetics of human arginase-1 (Abcam) using different arginine variants as the substrate. For mouse liver homogenate arginase activity experiments, 13C-NMR spectra were acquired on a 1T NMR 15s after mixing hyperpolarized arginine with homogenate. For in vivo 13C spectroscopy, a healthy female C57BL/6 mouse was infused with 20 mM hyperpolarized [6-13C,15N3]-arginine via tail vein catheter and imaged on a Bruker 3T MRI equipped with a dual tune 1H/13C coil (under an IACUC approved protocol).Results
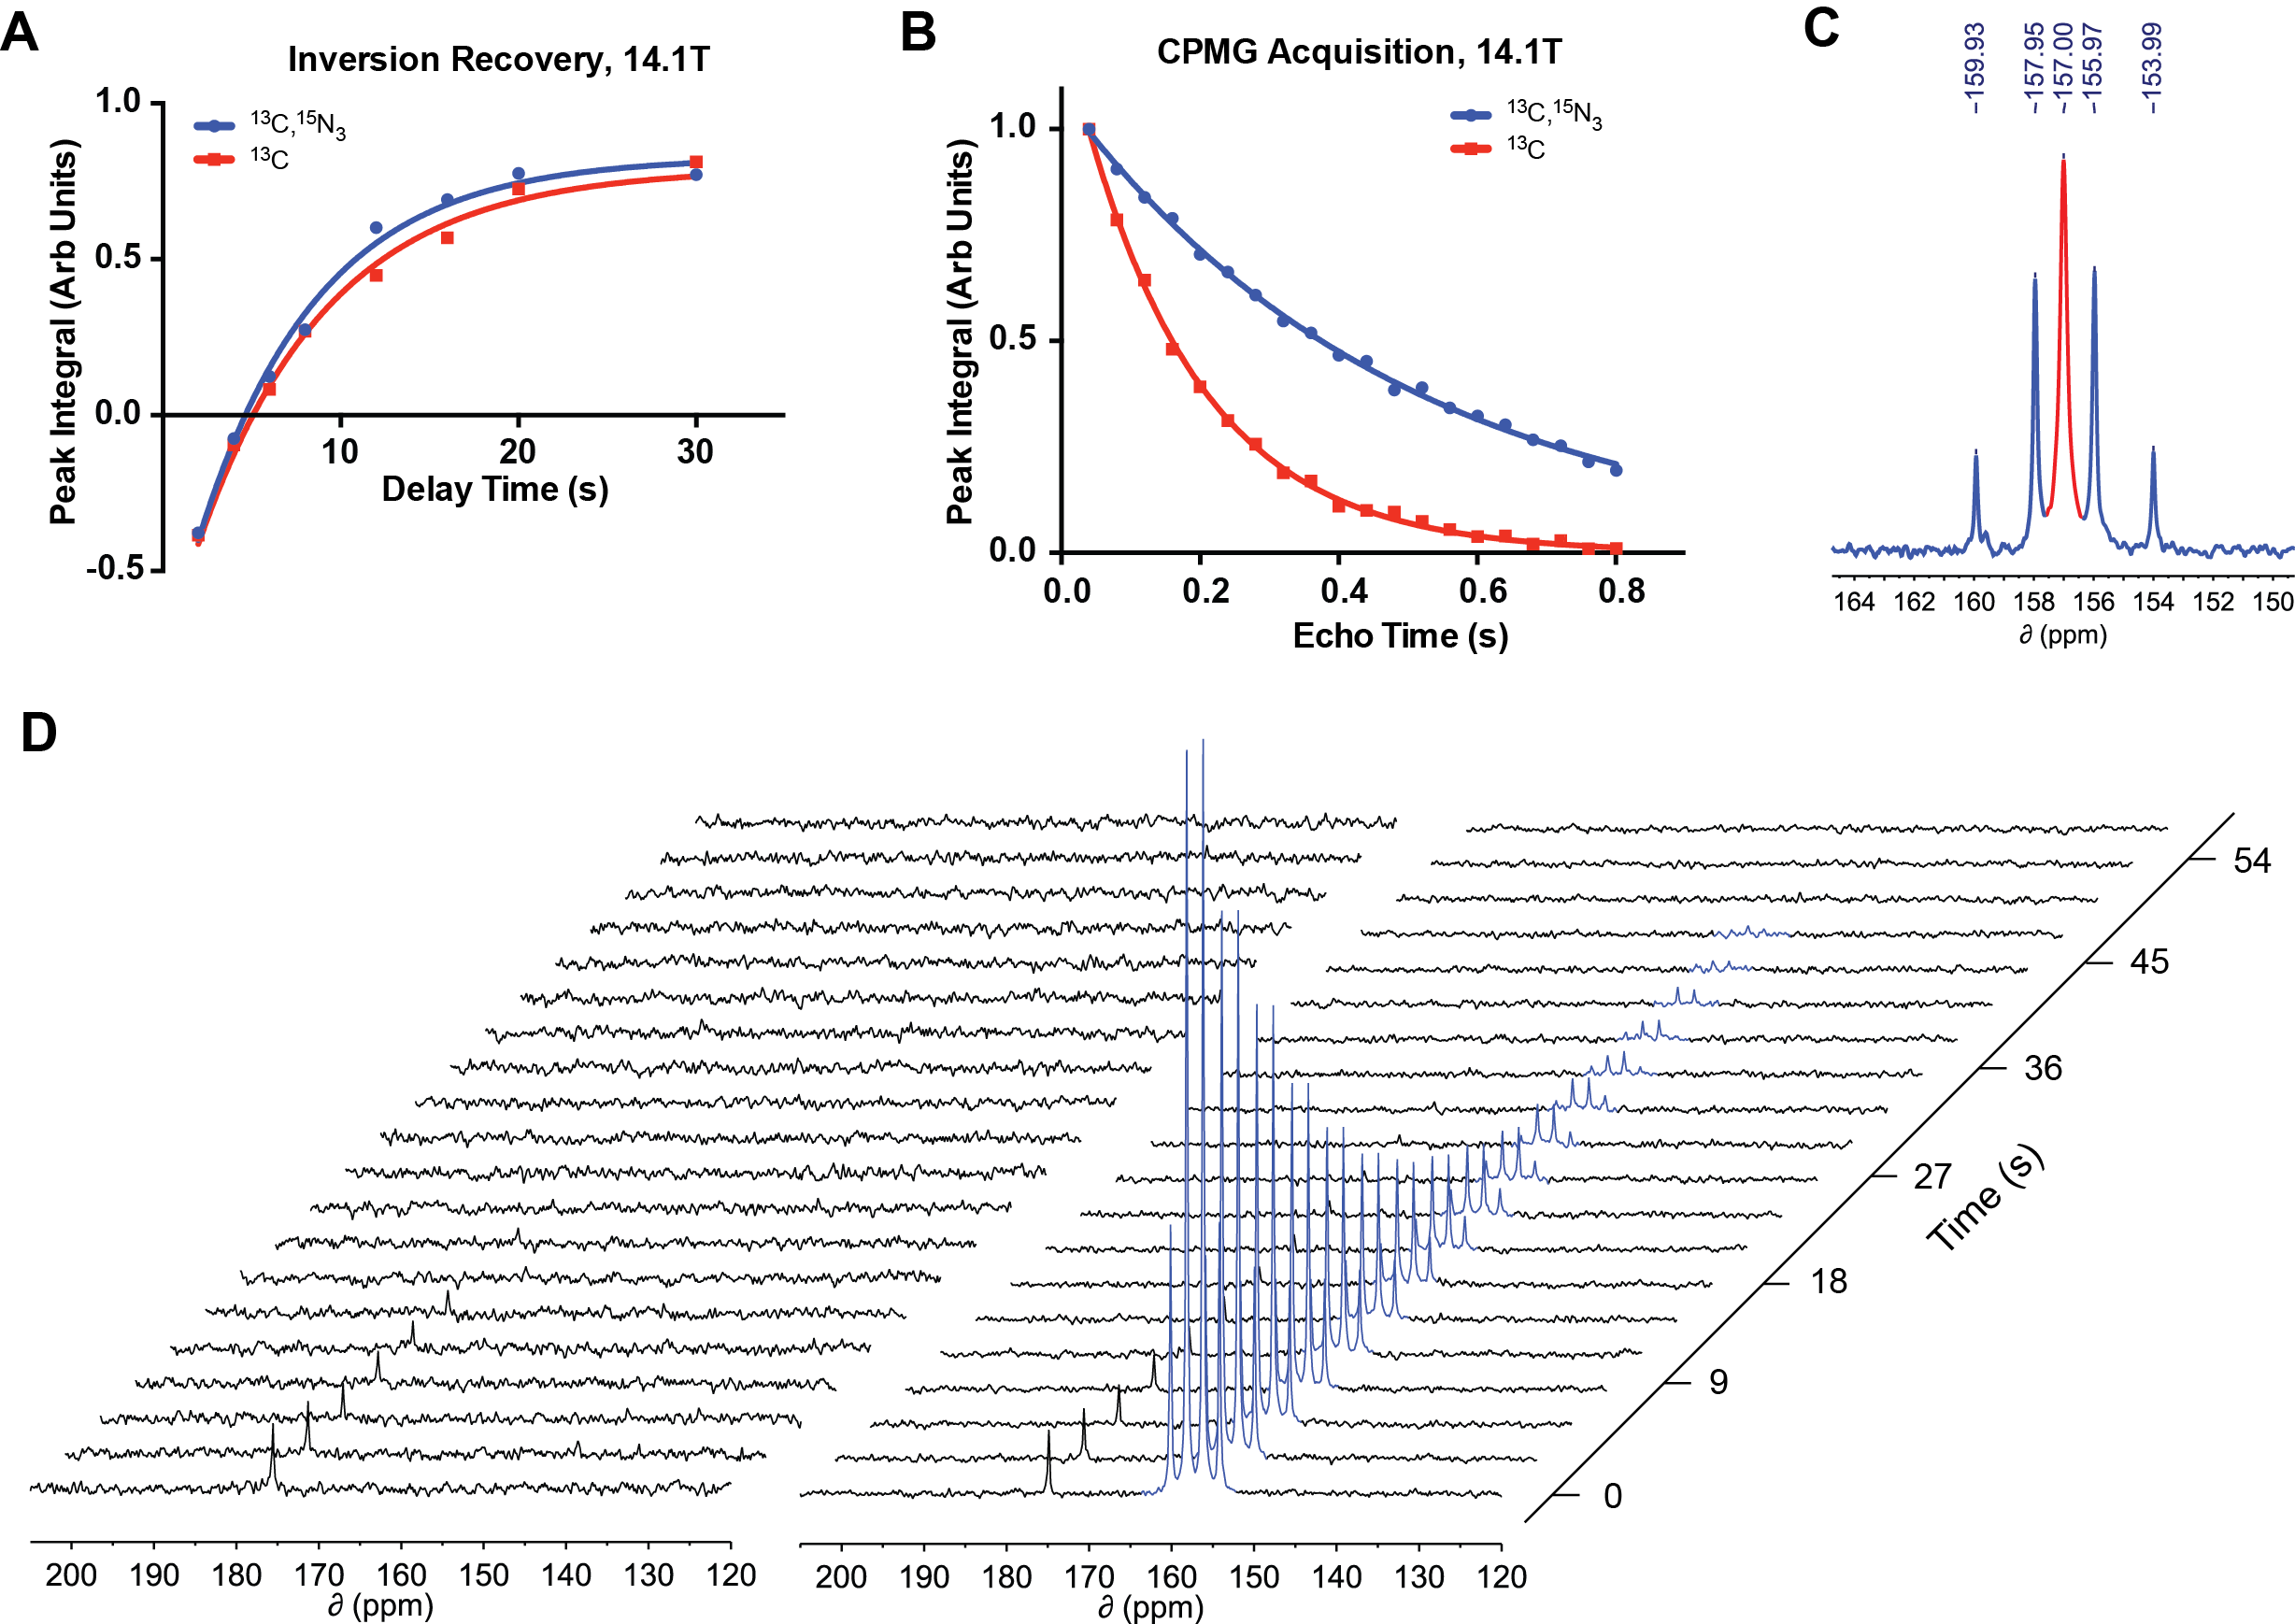
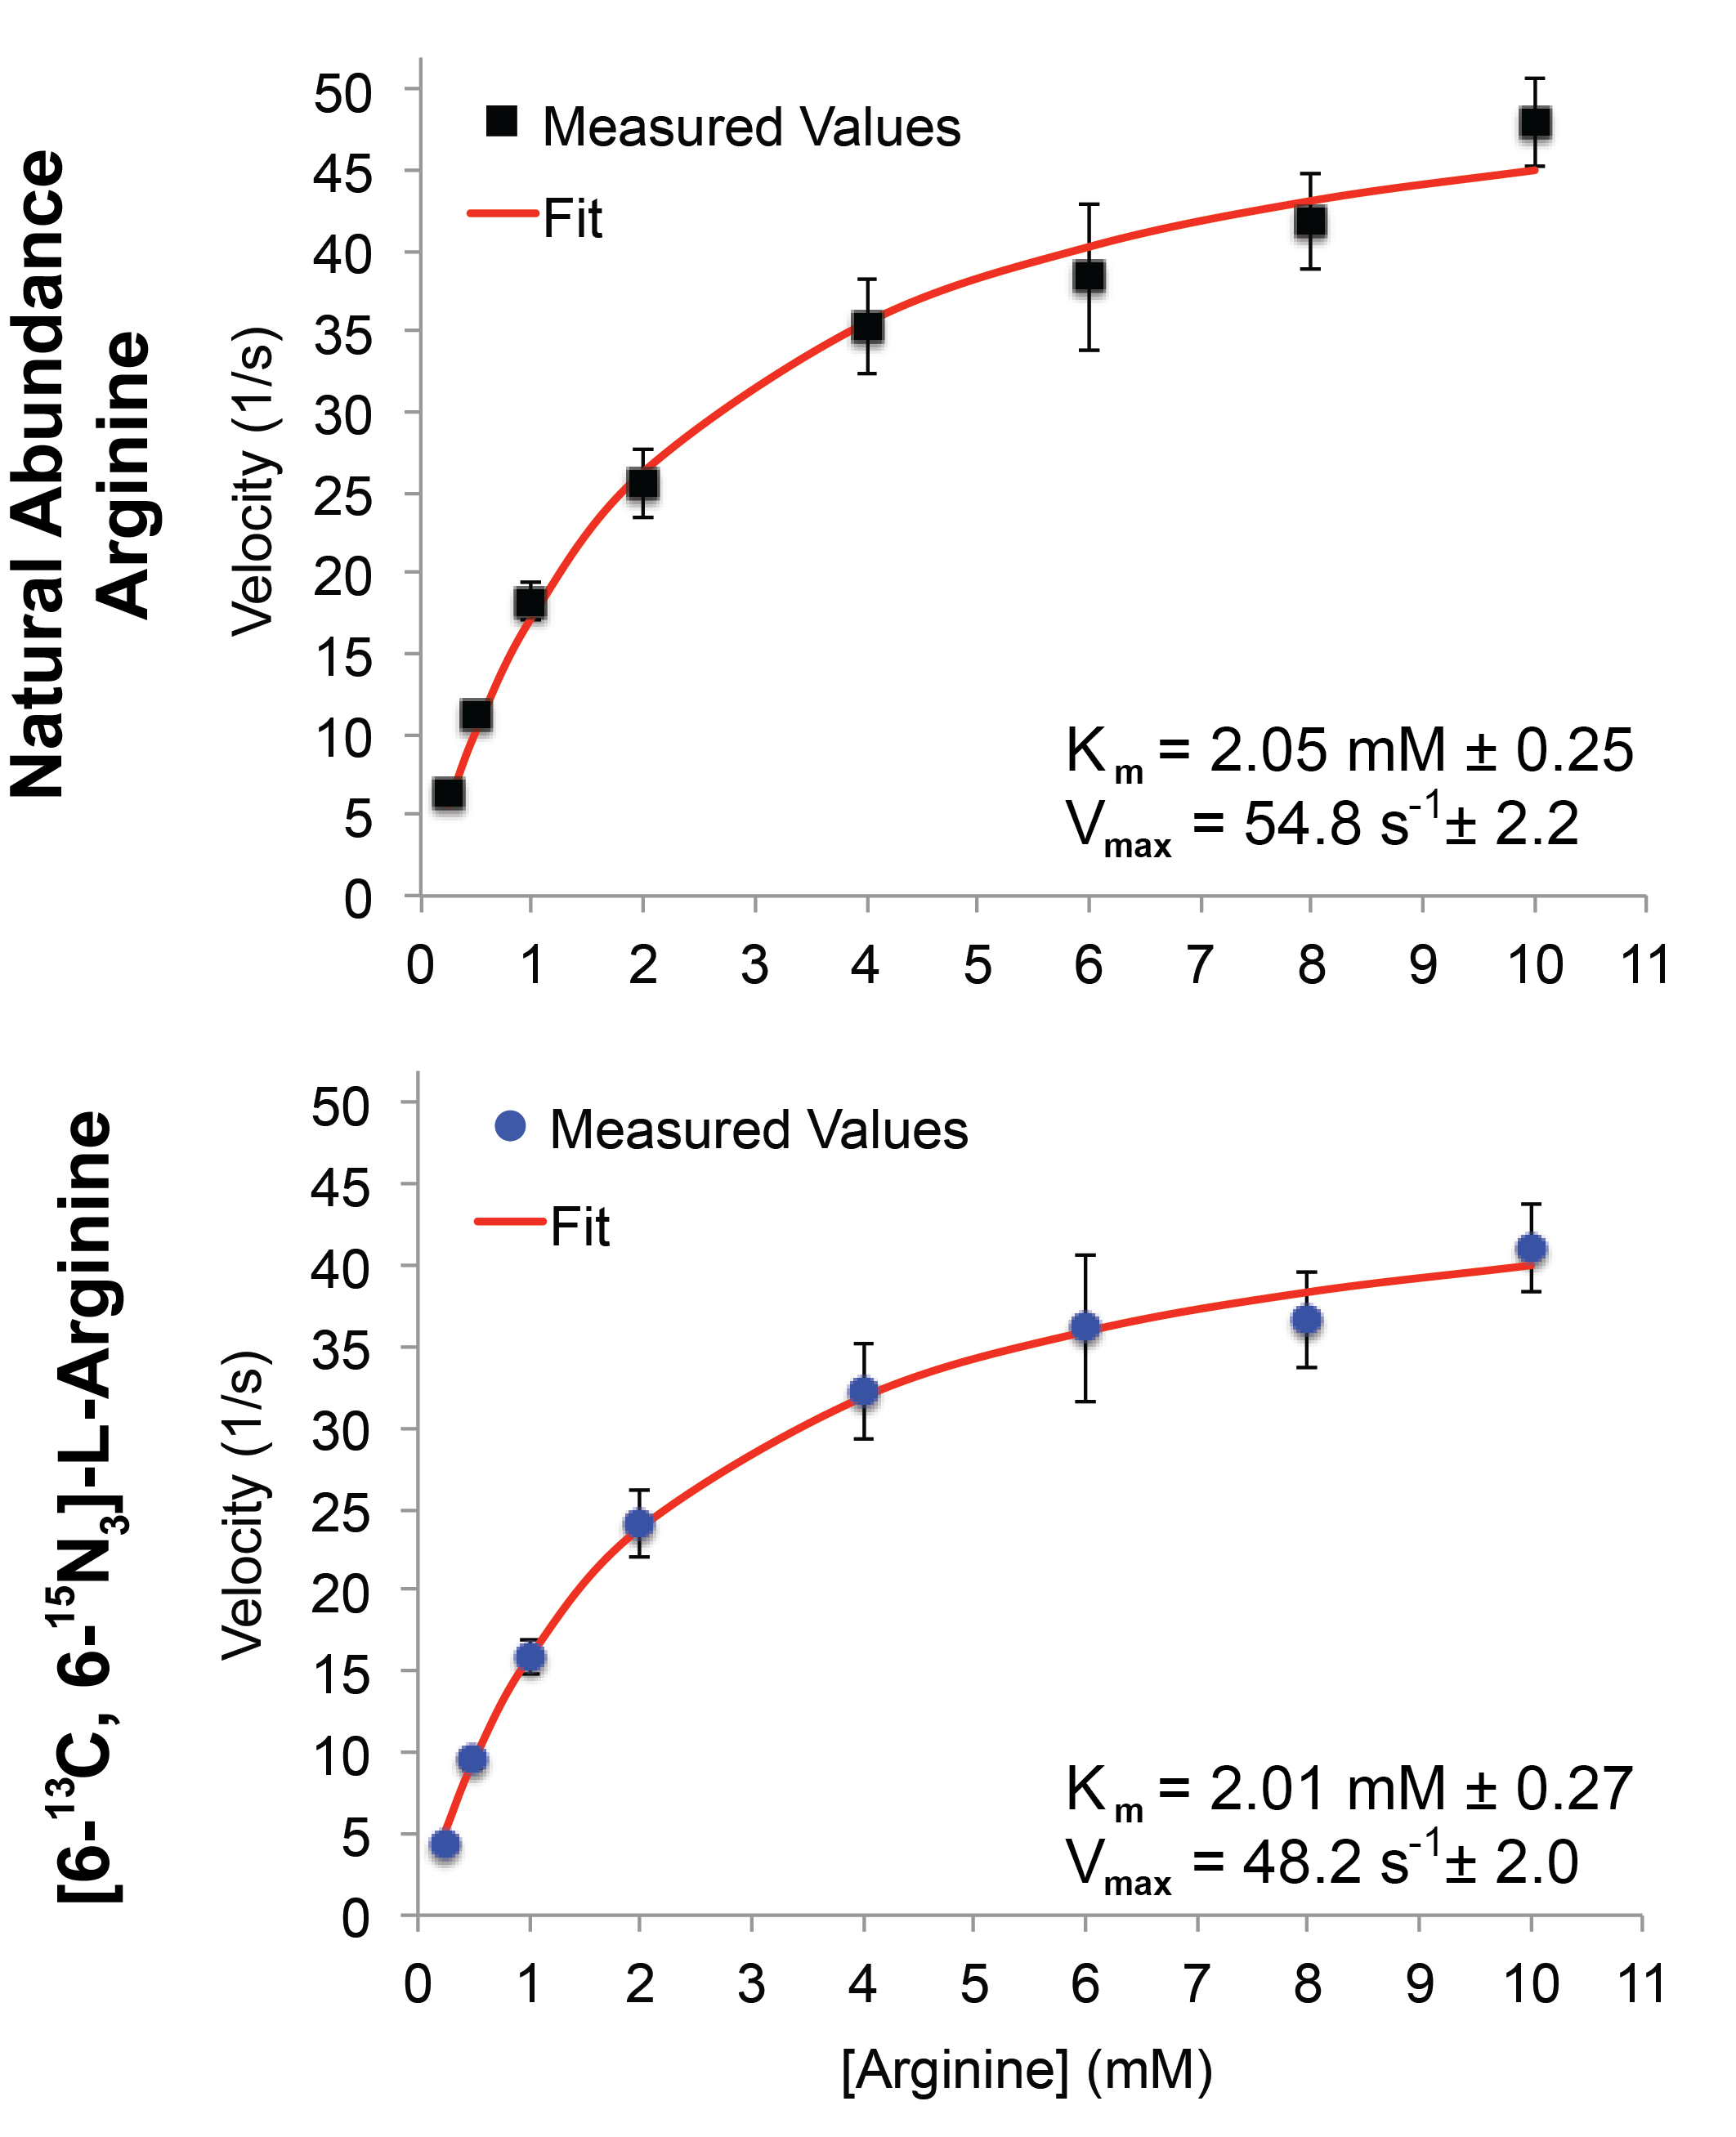
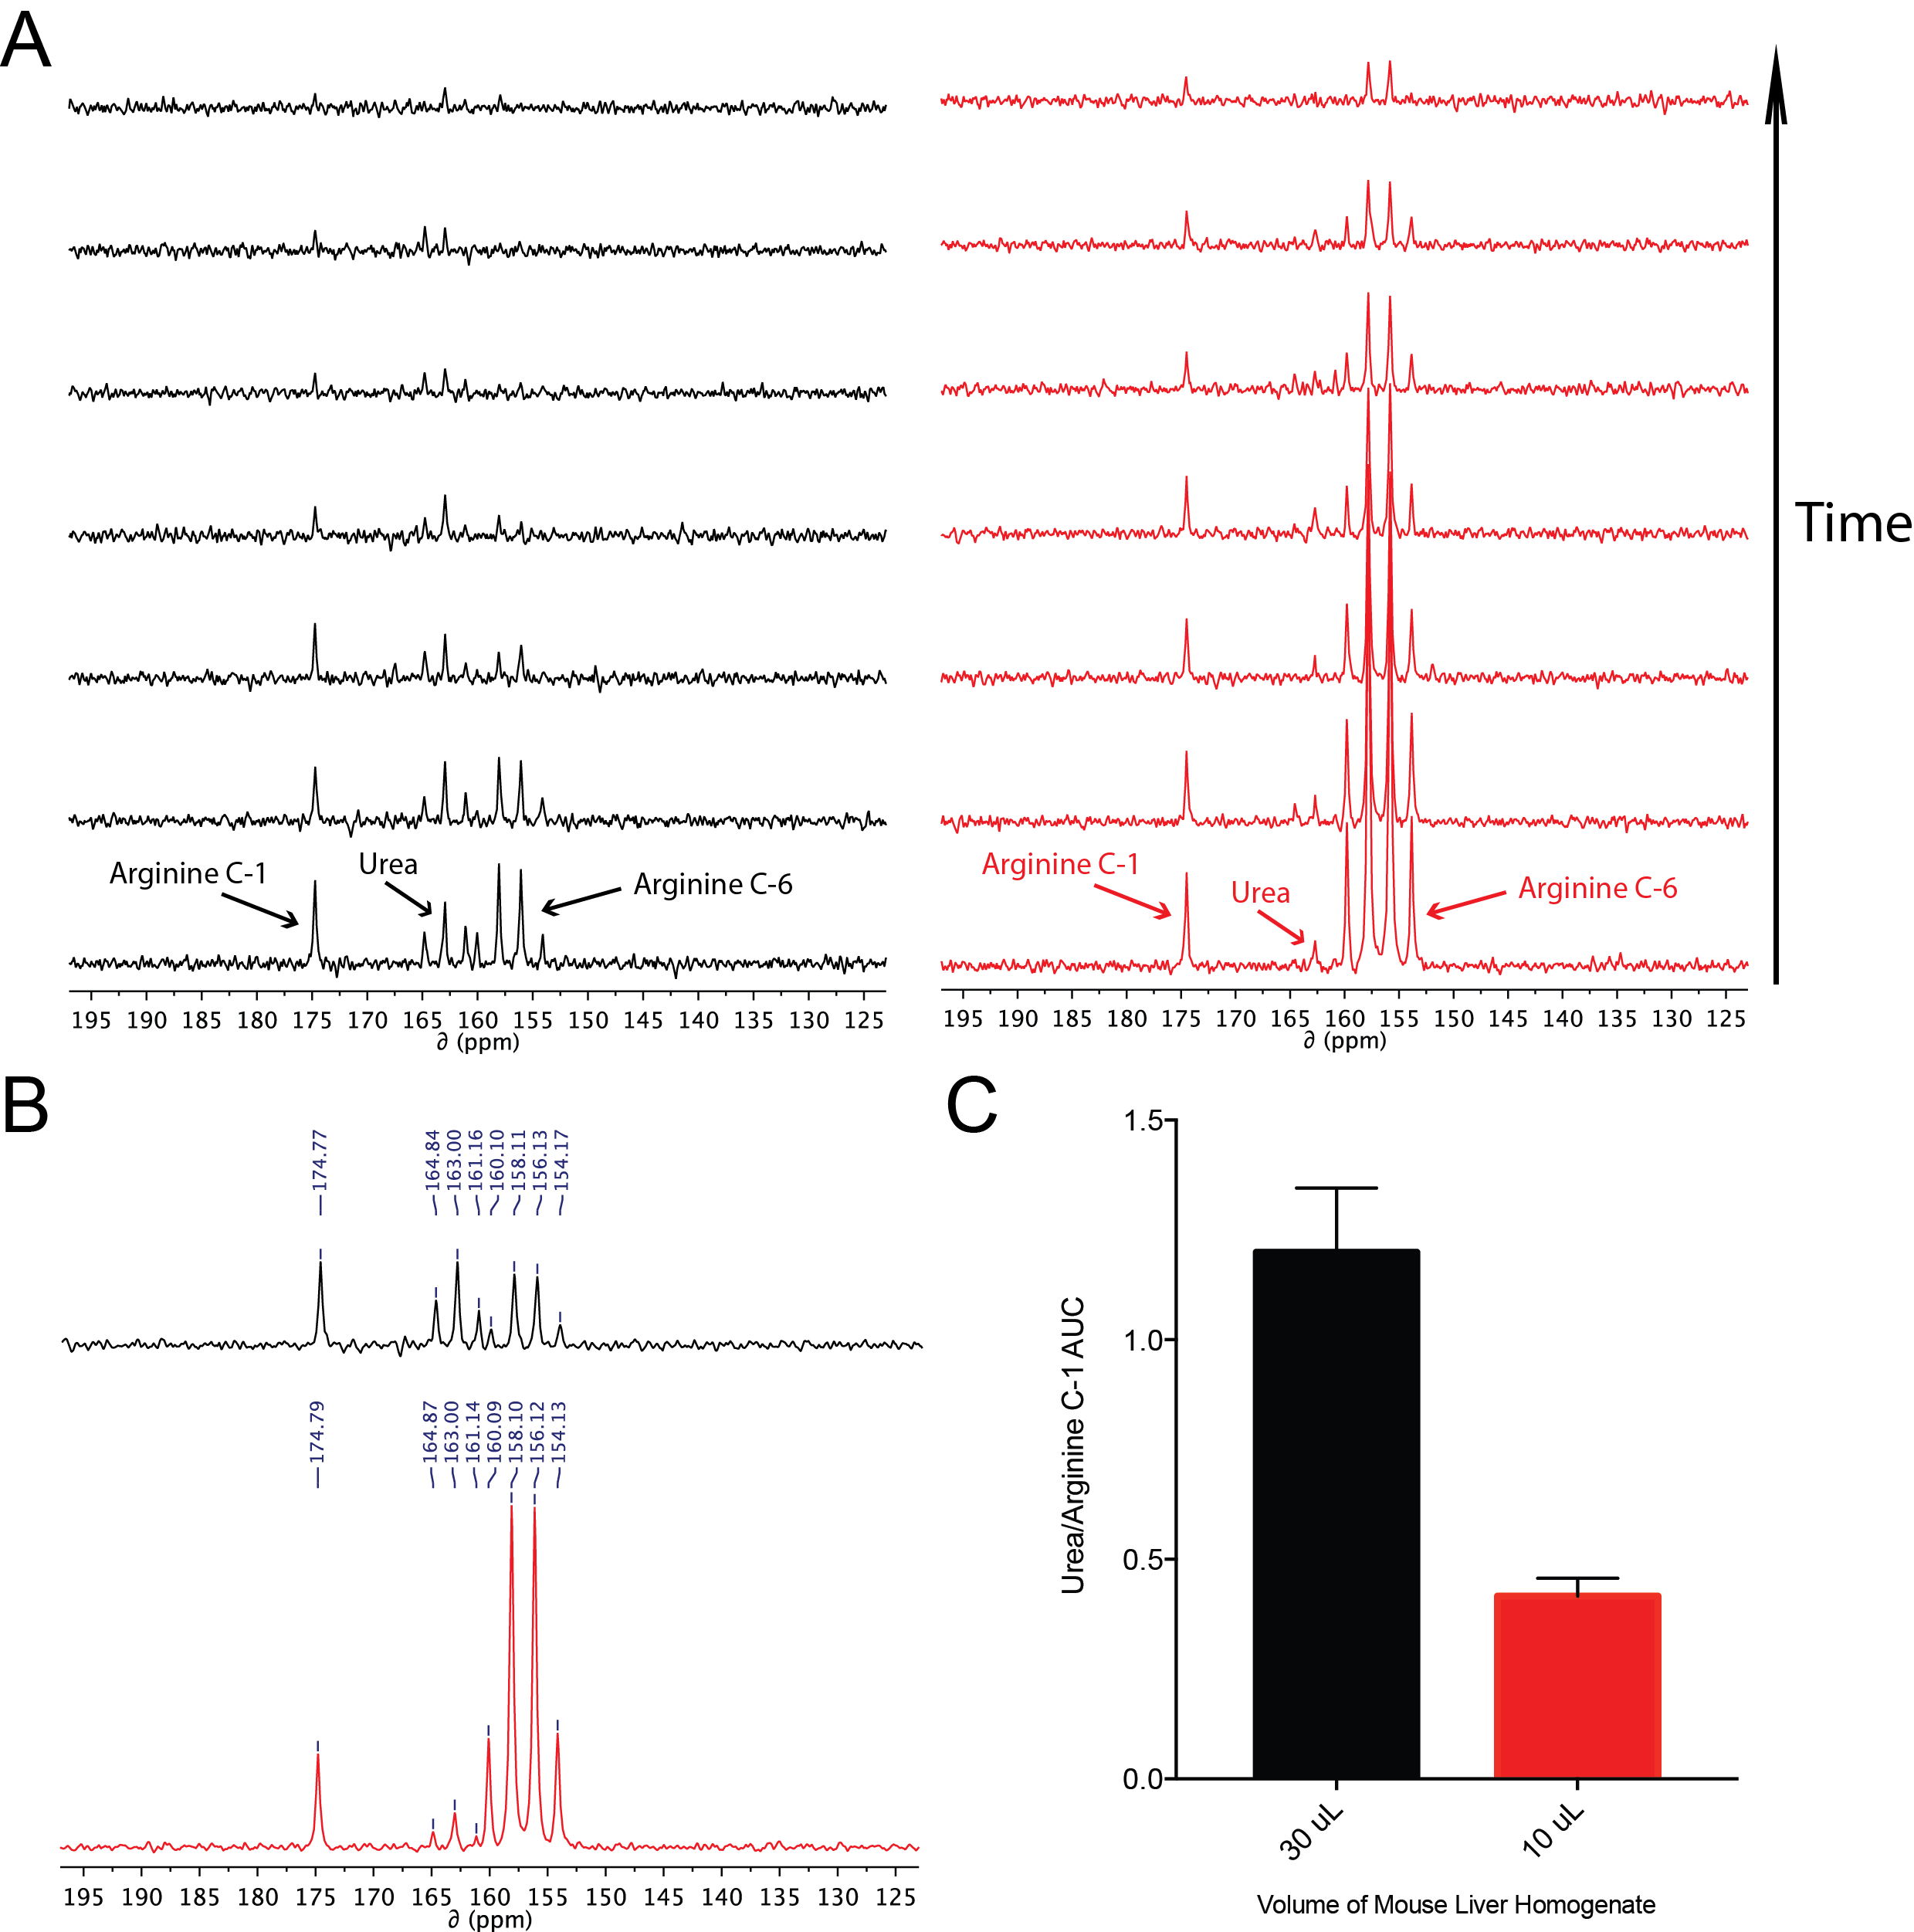
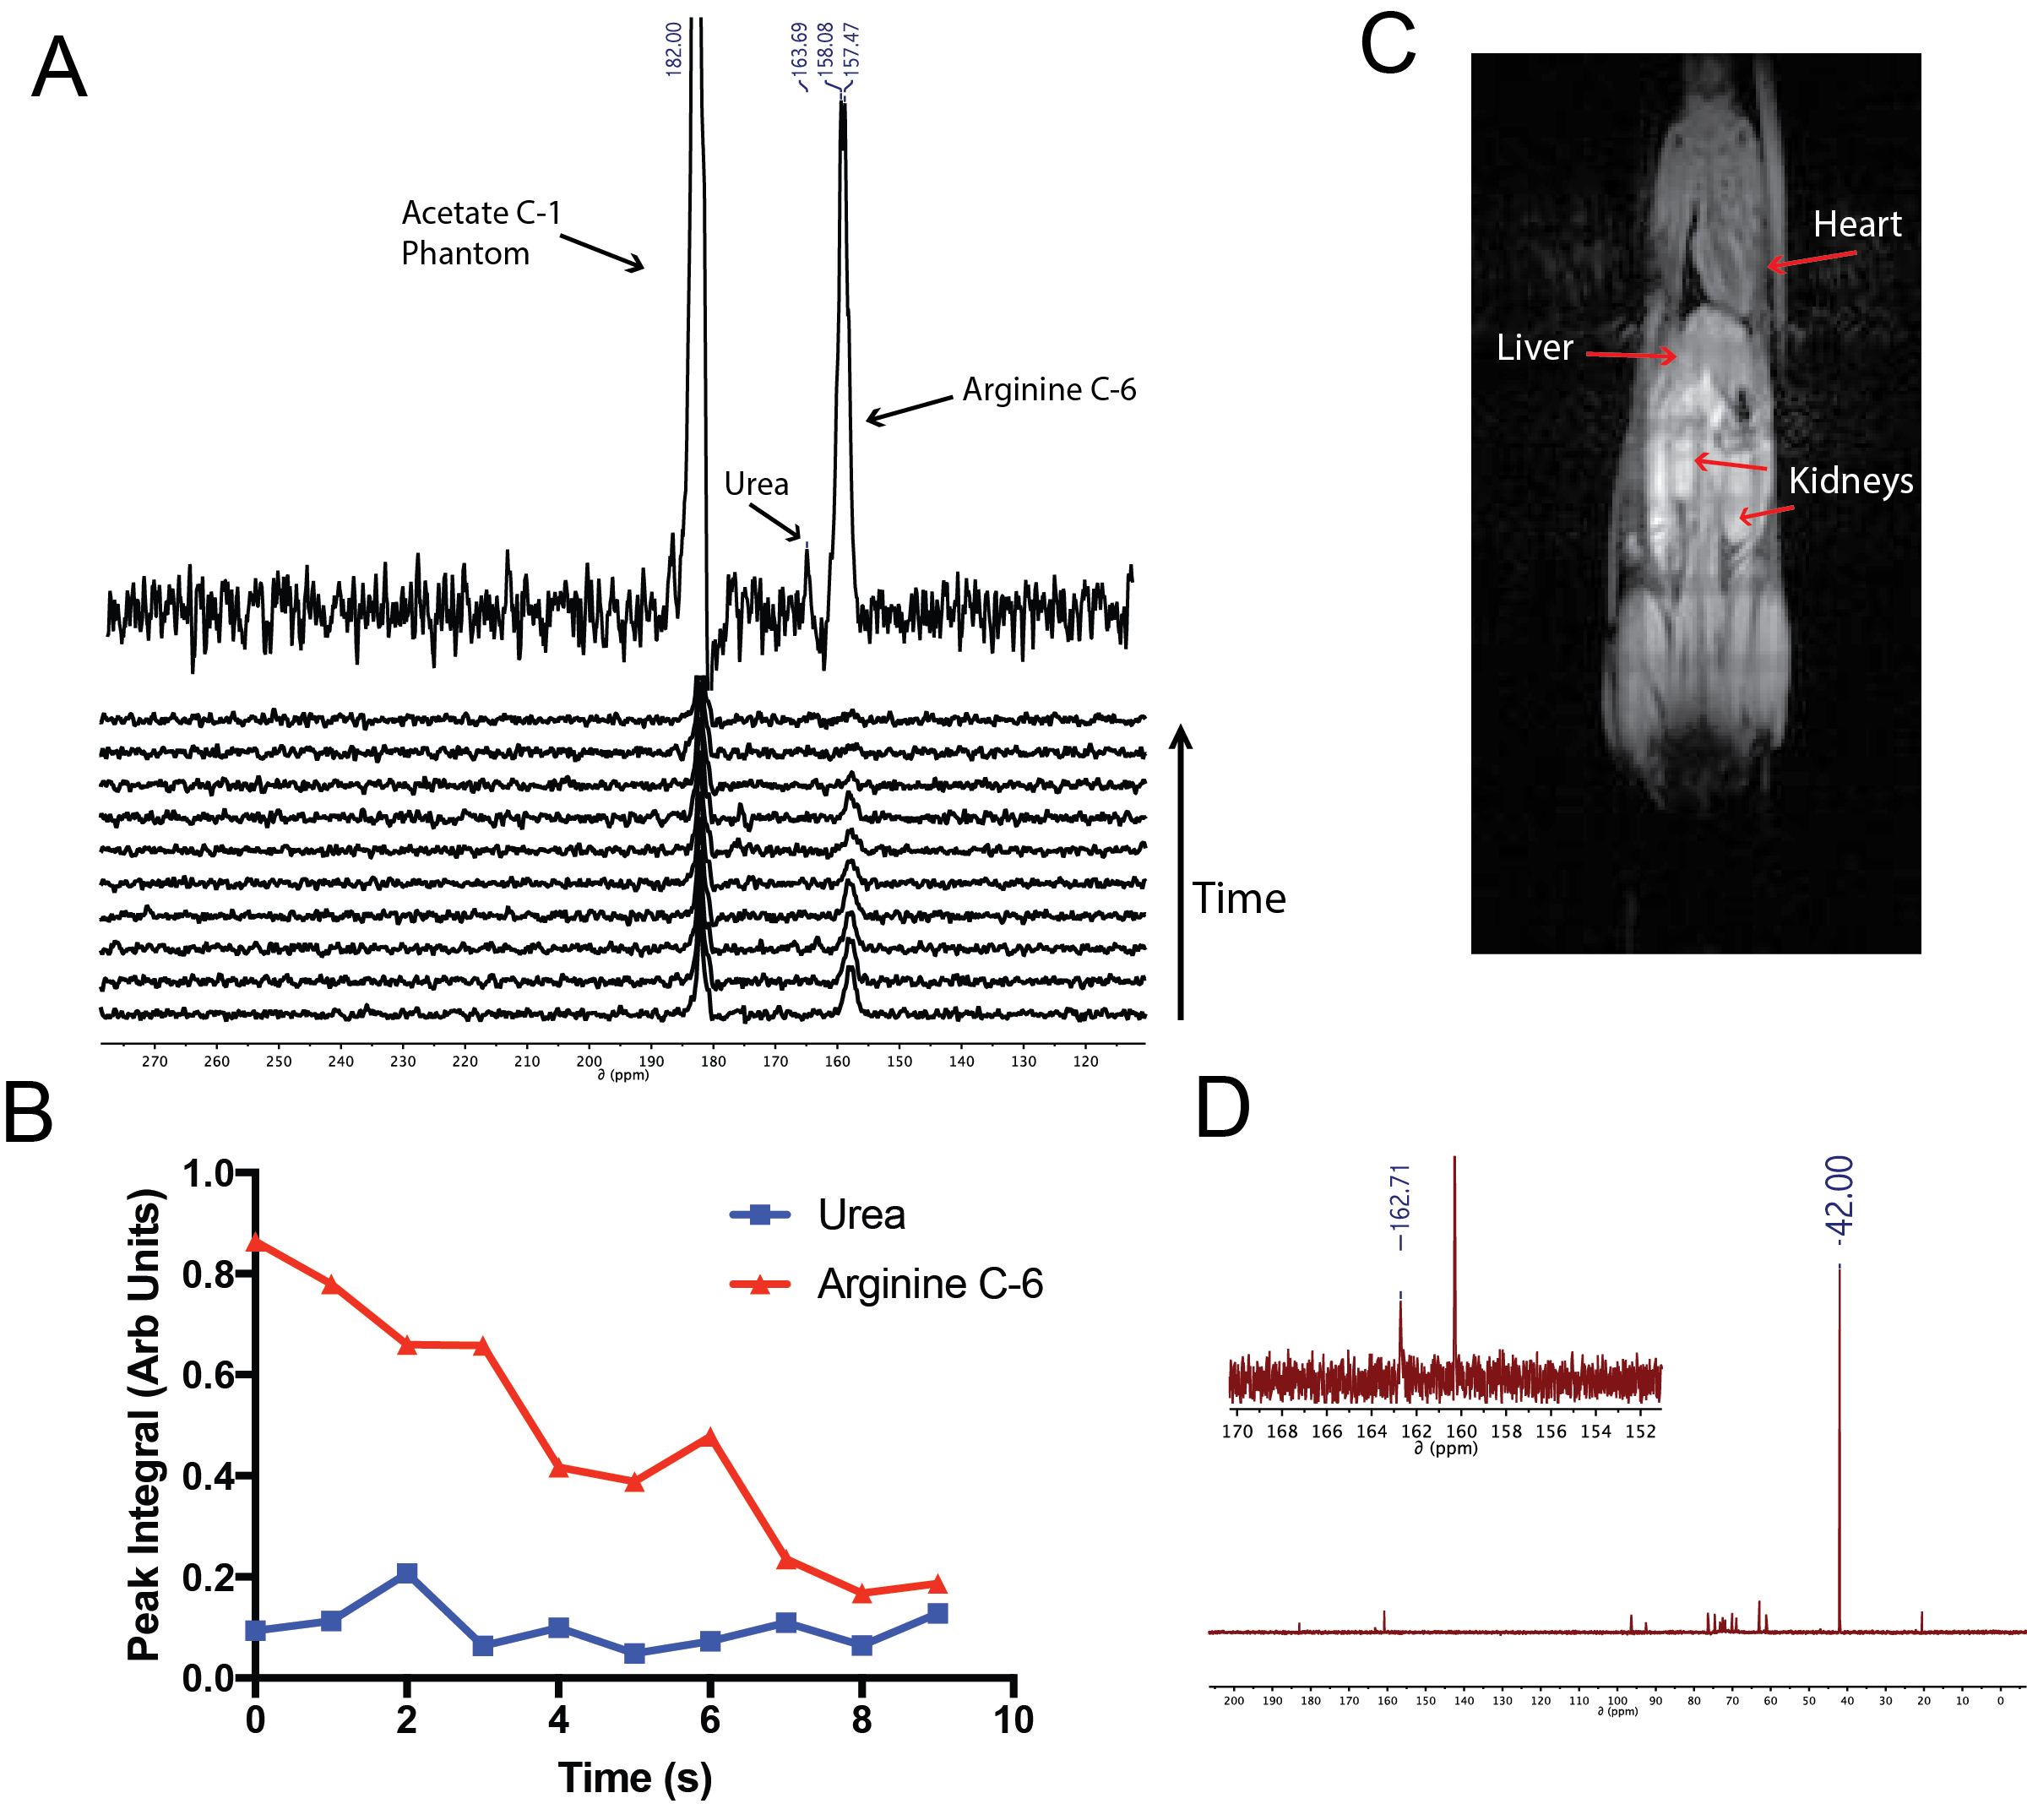
At high field, the T1 relaxation times of the arginine carbon-6 resonance with and without 15N-enrichment were not statistically significant, calculated as 6.70s±0.23s and 7.31s±0.25s, respectively (Fig.2A). T2 relaxation times dramatically increased at high field from 0.174s±0.002s to 0.488s±0.005s, without and with 15N-enrichment (Fig.2B), demonstrating a ~3-fold enhancement. At low field, the carbon-6 resonance peak widths are 1.34Hz, 1.68Hz, 1.76Hz, and 1.38Hz with 15N-enrichment, and 3.16Hz without (Fig.2C). The hyperpolarized T1 at low field is 15.13s±1.13s with 15N-enrichment, and was not measurable without (Fig.2D). However, the hyperpolarized T1 of [6-13C]-arginine at 3T has been reported to be 12.3s±0.8s7. Arginase-1 Km and vmax values using natural abundance arginine or [6-13C,15N3]-arginine as the substrate are listed in Fig.3, and reveal no significant difference in enzyme parameters with isotopic enrichment. The conversion of hyperpolarized arginine to urea, catalyzed by arginase in liver homogenate, can be detected with 13C-NMR and this conversion scales with increasing homogenate concentrations (Fig.4). Non-localized in vivo 13C spectra from a healthy mouse injected with hyperpolarized [6-13C,15N3]-arginine revealed the presence of hyperpolarized urea and arginine within the animal (Fig.5). 13C-NMR of mouse plasma 25min post-injection suggests the presence of [13C,15N2]-urea in the blood, in addition to rapid arginine/urea clearance.Discussion
15N-enrichment plays a minimal role in extending arginine carbon-6 resonance T1 in high or low field, but reduction of quadrupolar relaxation mitigates rapid depolarization immediately following dissolution when the sample is not exposed to a strong magnetic field. 15N-enrichment also increased T2 at all field strengths, thereby improving imaging quality. Though the arginine active site coordinates around the guanidine group,11 heavy-atom labeling around this site does not significantly impair arginase enzyme kinetics. Conversion of hyperpolarized arginine to urea can be detected with no background contaminants and it scales with increasing arginase activity, implying this probe is a viable candidate to measure arginase activity in vivo. Non-localized 13C spectroscopic data from a healthy mouse post-injection with hyperpolarized arginine demonstrated detection of hyperpolarized arginine and urea resonances, suggesting delivery and metabolic conversion occurs rapidly and further hyperpolarized MRI studies should be pursued.Conclusion
Quantification of arginase activity is becoming increasingly relevant in the study of various diseases. The conversion of hyperpolarized [6-13C,15N3]-arginine to [13C,15N2]-urea was detected in vivo in a healthy mouse, which is a promising first step towards translating this probe to study disease. Moving forward, we are working towards the optimization of our acquisition scheme.Acknowledgements
- NIH/NCI Cancer Center Support Grant, P30 CA008748, NIH/NIBIB R00 EB014328
- Ruth L. Kirschstein NRSA Institutional Research Training Grant, T32
- Ludwig Center for Cancer Immunotherapy: Memorial Sloan Kettering
- Center for Molecular Imaging and Nanotechnology: Memorial Sloan Kettering
References
- Morris, S. M. Arginine Metabolism : Boundaries of Our Knowledge. J. Nutr. 137, 16025–16095 (2007).
- Cederbaum, S. D. et al. Arginases I and II: Do their functions overlap? Mol. Genet. Metab. 81, 38–44 (2004).
- Bruch-gerharz, D. et al. Arginase 1 Overexpression in Psoriasis Limitation of Inducible Nitric Oxide Synthase Activity as a Molecular Mechanism for Keratinocyte Hyperproliferation. Am. J. Pathol. 162, 203–211 (2003).
- Maarsingh, H., Pera, T. & Meurs, H. Arginase and pulmonary diseases. Naunyn-Schmiedberg’s Arch Phamacology 378, 171–184 (2008).
- Horowitz, S. et al. Increased arginase activity and endothelial dysfunction in human inflammatory bowel disease. AJP-Gastrointest Liver Physiol 292, 1323–1336 (2007).
- Porembska, Z. et al. Arginase in patients with breast cancer. Clin. Chim. Acta 328, 105–111 (2003).
- Najac, C. et al. Detection of inflammatory cell function using 13C magnetic resonance spectroscopy of hyperpolarized [6-13C]-arginine. Sci. Rep. 6, 31397 (2016).
- Qu, W. et al. Facile synthesis [5-13C-4-2H2]-L-glutamine for hyperpolarized MRS imaging of cancer cell metabolism. Acad. Radiol. 18, 932–9 (2011).
- Hamilton, D. J. & Sutherland, A. A flexible approach for the synthesis of selectively labelled l-arginine. Tetrahedron Lett. 45, 5739–5741 (2004).
- Knipp, M. & Vasák, M. A colorimetric 96-well microtiter plate assay for the determination of enzymatically formed citrulline. Anal. Biochem. 286, 257–64 (2000).
- Di Costanzo, L. et al. Crystal structure of human arginase I at 1.29-A resolution and exploration of inhibition in the immune response. Proc. Natl. Acad. Sci. U. S. A. 102, 13058–63 (2005).
Figures