3060
Novel Metabolic Markers for Therapeutic Approaches Targeting Serine Synthesis Pathway in Leukemia1Department of Radiology, Memorial Sloan Kettering Cancer Center, New York, NY, United States, 2Molecular Pharmacology Program, Memorial Sloan Kettering Cancer Center, New York, NY, United States, 3Department of Biomedical Engineering, Columbia University, New York, NY, United States, 4Weill Cornell Medical College, New York, NY, United States
Synopsis
The serine synthesis pathway (SSP), which provides precursors for redox homeostasis and nucleotide synthesis, has emerged as a critical metabolic pathway in cancer. However, the assessment of therapeutic approaches targeting the SSP has been challenging due to a lack of distinct biomarkers. We have identified that the SSP inhibition increases reactive oxygen species (ROS) levels and, intriguingly, glycolytic rate in leukemia cells. Using hyperpolarized dehydroascorbate and pyruvate magnetic resonance, we assessed therapeutic responses earlier than any significant changes in cell viability. This approach has broad implications as an effective methodology for monitoring therapeutic responses with SSP inhibition in multiple cancers.
INTRODUCTION
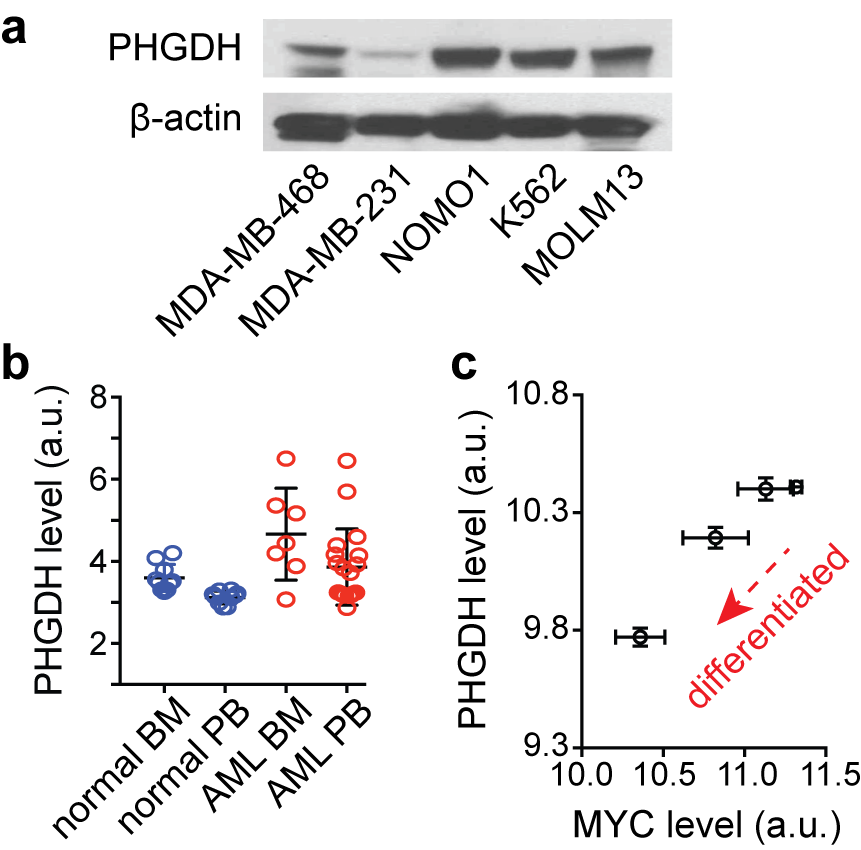
The serine synthesis pathway (SSP) has recently emerged as a critical metabolic pathway in cancer. This pathway diverts the glycolytic intermediate from the major metabolic pathway to make serine and glycine, which are precursors for redox homeostasis and nucleotide synthesis1–3. The rate-limiting enzyme in the SSP, phosphoglycerate dehydrogenase (PHGDH), is overexpressed or genetically amplified in multiple solid cancers, including breast cancer, non-small cell lung cancer, and melanoma, and its elevated level has been implicated in worse prognosis4–6. We recently identified that PHGDH is highly expressed in leukemia cells (Fig. 1a). From the National Center for Biotechnology Information (NCBI) genome database, we also found that the PHGDH level is higher in leukemia blasts in patients, compared to normal hematopoietic cells (Fig. 1b), and it is likely related to leukemogenesis (Fig. 1c). While PHGDH has been of a great interest as a therapeutic target for cancer treatment, the assessment of therapeutic approaches targeting PHGDH has been challenging, mainly due to a lack of distinct biomarkers. Here, we report novel metabolic markers for rapid and non-invasive monitoring of therapeutic efficacy of PHGDH inhibition in leukemia cells, which have potential for translation to in vivo imaging.METHODS
Leukemia cells (MOLM13, K562, and NOMO1) were treated with PHGDH inhibitor, NCT-503 (Cayman Chemical), for 24 hours with different concentrations. The levels of metabolites in cell culture media and cell extracts were measured using a high-field NMR spectrometer (Ultrashield Plus 14.1T, Bruker), and the 1H-NMR spectra were analysed using Chenomx NMR Suite. An assay kit, GSH/GSSG-Glo (Promega), was used for quantification of the reduced and oxidized glutathione levels, and a fluorogenic reagent, CellROX Green (Life Technologies), was used for measuring reactive oxygen species (ROS) levels in leukemia cells after treatment. For hyperpolarized NMR experiments, we used [1-13C] dehydroascorbate (DHA) and [1-13C] pyruvate as probes for monitoring changes in redox state and glycolytic rate during the treatment.RESULTS and DISCUSSION
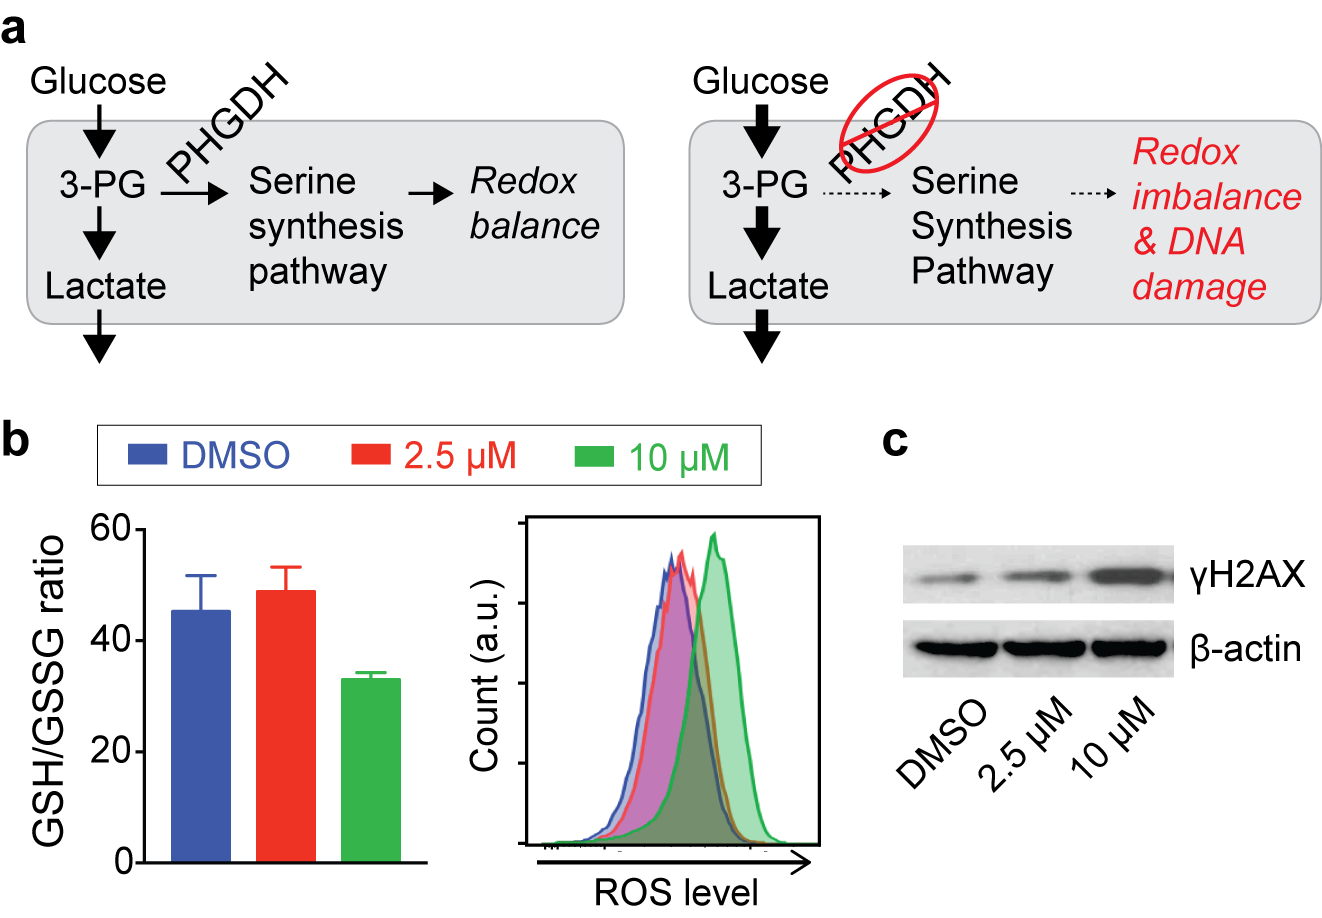
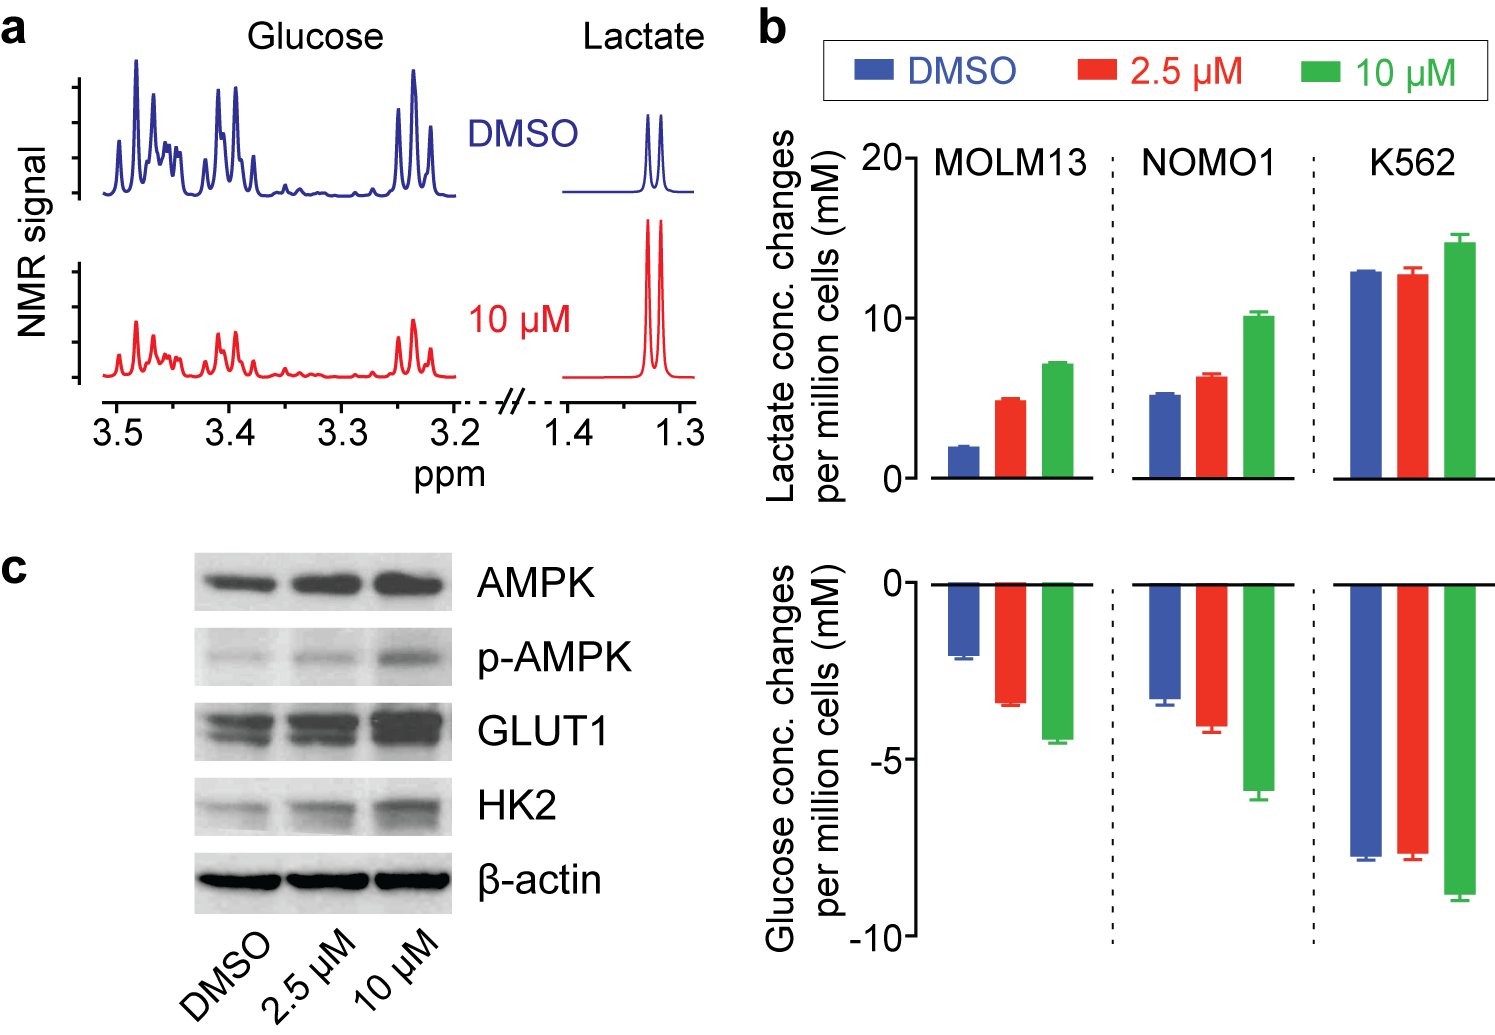
Inhibition of PHGDH decreases the flux through the SSP, and we hypothesized that redox imbalance and DNA damage would be induced by PHGDH inhibitor treatment (Fig. 2a). As expected, significant changes in glutathione and ROS levels were found with a higher concentration of the PHGDH inhibitor (Fig. 2b), and DNA damage was also increased (Fig. 2c). Intriguingly, we observed that the treatment induced a significant increase in glucose consumption and lactate generation (Fig. 3a), and this unexpected metabolic change was found consistently in multiple leukemia cells (Fig. 3b). Previous studies have demonstrated that elevated ROS could activate AMP-activated protein kinase (AMPK)7,8. We confirmed that PHGDH inhibition led to a higher phosphorylation of AMPK and up-regulation of the glucose transporter (GLUT1) and hexokinase (HK2) (Fig. 3c), likely leading to the increased glycolytic rate after treatment.
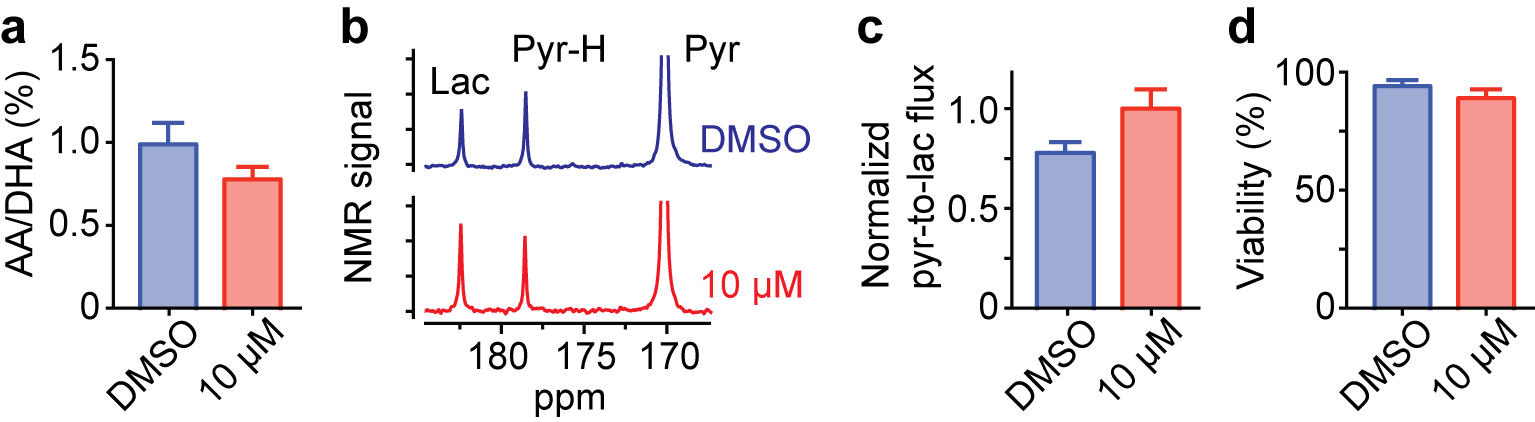
Based on our identification of the metabolic changes induced by PHGDH inhibition, we hypothesized that effective treatment responses could be monitored non-destructively using hyperpolarized NMR. [1-13C] DHA and [1-13C] pyruvate could be powerful hyperpolarized probes, as their conversion rate to [1-13C] ascorbic acid and [1-13C] lactate indicates cellular redox state9,10 and glycolytic rate11–13, respectively. In addition, their spin-relaxation times (T1) are relatively long (71 and 75 sec, respectively, at 1 Tesla)14. As expected, we successfully assessed metabolic changes induced by PHGDH inhibition using these hyperpolarized probes, well before any change in cell viability was detected (Fig. 4).
CONCLUSION
We have identified that targeting the serine synthesis pathway in leukemia cells induces a significant increase in ROS level and glycolytic rate, which can be exploited as novel metabolic markers. Using hyperpolarized probes, we succeeded in quantifying those changes during treatment non-destructively, even before any changes in cell viability. Our study indicates that hyperpolarized NMR could be utilized for monitoring the therapeutic responses targeting PHGDH, or the serine synthesis pathway, sensitively and non-destructively.Acknowledgements
The authors thank Dr. Sui Seng Tee and Dr. Moonjung Jung for providing insightful comments on experimental details. This work was supported in part by US NIH grants R00EB014328, R21CA212958, Cancer Center Support Grant P30CA008747, and the Center for Molecular Imaging and Nanotechnology (CMINT) at MSKCC.References
1. Yang M, Vousden KH. Serine and one-carbon metabolism in cancer. Nat Rev Cancer. 2016;16(10):650-662. doi:10.1038/nrc.2016.81.
2. Labuschagne CF, van den Broek NJF, Mackay GM, Vousden KH, Maddocks ODK. Serine, but not glycine, supports one-carbon metabolism and proliferation of cancer cells. Cell Rep. 2014;7(4):1248-1258. doi:10.1016/j.celrep.2014.04.045.
3. Ma EH, Bantug G, Griss T, et al. Serine Is an Essential Metabolite for Effector T Cell Expansion. Cell Metab. 2017;25(2):345-357. doi:10.1016/j.cmet.2016.12.011.
4. Possemato R, Marks KM, Shaul YD, et al. Functional genomics reveal that the serine synthesis pathway is essential in breast cancer. Nature. 2011;476(7360):346-350. doi:10.1038/nature10350.
5. Locasale JW, Grassian AR, Melman T, et al. Phosphoglycerate dehydrogenase diverts glycolytic flux and contributes to oncogenesis. Nat Genet. 2011;43(9):869-874. doi:10.1038/ng.890.
6. Zhang B, Zheng A, Hydbring P, et al. PHGDH Defines a Metabolic Subtype in Lung Adenocarcinomas with Poor Prognosis. Cell Rep. 2017;19(11):2289-2303. doi:10.1016/j.celrep.2017.05.067.
7. Dey P, Baddour J, Muller F, et al. Genomic deletion of malic enzyme 2 confers collateral lethality in pancreatic cancer. Nature. 2017;542(7639):119-123. doi:10.1038/nature21052.
8. Rabinovitch RC, Samborska B, Faubert B, et al. AMPK Maintains Cellular Metabolic Homeostasis through Regulation of Mitochondrial Reactive Oxygen Species. Cell Rep. 2017;21(1):1-9. doi:10.1016/j.celrep.2017.09.026.
9. Keshari KR, Kurhanewicz J, Bok R, Larson PEZ, Vigneron DB, Wilson DM. Hyperpolarized 13C dehydroascorbate as an endogenous redox sensor for in vivo metabolic imaging. Proc Natl Acad Sci USA. 2011;108(46):18606-18611. doi:10.1073/pnas.1106920108.
10. Wilson DM, Di Gialleonardo V, Wang ZJ, et al. Hyperpolarized 13C Spectroscopic Evaluation of Oxidative Stress in a Rodent Model of Steatohepatitis. Sci Rep. 2017;7(March):46014. doi:10.1038/srep46014.
11. Jeong S, Eskandari R, Park SM, et al. Real-time quantitative analysis of metabolic flux in live cells using a hyperpolarized micromagnetic resonance spectrometer. Sci Adv. 2017;3:e1700341.
12. Hu S, Balakrishnan A, Bok RA, et al. 13C-pyruvate imaging reveals alterations in glycolysis that precede c-Myc-induced tumor formation and regression. Cell Metab. 2011;14(1):131-142. doi:10.1016/j.cmet.2011.04.012.
13. Keshari KR, Sriram R, Koelsch BL, et al. Hyperpolarized 13C-pyruvate magnetic resonance reveals rapid lactate export in metastatic renal cell carcinomas. Cancer Res. 2013;73(2):529-538. doi:10.1158/0008-5472.CAN-12-3461.
14. Tee SS, DiGialleonardo V, Eskandari R, et al. Sampling Hyperpolarized Molecules Utilizing a 1 Tesla Permanent Magnetic Field. Sci Rep. 2016;6(August):32846. doi:10.1038/srep32846.
Figures