3056
Ex-vivo real-time measurement of ethanol induced changes in brain metabolism of hyperpolarized [1-13C]-pyruvate1Department of Radiology, Hadassah-Hebrew University Medical Center, Jerusalem, Israel
Synopsis
Changes in brain metabolism during acute alcohol intoxication either reflect global inhibition or changes in the utilized energy substrates. NMR spectroscopy of hyperpolarized metabolites offer the opportunity to investigate the metabolic changes due to alcohol intoxication in the brain in real time. Here we present preliminary data showing decreased [1-13C]lactate formation from hyperpolarized [1-13C]pyruvate in perfused and ethanol incubated rat brain slices. This approach may offer a future innovative tool to non-invasively image brain metabolism in real-time during alcohol intoxication.
Introduction
Acute ethanol intoxication decreases glucose metabolism in the resting brain [1]. This finding was originally interpreted as a correlate of inhibited brain function during ethanol intoxication, but subsequent research showed that the brain can shift from glucose to acetate metabolism as energy source [2]. The established techniques to investigate glucose brain metabolism in the living brain (e.g., PET and conventional NMR-spectroscopy) do not allow real-time monitoring. However, hyperpolarized NMR spectroscopy of [1-13C]pyruvate metabolism is an established method to investigate in real-time the activities of lactate dehydrogenase (LDH) and pyruvate dehydrogenase (PDH) [3,4]. Here we sought to investigate, whether the reduced glucose metabolism during acute alcohol intoxication could be correlated to LDH or PDH activities. Real-time LDH and PDH activities were determined following 60 min of incubation with varying concentrations of ethanol, in viable perfused rat brain slices.Methods
We utilized dissolution dynamic nuclear polarization (dDNP) methodology to hyperpolarize [1-13C]pyruvate. 13C NMR spectroscopy was performed in a 5.8 T high-resolution NMR spectrometer. 13C spectra were acquired with a 10° nutation angle and repetition time of 5 s. Additionally, we used 31P NMR spectroscopy to detect high-energy phosphates as indicators of general slice health. 31P spectra of thermal equilibrium phosphate signals were acquired with a nutation angle of 51° and a repetition time of 3.8 s. All experiments were performed on 500 µm slices of the entire rat cerebrum perfused with artificial cerebral spinal fluid (aCSF) at 36° C. We compared two experimental conditions: pyruvate metabolism in regular aCSF and after 60 minutes of incubation with aCSF containing ethanol (10 mM n=1, 30 mM n=2, 60 mM n=1). The three ethanol concentrations equal blood alcohol concentrations (BAC) of 0.046 g/L (mild intoxication), 0.138 g/L (strong intoxication) and 0.276 g/L (severe intoxication). We used zero-order kinetic models to fit the signals of hyperpolarized [1-13C]pyruvate metabolism to [1-13C]lactate and [13C]bicarbonate. Individual T1 relaxation times and metabolic rate constants (k in intensity/s) were derived to compare the two experimental conditions using a zero-order assumption for both the LDH and the PDH reaction kinetics.Results
31P high-energy phosphate detection revealed good health of the slices in all experiments. An example sum of spectra (between 30-90s after bolus injection) of [1-13C]pyruvate, [1-13C]pyruvate hydrate, [1-13C]lactate and [13C]bicarbonate is depicted in Figure 1. Zero-order fitting of the integral data was utilized to retrieve individual T1 relaxation times and rate constants. An example of the fitting is depicted in Figure 2. Turbulences of slices in the NMR tube due to bolus injections of hyperpolarized [1-13C]pyruvate dissolutions were indirectly estimated by evaluating the deviation of the hyperpolarized [1-13C]pyruvate signal from the monoexponential fit derived from its tail (120 sec until the end). Within 60 s after bolus injection, all hyperpolarized [1-13C]pyruvate signals were deviating less than 25% from their monoexponential fits. T1 relaxation times were comparable across the two experimental conditions. [1-13C]pyruvate T1 53.2±4.3 s vs. 56.6±2.8 s (baseline vs. ethanol); [1-13C]lactate T1: 25.1±4.0 s vs. 35.3±1.3 s; [13C]bicarbonate T1: 20.3±0.5 vs. 21.1±2.2 s. The rate constants of hyperpolarized [1-13C]pyruvate to [1-13C]lactate showed a statistically significant decrease when compared with a paired t-test between the baseline and the ethanol condition. The individual rate constants are depicted in Figure 3. No statistically significant change was observed for [13C]bicarbonate.Limitations
The interpretation and generalization of our results is limited by the fact that experiments were undertaken in brain slices ex-vivo. Furthermore, the data presented here were obtained from four individual rats only. Our preliminary results warrant further investigation of ethanol effects on brain metabolism measured by hyperpolarized [1-13C]pyruvate.Conclusions
Ethanol incubation of brain slices significantly decreased [1-13C]lactate formation, but not [13C]bicarbonate formation, from hyperpolarized [1-13C]pyruvate. The ability to measure [1-13C]lactate formation by brain slices incubated with or without alcohol in real-time opens new ways for future investigation of brain metabolism perturbed by ethanol intoxication.Funding
This work was supported by the European Research Council (Grant No. 338040).Acknowledgements
No acknowledgement found.References
1. Volkow ND, Hitzemann R, Wolf AP, Logan J, Fowler JS, Christman D, et al. Acute effects of ethanol on regional brain glucose metabolism and transport. Psychiatry Res. 1990;35: 39–48.
2. Volkow ND, Kim SW, Wang G-J, Alexoff D, Logan J, Muench L, et al. Acute alcohol intoxication decreases glucose metabolism but increases acetate uptake in the human brain. Neuroimage. 2013;64: 277–283. doi:10.1016/j.neuroimage.2012.08.057
3. Golman K, in ’t Zandt R, Thaning M. Real-time metabolic imaging. Proc Natl Acad Sci USA. 2006;103: 11270–11275. doi:10.1073/pnas.0601319103
4. Menichetti L, Frijia F, Flori A, Wiesinger F, Lionetti V, Giovannetti G, et al. Assessment of real-time myocardial uptake and enzymatic conversion of hyperpolarized [1-13C]pyruvate in pigs using slice selective magnetic resonance spectroscopy. Contrast Media Mol Imaging. 2012;7: 85–94. doi:10.1002/cmmi.480
Figures
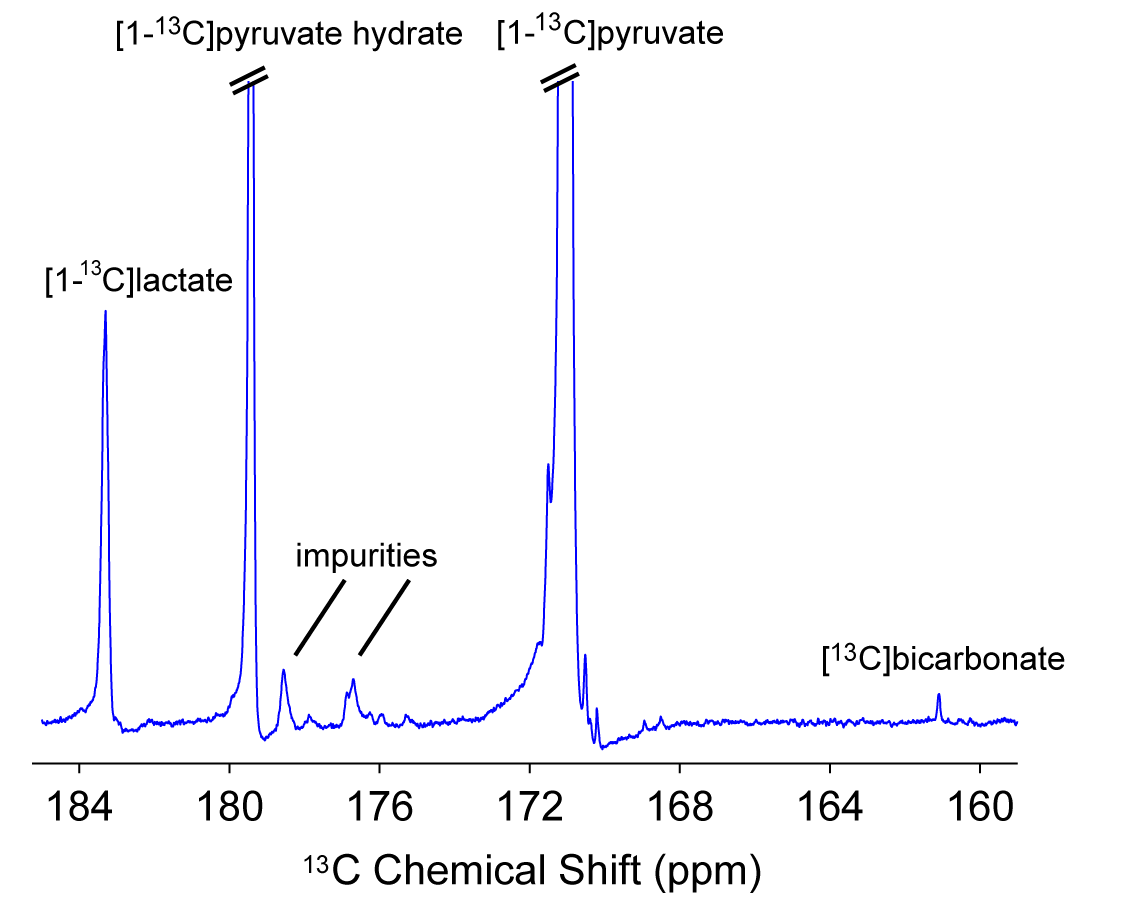
Figure 1: 13C NMR of brain slices.
Spectra between 30 and 90s after bolus injection of hyperpolarized [1-13C]pyruvate were summed to show a representative example of the signals acquired for [1-13C]pyruvate, [1-13C]pyruvate hydrate, [1-13C]lactate and [13C]bicarbonate. The example depicts spectra from a hyperpolarized [1-13C] pyruvate injection in the absence of ethanol.
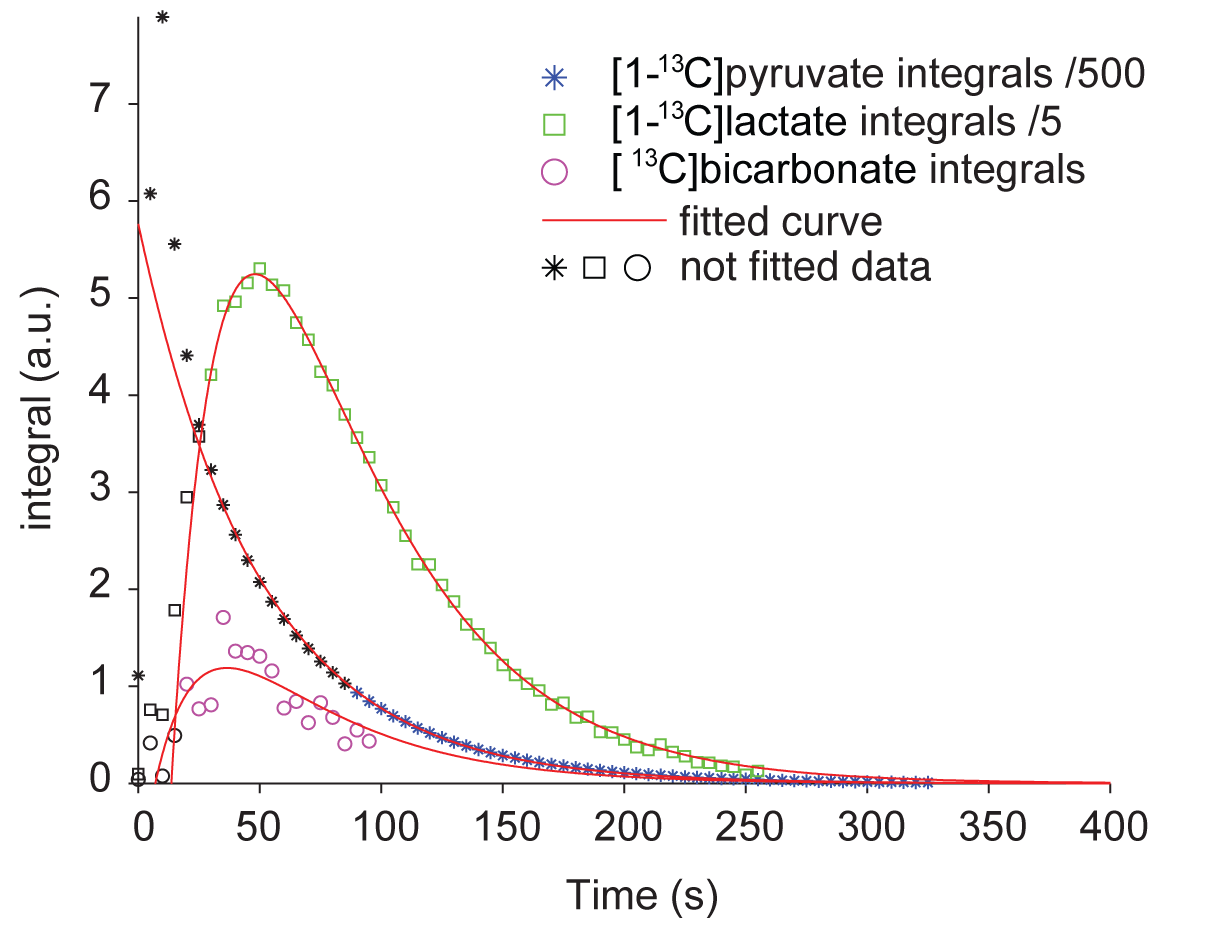
Figure 2: Fitting of integral data.
The figure depicts a representative example of the fitting of [1-13C]pyruvate, [1-13C]lactate and [13C]bicarbonate using a zero-order kinetic model. For better visualization of the time courses, [1-13C]pyruvate signals were divided by 500 and [1-13C]lactate signals were divided by 5. [1-13C]Pyruvate was fitted from 90 s onwards to account for slice movement due to bolus injections. The fitting of [1-13C]lactate and [13C]bicarbonate was only applied on integrals from spectra, in which a peak of the respective species was clearly visible. Data points that were hence excluded from the fitting are marked by black color.
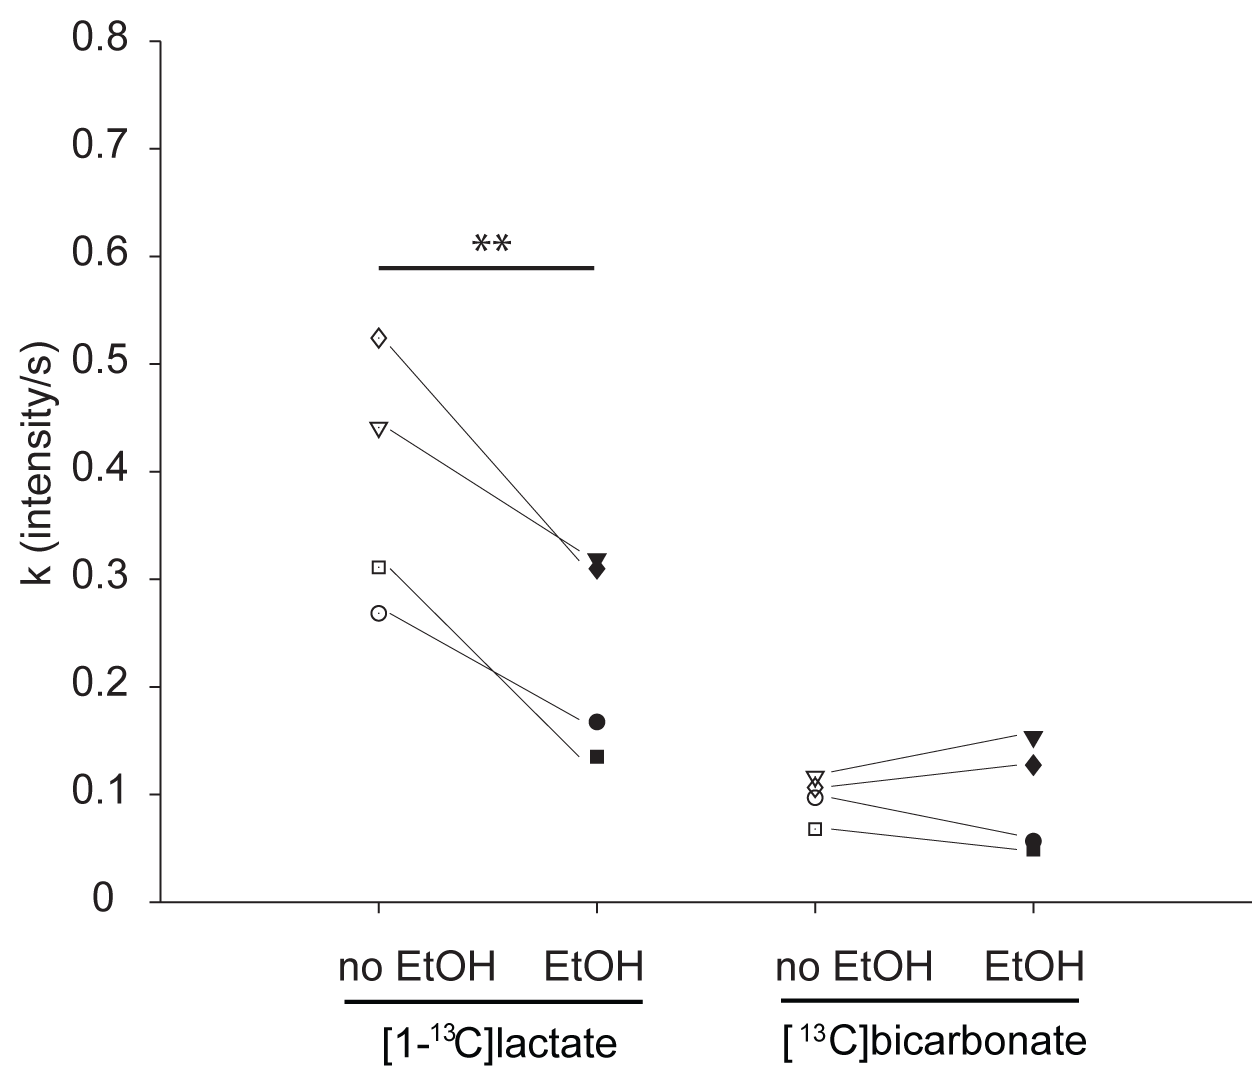
Figure 3: Comparison of metabolic rates.
The figure depicts the metabolic rates (k in signal intensity/s) retrieved from the kinetic model for [1-13C]lactate and [13C]bicarbonate production from hyperpolarized [1-13C]pyruvate. Individual rats are marked by unique markers and connected by thin lines. Double asterisks mark P-values < 0.01 (paired t-test).