3054
Dynamic Metabolic Imaging of Co-Polarized [2-13C]Pyruvate and [1,4-13C2]Fumarate Using 3D-Spiral CSI with Alternate Spectral Band Excitation1Diagnostic Radiology and Nuclear Medicine, University of Maryland, Baltimore, MD, United States, 2Siemens Healthcare, Erlangen, Germany
Synopsis
Metabolic imaging of biologically-relevant hyperpolarized agents allows measurement of metabolic processes in real time in-vivo. We demonstrate dynamic metabolic imaging of a single bolus of co-polarized [2-13C]pyruvate and [1,4-13C2]fumarate in control as well as in rats with liver necrosis. Chemical shift imaging (CSI) of such a mixture is challenging due to the large spectral dispersion of resulting resonances, which could lead to severe chemical shift displacement artifacts if acquired by conventional slice-selective excitation pulses. Here we obtain CSI information by a volumetric method using alternate 3D spectrally-selective excitation of sub-bands containing fewer resonances.
Introduction
Metabolic imaging of hyperpolarized 13C-labeled pyruvate (Pyr) and fumarate (Fum) has shown great potential in characterizing multiple diseases and assessing response to treatment, especially in cancer.1 Performing these measurements with a single injection of co-polarized substrates would be advantageous particularly for the clinical translation of this technology. Recently, a study reported on combined metabolic imaging of [1-13C]Pyr and [1,4-13C2]Fum in a rat model of necrosis.2 However, the small chemical shift (CS) dispersion of both substrates and their metabolic products (~25 ppm) does not allow using signal-to-noise (SNR)-efficient differential flip angles for substrate and products3 at clinical field strengths, potentially preventing the measurement of their saturation kinetics that requires effective 90° excitation of the products.4 Therefore, the goal of this study was investigating the feasibility of simultaneous metabolic imaging of co-polarized [2-13C]Pyr and [1,4-13C2]Fum with different excitation flip angles on a clinical MR scanner taking advantage of the much larger CS dispersion of [2-13C]Pyr and its products [2-13C]lactate (Lac) and [2-13C]alanine (Ala) (>160 ppm).Methods
Our method is based on 3D spiral chemical shift imaging (spCSI) developed for metabolic imaging of [2-13C]Pyr.5 To avoid CS displacement artifacts due to the large CS dispersion, the sequence applied frequency-selective RF pulses to alternatingly excite two spectral sub-bands each one followed by a fast 3D-spCSI readout. Although implemented on a clinical MR scanner, that study used a high-performance gradient insert to achieve a high spectral width (SW) of ~500 Hz with only 2 spatial interleaves to sufficiently separate the multiple resonances. However, on our GE 3T 750w MR scanner with maximum gradient strength of 33 mT/m and slew rate of 120 mT/m/ms, achieving this SW would require about 20 spatial interleaves for the same spatial parameters, hence, leading to unacceptable scan times of 24 s per band. Therefore, we applied number of signal averages (NSA) analysis used in least-squares estimation imaging approaches6,7 to investigate if smaller SW would be sufficient. For dynamic imaging, we applied the two RF pulses shown in Fig. 1. The 14 ms pulse for band-1 only excites Fum (2.5°) and both malate (Mal) resonances (10°). The 2.8 ms pulse for band-2 only excites resonances from Lac, Ala, and Pyr hydrate (Pyh), all with a 10° excitation flip angle. Pyh is measured instead of Pyr itself as it is in exchange with Pyr and not metabolically active. For the design of the RF pulses it is in important to sufficiently suppress excitation of Pyr in both bands and of Fum during excitation of band-2. The performance of the pulses was tested on a sample of co-polarized Pyr and Fum using a simple pulse-and-acquire MRS sequence that alternatingly used the two pulses (TR = 3 s) for 90 s. This acquisition was followed by the same sequence but using a 32-µs hard pulse (5.625°) for 4min. Co-polarization of the two substrates to about 35% was performed similarly as described in Ref. 2 using a GE SPINlab polarizer operating at 5T and 0.9K. In vivo experiments using dynamic 3D-spCSI were done in control as well as in rats with liver necrosis induced by CCl4 administration. A single-loop 13C surface coil placed on top of the liver was used for both signal excitation and reception.Results and Discussion
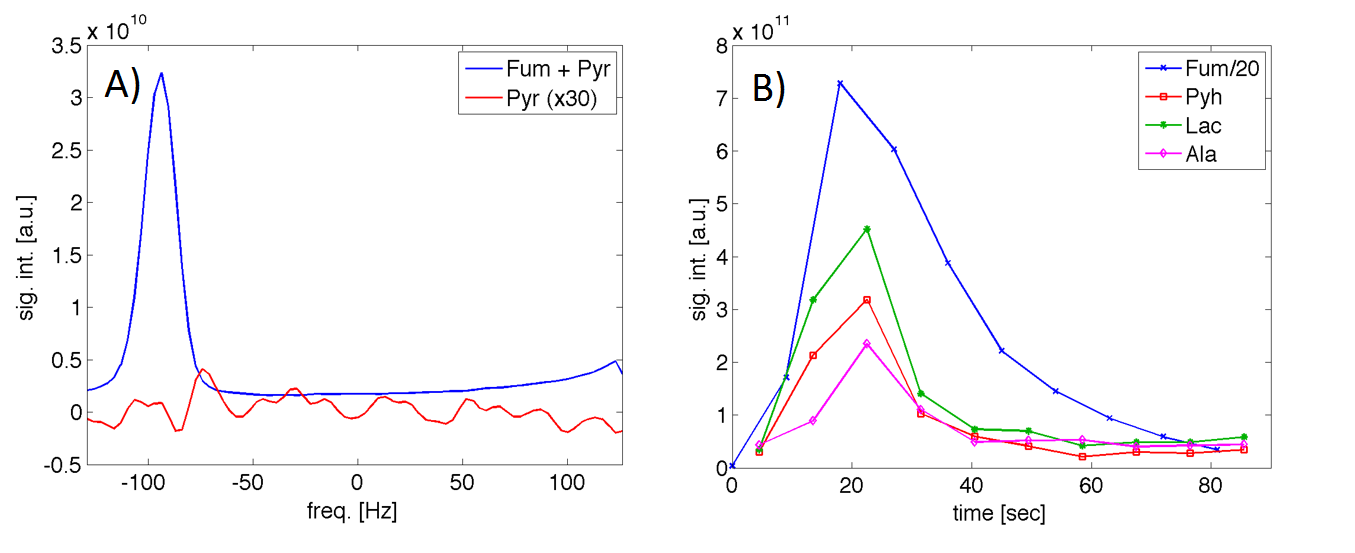
The NSA plots shown in Fig. 2 indicate an echo shift of 3.87 ms (corresponding to a SW of 258Hz) is sufficient to separate metabolites excited in the two alternating bands. The feasibility of our strategy is demonstrated by the time-averaged CSI data from a rat with CCl4-induced necrosis shown in Fig. 3. The spectra from an ROI in the liver show how well the peaks are separated in the spectra from different bands. In band-1, the SW is sufficient to detect both Fum and Mal peaks without aliasing. However, for band 2, relative to Lac, the Ala peaks were aliased -2 times and Pyh 3 times. This required separate reconstructions for the aliased signals to properly demodulate the phase.8 The corresponding metabolic maps are shown in Fig. 4. From the MRS measurement of the Pyr/Fum solution we calculated the residual excitation flip angle of the substrate resonances as: for Pyr 0.004° in band-1 and 0.015° in band-2, and for Fum 0.006° in band-2. The spectra from a liver ROI in a healthy control animal after injections of co-polarized Pyr/Fum and Pyr only also indicate sufficient suppression of Pyr (Fig. 5a). Metabolite time courses from liver ROIs demonstrate feasibility of dynamic imaging with a time resolution of 4.5 s per band (Fig. 5b).Acknowledgements
This work was supported by NIH grants R01 DK106395, R21 CA213020, R21 CA202694, and R21 NS096575.References
1. Kurhanewicz J, Vigneron DB, Brindle K, et al. Analysis of cancer metabolism by imaging hyperpolarized nuclei: prospects for translation to clinical research. Neoplasia. 2011;13:81–97.
2. Eldirdiri A, Clemmensen A, Bowen S, Kjaer A, Ardenkjaer-Larsen JH. Simultaneous imaging of hyperpolarized [1,4-13C2] fumarate, [1-13C]pyruvate and 18F–FDG in a rat model of necrosis in a clinical PET/MR scanner. NMR in Biomedicine. 2017;e3803.
3. Larson PEZ, Kerr AB, Chen AP, Lustig MS, Zierhut ML, Hu S, et al. (2008). Multiband excitation pulses for hyperpolarized 13C dynamic chemical-shift imaging. Journal of Magnetic Resonance. 2008;194(1), 121–127.
4. Xu T, Mayer D, Gu M, Yen Y-F, Josan S, Tropp J, et al. Quantification of in vivo metabolic kinetics of hyperpolarized pyruvate in rat kidneys using dynamic 13C MRSI. NMR in Biomedicine. 2011;24(8), 997–1005.
5. Josan S, Hurd R, Park JM, et al. Dynamic metabolic imaging of hyperpolarized [2-13C]pyruvate using spiral CSI with alternating spectral band excitation. Magnetic Resonance in Medicine. 2014;71(6):2051-2058.
6. Reeder SB, Wen Z, Yu H, et al. Multicoil Dixon chemical species separation with an iterative least-squares estimation method. Magnetic Resonance in Medicine 2004;51:35–45.
7. Wiesinger, F., Weidl, E., Menzel, M. I., Janich, M. A., Khegai, O., Glaser, S. J., Haase, A., Schwaiger, M. and Schulte, R. F. IDEAL spiral CSI for dynamic metabolic MR imaging of hyperpolarized [1-13C]pyruvate. Magnetic Resonance in Medicine. 2012;68:8–16.
8. Mayer, D, Levin, YS, Hurd, RE, Glover, GH, & Spielman, DM. Fast metabolic imaging of systems with sparse spectra: application for hyperpolarized 13C imaging. Magnetic Resonance in Medicine. 2006;56(4), 932–937.
Figures