3053
Variable Resolution Echo-Planar Imaging for Improved Quantification of Hyperpolarized 13C Metabolism1Radiology & Biomedical Imaging, UC San Francisco, San Francisco, CA, United States
Synopsis
Unlike ionizing imaging modalities, the SNR in MRI is proportional to voxel volume, but downsampling or voxel averaging after acquisition only improves SNR by the square root of the voxel volume. To take advantage of this distinction, we use a frequency selective imaging approach to independently excite the hyperpolarized 13C substrate (pyruvate) and downstream metabolites (lactate, alanine, and bicarbonate). This allows us to tailor the spatial resolution for each metabolic product, yielding high-resolution images for pyruvate as well as quantification at a coarser resolution for the lower SNR metabolites, such as bicarbonate, which would be undetectable at the higher resolution.
Introduction
Hyperpolarized (HP) [1-13C]pyruvate and other substrates have been used to non-invasively image metabolism in cancer [1], diabetes [2] and heart disease [3]. Despite a 10,000-fold increase in polarization, SNR can often be the limiting factor when imaging metabolic products – such as 13C bicarbonate for C1-pyruvate, or TCA metabolites for C2-pyruvate - due to slow transport across the cell membrane, low rates of conversion, and potential T1 differences. This results in a 10 to 100-fold difference in SNR between pyruvate and metabolites [4], yielding a mismatch in optimal spatial resolutions. In particular, high resolution is especially important for pyruvate in order to minimize partial-volume effects between the vasculature and extravascular/extracellular spaces, but is unsupportable for lower SNR metabolites.
Unlike ionizing imaging modalities, the SNR in MRI is proportional to voxel volume but downsampling or voxel averaging after acquisition only improves SNR by $$$\sqrt{voxel \ volume}$$$. There is therefore an SNR benefit to acquiring data at a coarser resolution rather than downsampling after acquisition. To explore this potential, in this work we use a frequency selective imaging approach to independently excite each metabolite of interest. This allows us to tailor the spatial resolution for each metabolic product, yielding high-resolution images for pyruvate and coarser resolution for downstream metabolites while maintaining adequate SNR for each.
Methods
To assess the efficacy of this approach, two HP [1-13C]pyruvate injections were performed using healthy Sprague Dawley rats (n = 4). Data were acquired with a metabolite-selective imaging approach [5, 6], using a singleband spectral-spatial RF pulse for excitation and a single-shot echoplanar readout for encoding. The first acquired data with a constant 2.5×2.5 mm in-plane resolution, while the second injection was acquired with the variable resolution approach (2.5mm for pyruvate, 5.0mm for lactate, 7.5mm for alanine and bicarbonate). As each metabolite is acquired independently, this is readily accomplished by scaling the readout and blip gradients Gx and Gy by the increase in voxel size (1/2 for lactate, 1/3 for alanine and bicarbonate) while maintaining the same readout duration. All other scan parameters were identical for both injections. The slice thickness was 15-20mm for each animal, large enough to completely cover one kidney. 20 timepoints were acquired for pyruvate and all 3 metabolites with a temporal resolution of 3s. For analysis, the peak SNR and area under the curve (AUC) ratio were determined for all three metabolites. To account for the difference in voxel size, the signal in the variable resolution datasets were scaled by a factor of 1/(voxel size)2.Results & Discussion
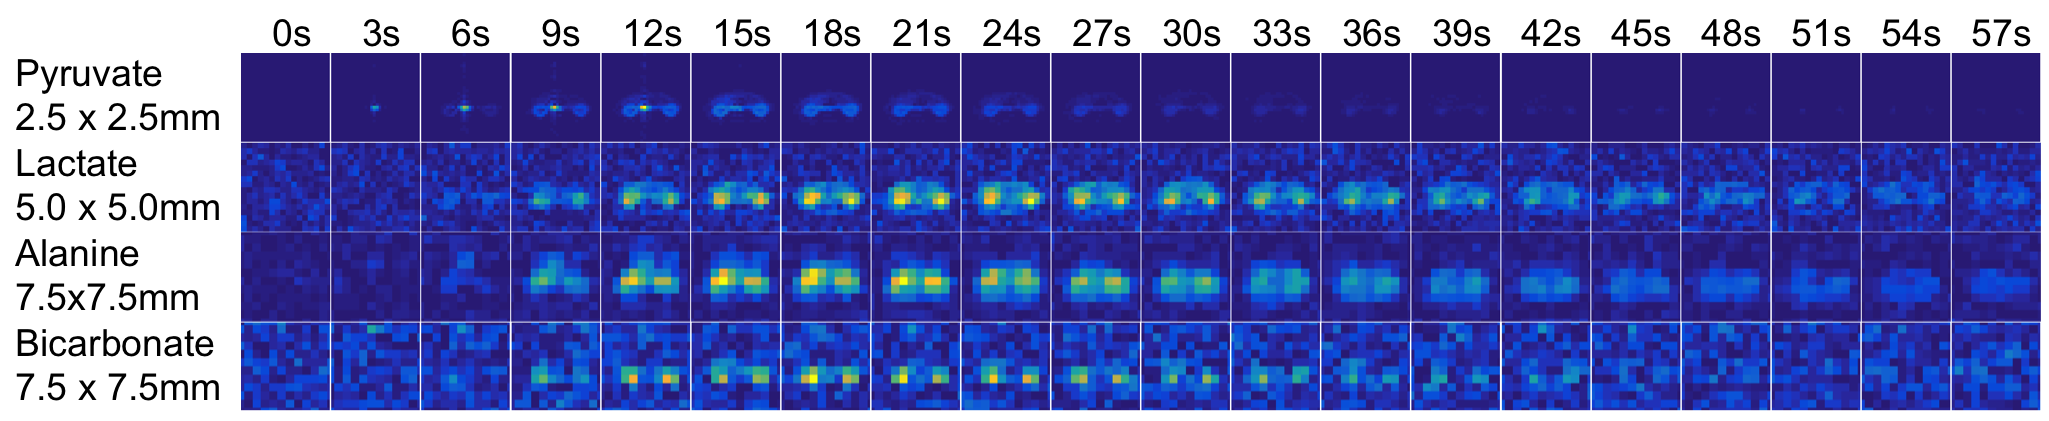
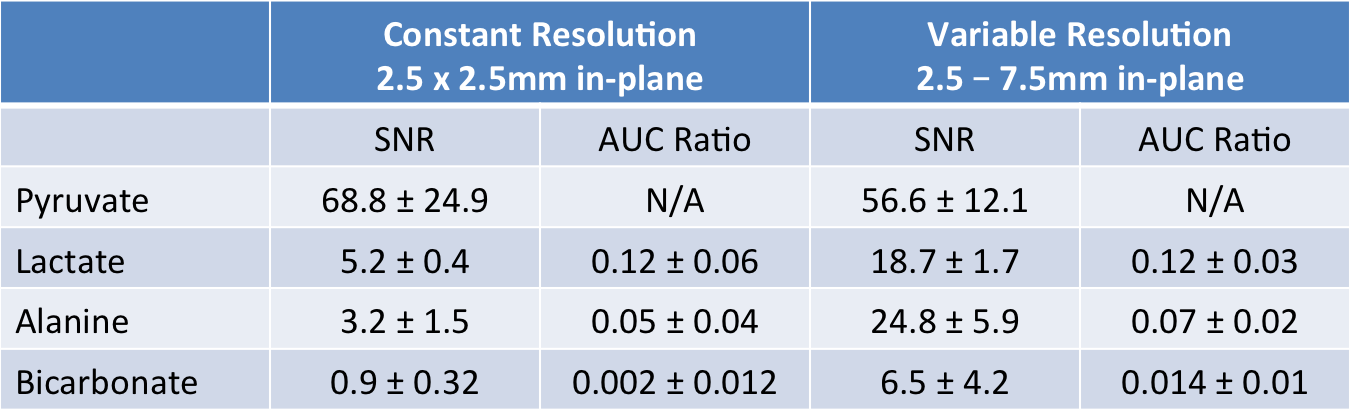
The advantages of the variable resolution approach can be seen in the dynamic timecourse of pyruvate metabolism in Fig. 1 and 2. At the constant 2.5×2.5mm in-plane resolution (Fig. 1), bicarbonate was not visible on the dynamic images and only slightly above the noise floor (SNR = 4.8) in the area under the curve image (Fig. 3). In contrast, the frequency selective imaging approach allowed for independent resolutions for each metabolite. At 3-fold larger voxel size (7.5×7.5mm in-plane resolution), conversion to bicarbonate was clearly visible on both the dynamic timecourse (Fig. 2; peak SNR = 8.8) and AUC maps (Fig. 3; SNR = 30.4). Overall, the peak SNR improved by 3.6-fold for lactate, 7.8-fold for alanine, and 7.2-fold for bicarbonate (Table 1), in good agreement with the expected SNR increase of 4 and 9, respectively.
By using the same readout waveform and bandwidth, each metabolite map had the same TE, noise statistics, and echo-spacing (i.e. sensitivity to off-resonance artifacts). Quantification was not impacted, as signal differences from larger voxels are readily accounted for by a scale factor of 1/(voxel size)2. This was borne out by the lactate-to-pyruvate AUC ratio, which was not statistically different (0.12 ± 0.06 and 0.12 ± 0.03, respectively; p = 0.93) for the constant (2.5×2.5mm) and variable (5×5mm) acquisition.
Conclusion
We found that a variable resolution approach to metabolic imaging with HP 13C substrates can ameliorate tradeoffs between spatial resolution and SNR, enabling both higher resolution for the injected substrate as well as quantification at a coarser resolution for the lower SNR metabolites, such as bicarbonate, which would be undetectable at the higher resolution. This is enabled by a frequency-selective imaging approach, allowing for independent resolutions for each metabolite. This may be important for future clinical studies to maximize metabolite SNR and allow for metabolism quantification while minimizing partial volume effects of vascular signals from pyruvate.Acknowledgements
This work was supported by NIH grants R01EB017449, R01EB016741, R01CA183071, and P41EB013598.References
- Nelson, S.J., et al., Metabolic Imaging of Patients with Prostate Cancer Using Hyperpolarized [1-13C]Pyruvate. Science Translational Medicine, 2013. 5(198): p. 198ra108.
- Keshari, K.R., et al., Non-invasive in vivo imaging of diabetes-induced renal oxidative stress and response to therapy using hyperpolarized 13C dehydroascorbate magnetic resonance. Diabetes, 2014.
- Cunningham, C.H., et al., Hyperpolarized 13C Metabolic MRI of the Human Heart: Initial Experience. Circulation Research, 2016.
- Park, J.M., et al., Volumetric spiral chemical shift imaging of hyperpolarized [2-13c]pyruvate in a rat c6 glioma model. Magnetic Resonance in Medicine, 2015. 75(3): p. 973-984.
- Cunningham, C.H., et al., Pulse sequence for dynamic volumetric imaging of hyperpolarized metabolic products. Journal of Magnetic Resonance, 2008. 193(1): p. 139-146.
- Gordon, J.W., D.B. Vigneron, and P.E.Z. Larson, Development of a Symmetric EPI Framework for Clinical Translation of Rapid Dynamic Hyperpolarized 13C Imaging. Magnetic Resonance in Medicine, 2016: p. DOI: 10.1002/MRM26123.
Figures