3043
Improved Sensitivity of Cellular MRI Using Phase-cycled Balanced SSFP of Ferumoxytol Nanocomplex Labeled Macrophages at Ultra-high Field1Laboratory of FMRI Technology (LOFT), Mark & Mary Stevens Neuroimaging and Informatics Institute, Keck School of Medicine, University of Southern California (USC), Los Angeles, CA, United States, 2Shandong Medical Imaging Research Institute, School of Medicine, Shandong University, Jinan, China, 3Broad Stem Cell Institute, Keck School of Medicine, University of Southern California (USC), Los Angeles, CA, United States
Synopsis
This study aimed to investigate the feasibility and sensitivity of cellular MRI with ferumoxytol nanocomplex labeled macrophages at ultrahigh magnetic field of 7T. Different labeling strategies, labeling times, magnetic field strengths, imaging sequences and post processing methods were evaluated to achieve the optimal protocol. Combining ferumoxytol, heparin and protamine (HFP nanocomplex) labeled macrophages with balanced steady-state free precession (bSSFP) sequence on a 7T MRI scanner and post processed by root mean square (RMS) combination of multiple phases showed the best contrast in phantom and ex vivo experiments, reaching a sensitivity for detecting a few tens of cells.
Introduction
Cellular MRI is a growing field to detect, track, and quantify cells that allows for studying cellular events related to disease processes and may be used as a biomarker of intervention 1. Super-paramagnetic iron oxide nanoparticles (SPIO) are the most common approach to label cells. However, the sensitivity is relatively low with a detection limit on the order of thousands of cells. The purpose of this study was to investigate the feasibility and sensitivity of cellular MRI with ferumoxytol (Feraheme, AMAG Pharmaceuticals) nanocomplex labeled macrophages at ultrahigh magnetic field of 7T.Methods
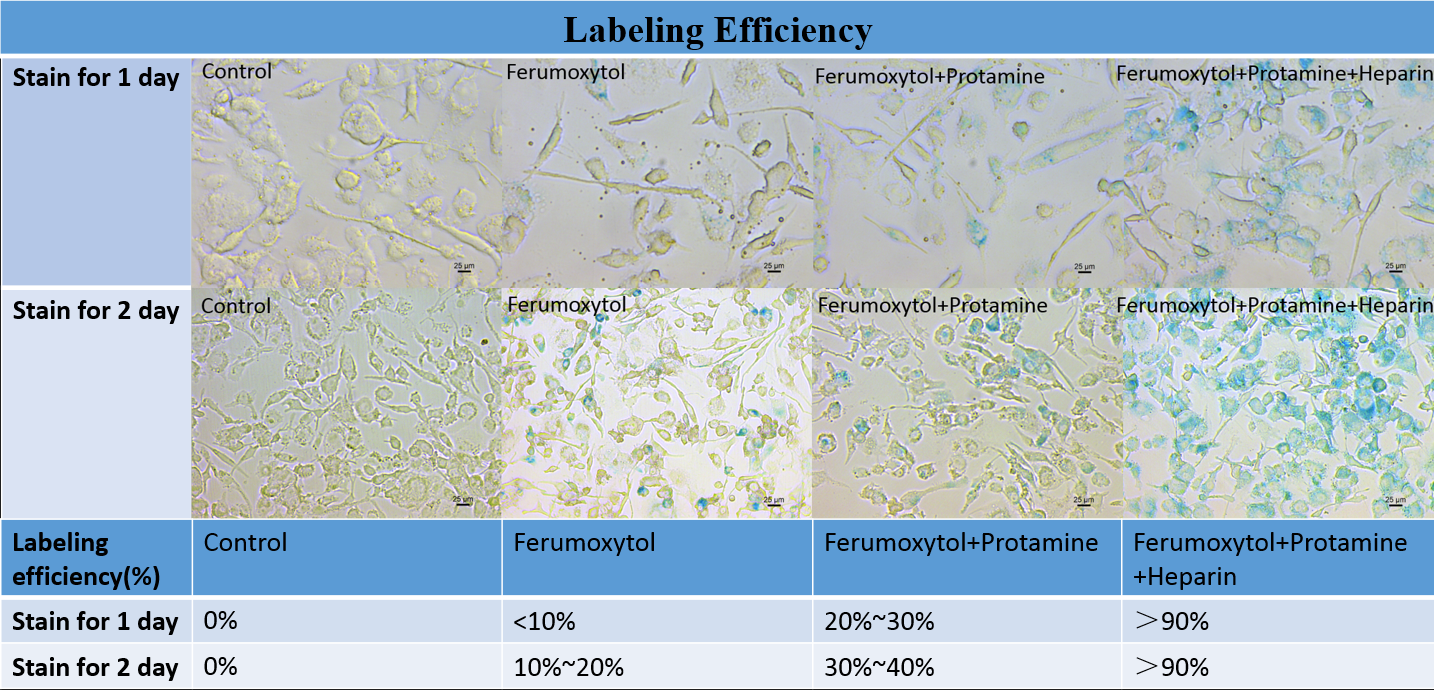
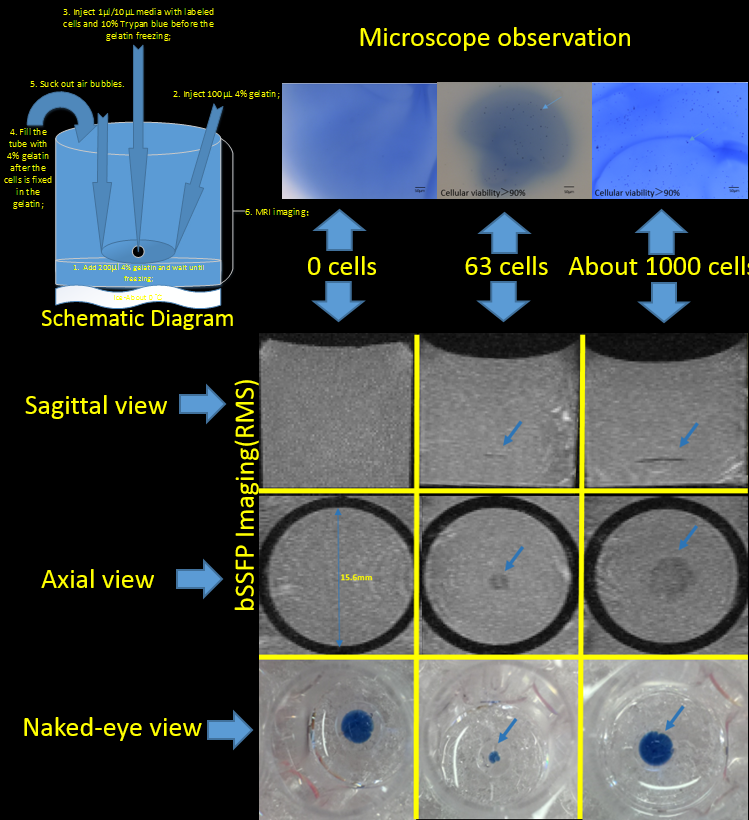
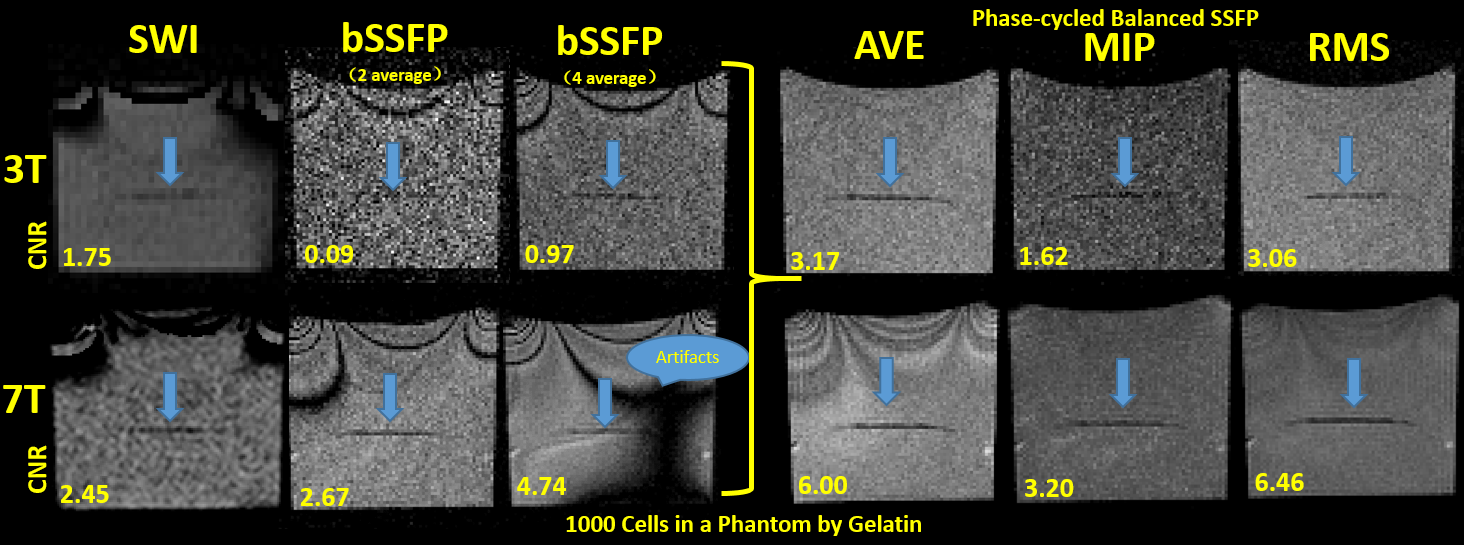
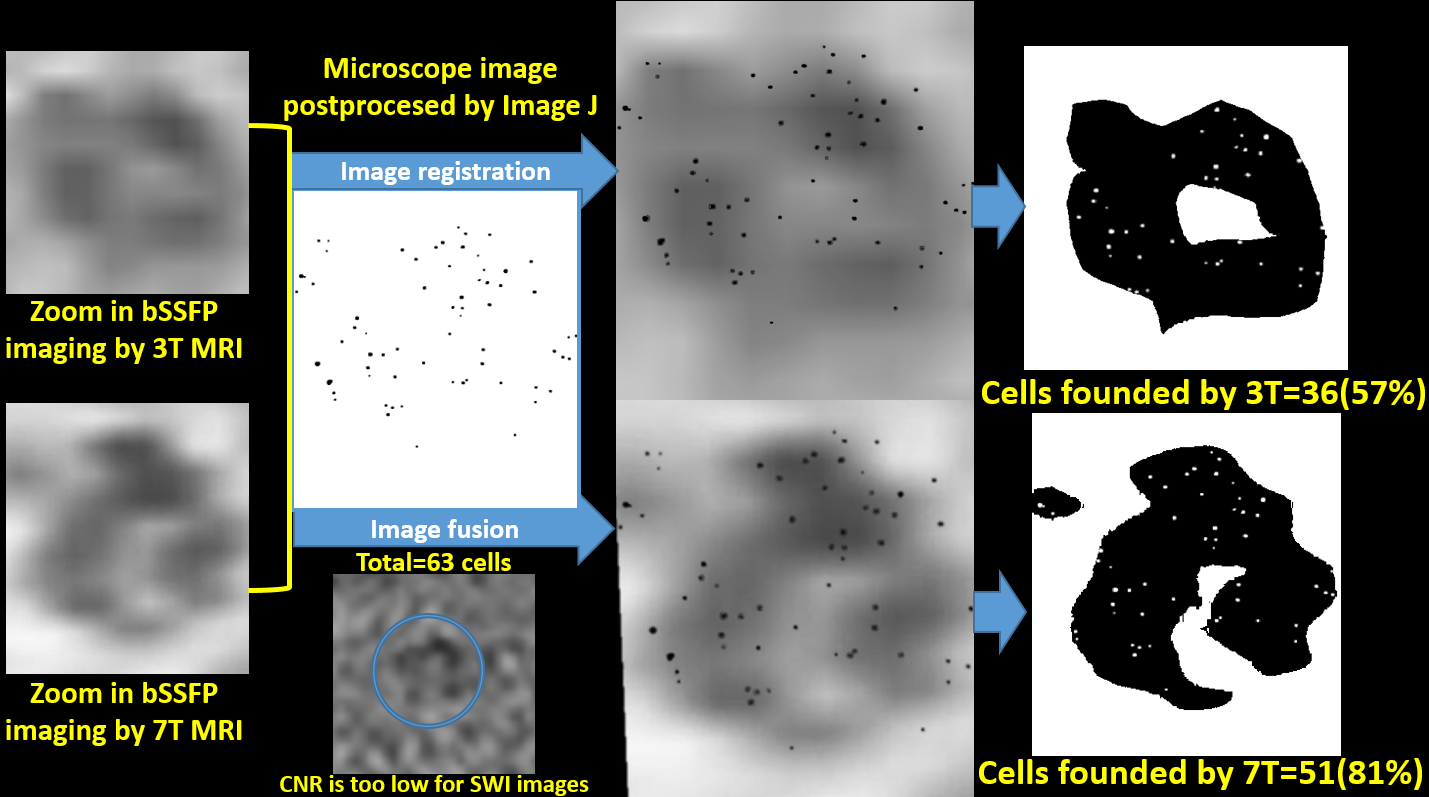
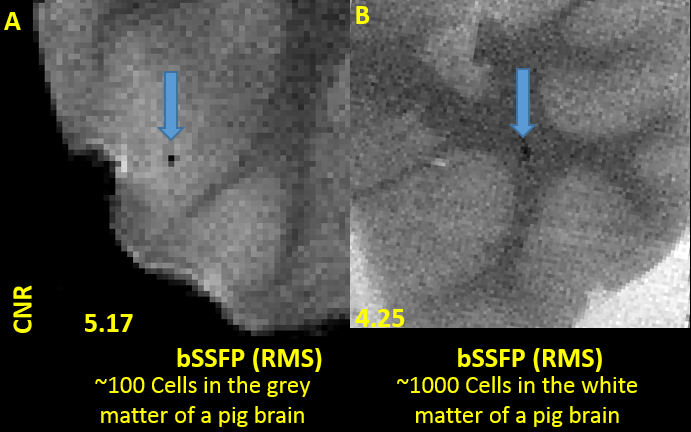
Self-assembling nanocomplexes by combining ferumoxytol, heparin and protamine (HFP) was introduced recently for efficient cell labeling and strong T2 relaxivity 2. THP-1 cells that are a human promonocytic cell line derived from acute monocytic leukemia were maintained at 37°C and incubated for 3 days to convert THP-1 cells into a phagocytic macrophage cell line. Different labeling strategies and labeling times were tested on the THP-1 induced macrophages (Fig. 1), including 1) ferumoxytol only; 2) ferumoxytol + protamine; and 3) ferumoxytol + heparin + protamine (HFP nanocomplex)2 which were used to label the cells for two days. The labeled cells were injected into a double layer of gelatin phantom visible to both microscope and MRI (Fig. 2). All MR images were acquired on a 3T Prisma and 7T Terra system (Siemens, Erlangen, Germany) with 32-channel head coils. Different MRI pulse sequences using susceptibility weighted imaging (SWI) and balanced steady-state free precession (bSSFP) were applied with the following parameters: FOV=100mm, resolution=0.2×0.2×0.2mm3, for 3T TR=32ms/12ms, TE=20ms/6ms and FA=15°/50°, measurement time=10.43min/2.05min for each average of SWI and bSSFP respectively; for 7T TR=25ms/9ms, TE=13ms/5ms and FA=15°/40°, measurement time= 8.33min/1.58min for each average of SWI and bSSFP respectively). To minimize the banding-artifact in bSSFP, phase cycling was performed with a total step of 16. The average (AVE), maximum intensity projection (MIP) and root mean square (RMS) images were generated for the phase-cycled bSSFP images using a custom MATLAB program. Contrast to noise ratio (CNR) was calculated. Image co-registration between microscope and MRI was performed using bspline transformation and mutual information metric provided in Elastix 3. Ex vivo experiments were then performed using a Formalin fixed pig brain injected with ~100 and ~1000 labeled cells respectively.Results
As shown in Fig. 1, self-assembling nanocomplexes by combining ferumoxytol, heparin and protamine show much higher labeling efficiency (>90%) than the other two methods. Less than 100 cells are detectable in the gelatin phantom by both 3T and 7T MRI (Fig. 2 and Fig. 4). 7T data show almost double CNR compared to corresponding sequence at 3T (Fig. 3). Using phase-cycled bSSFP at 7T, the CNRs of AVE (6.00) and RMS (6.46) combined images are remarkably higher compared to SWI (2.45)(Fig. 3). Among all combined phase cycled bSSFP images, RMS shows the highest CNR with minimal banding (Fig. 3). Figure 4 shows the co-registered images of microscope and MRI. With the same threshold of 40% signal decrease, 7T MRI can detect more cells (51/63) than the 3T scanner (36/63). On pig brain, both ~100 and ~1000 cells can be detected with CNR of 5.17 in grey matter and 4.25 in white matter (Fig. 5).Discussion
Self-assembling nanocomplexes by combining ferumoxytol, heparin and protamine (HFP)2 was a newly introduced cell labeling strategy which was found to be the most efficient method (>90%) in our study. Using combined phase-cycled bSSFP, less than 100 cells are detectable in a gelatin phantom using both 3T and 7T clinical MRI scanners (Fig. 2 and 5), which is a significant improvement compared to previous results of imaging minimal 1000 cells 2,4. SWI has been the primary imaging method for SPIO labeled cells by taking advantage of the “blooming” effect on MR phase images 5. Balanced SSFP offers an appealing alternative to SWI for cell tracking using MRI 6,7, by taking advantage of 1) the high SNR efficiency; 2) the unique T2/T1 contrast ideally suited for detecting SPIOs that primarily generate negative T2-contrast with moderate effects on T1; and 3) the strong intra-voxel magnetic gradients generated by a SPIO labeled cell will cause multiple bands emanating from the cell 8.Conclusion
The proposed cellular MRI with ferumoxytol nanocomplex labeled macrophages at 7T has improved sensitivity to detect <100 cells. Since both ferumoxytol and 7T Terra are FDA approved 9, the proposed method has great translational potential and may have potential clinical applications in neoplasm, multiple sclerosis and Alzheimer’s disease.Acknowledgements
This work was supported by National Institute of Health (NIH); contract grant number: UH2-NS100614.References
1. Makela AV, Murrell DH, Parkins KM, Kara J, Gaudet JM, Foster PJ. Cellular Imaging With MRI. Topics in Magnetic Resonance Imaging 2016; 25(5): 177-86.
2. Thu MS, Bryant LH, Coppola T, et al. Self-assembling nanocomplexes by combining ferumoxytol, heparin and protamine for cell tracking by magnetic resonance imaging. Nature medicine 2012; 18(3): 463-7.
3. Klein S, Staring M, Murphy K, Viergever MA, Pluim JP. Elastix: a toolbox for intensity-based medical image registration. IEEE transactions on medical imaging 2010; 29(1): 196-205.
4. Shichinohe H, Kuroda S, Kudo K, et al. Visualization of the superparamagnetic iron oxide (SPIO)-labeled bone marrow stromal cells using a 3.0-T MRI—a pilot study for clinical testing of neurotransplantation. Translational stroke research 2012; 3(1): 99-106.
5. Liu S, Buch S, Chen Y, et al. Susceptibility-weighted imaging: current status and future directions. NMR Biomed 2016.
6. Heyn C, Ronald JA, Mackenzie LT, et al. In vivo magnetic resonance imaging of single cells in mouse brain with optical validation. Magn Reson Med 2006; 55(1): 23-9.
7. Foster-Gareau P, Heyn C, Alejski A, Rutt BK. Imaging single mammalian cells with a 1.5 T clinical MRI scanner. Magn Reson Med 2003; 49(5): 968-71.
8. Heyn C, Bowen CV, Rutt BK, Foster PJ. Detection threshold of single SPIO-labeled cells with FIESTA. Magn Reson Med 2005; 53(2): 312-20.
9. Hughes B. 2009 FDA drug approvals.
Nature Reviews Drug Discovery 2010; 9(2): 89-92.
Figures