3042
Investigating Off-Resonance Fat Modulations in the TurboSPI Signal to Improve R2* Mapping for Quantitative Cell Tracking1Biomedical Translational Imaging Centre (BIOTIC), Halifax, NS, Canada, 2Physics, Dalhousie University, Halifax, NS, Canada
Synopsis
TurboSPI has the potential to offer quantitative cell tracking with high fidelity R2* mapping. However, early in vivo studies demonstrated that accuracy of the R2* fitting deteriorates in the presence of off-resonance fat signal. In this work, we investigate these findings further with an in vitro study. We used in silico and in vitro data to develop and test a more comprehensive decay model that accounts for fat oscillations in the TurboSPI signal. The proposed model results in improved R2* estimates in the presence of fat.
Introduction
Tracking immune cell migration in vivo is valuable for understanding the immunogenic response in longitudinal studies. While traditional cell tracking methods such as balanced steady-state free precession (bSSFP) are sensitive to superparamagnetic iron oxide (SPIO) contrast, they have limited specificity and the analysis is solely semi-quantitative.
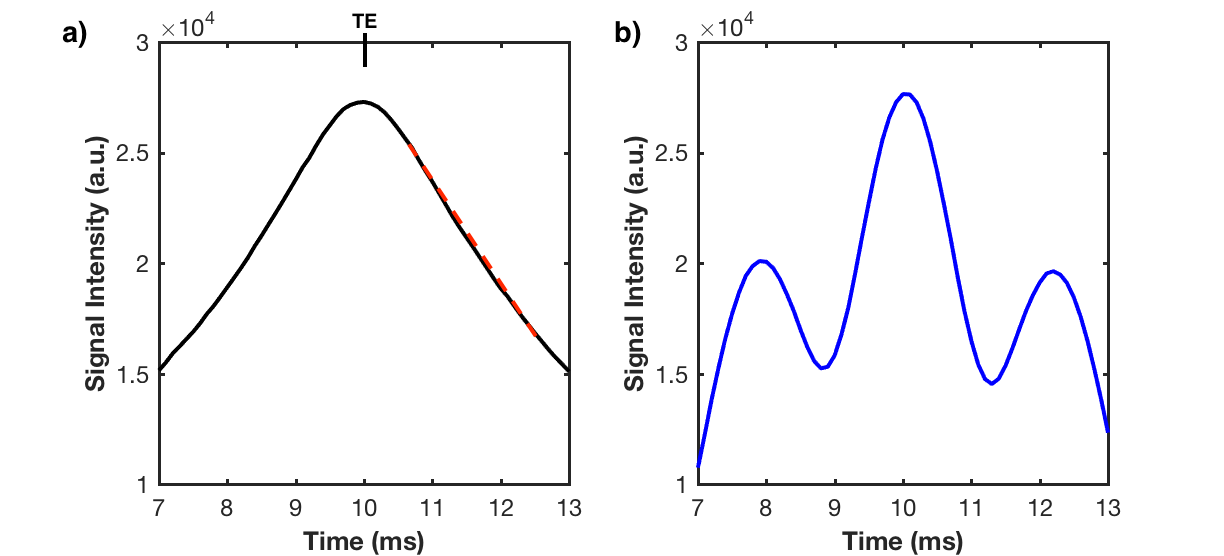
Quantitative cell tracking is better for analyzing immune recruitment, but reports of validated quantification with SPIO-labeled cells are rare. TurboSPI, a multi-echo single point imaging (SPI) technique, can provide quantification with R2* mapping at high temporal resolution1 (Figure 1a). Unfortunately, an in vivo pilot study revealed that current mono-exponential R2* fitting techniques had poor performance in the presence of fat2. Fat creates off-resonance modulations in the signal time course (Figure 1b), and can be mistakenly fit as signal decay. Effective fat suppression is challenging due to line broadening of tissue near labeled cells and we found that disregarding voxels with off-resonance behavior underestimates R2* in voxels with mixed content (Figure 2).
In this study we use in vitro and in silico methods to better understand and account for the fat contribution to the TurboSPI signal, with the goal of improving the accuracy of quantitative cell tracking.
Methods
Nine phantoms were created with SPIO labeled CD8+ T cells (1.5x10⁶ cells/tube) and varying fractions of peanut oil: 20% fat with no cells, 40% fat with no cells, and cells with fat fractions of 0, 5%, 10%, 15%, 20%, 30% and 40%. MR data were acquired on a 3T pre-clinical scanner (Agilent, Santa Clara, CA) using 2D TurboSPI (TR/TEeffective = 250/10ms, ETL = 8, ESP = 10ms, 96x96 matrix, FOV = 30mmx30mm) with and without a fat saturation pulse. R2* mapping was performed using an in-house program in Matlab (Mathworks, Natick MA).
In silico data were obtained through Monte Carlo simulation in Matlab3,4. The simulation allows a proton to diffuse through a randomly generated grid of “perturbers” (SPIO-labeled cells) with user defined size (R), change in susceptibility (dχ), volume fraction (ζ), and diffusion coefficient (D). The total magnetic field it experiences on its journey is used in the spin echo simulation. A fat oscillation (3.5 ppm off resonance; 440 Hz at 3T) was added to the data for varying fat fractions.
TurboSPI is an ideal candidate for a curve fitting approach, by virtue of its high temporal resolution. We fit the decay of simulated data using an adapted Dixon signal model for simultaneous estimation of R2* and fat fraction5. $$S = We^{iθw}e^{iθτt}e^{-R2*(w) t} +Fe^{iθf}e^{αt}e^{-R2*(f) t}$$
W, F, θw, and θf are signal amplitudes and phase for the water and fat signal respectively, R2*(w) and R2*(f) are decay rates for the water and fat species, α is the frequency offset for fat, and θτ is a slow time dependent phase change from the SPIO. We stepped through different fat fractions to determine the accuracy of fat estimation and stability in R2* estimation.
Results and Discussion
The table in Figure 2 demonstrates the inaccuracy of the simple mono-exponential R2* fit when fat is present, even when using fat saturation. Ideally, the R2* estimate should be equal for equal concentrations of labeled cells. These data indicate that the fidelity of the R2* map deteriorates drastically in the presence of fat if no correction is used.
The simulation outputs a signal time course for the full FID and spin echo. We began by investigating how the shape of the time course changes with added fat signal (Figure 1b). To improve accuracy, the fat contribution in our R2* fit must be considered.
We fit the simulated data using the hybrid Dixon-R2* signal model for fat = 1% to 100%. The model agrees well with the simulated data, as illustrated in Figure 3. We begin at t = 10.5ms to avoid non-exponential behavior near the peak3. Figure 4 demonstrates stability in the T2* estimate across most fat fractions for different cell volume fractions.
When applying this method to the in vitro data (Figure 5), we found that when fat is present, the comprehensive model gave superior R2* estimates, which should translate to more reliable estimates of cell concentration. In the absence of significant fat content, the new technique appears to slightly underestimate R2*. Therefore, in future work, we propose an adaptive approach that uses fat fraction to prescribe the fitting model.
Conclusion
Simple mono-exponential R2* mapping methods are incapable of reliably distinguishing SPIO-labeled cells from fat in TurboSPI. Simultaneous R2* and Dixon fat estimation can separate these signal contributions to provide more accurate R2* mapping and thus more accurate quantification in cell tracking studies.Acknowledgements
Both JR and KB contributed equally to this work. KB would like to acknowledge funding from the Natural Sciences and Engineering Research Council (NSERC). ZOM would like to acknowledge funding from the IWK Health Centre.References
1. Rioux JA,Brewer KD, Beyea SD, Bowen CV. Quantification of super paramagnetic iron oxide with large dynamic range using TurboSPI. Journal of Magnetic Resonance. 2012;216:152-160
2. O’Brien-Moran Z, Tremblay M-L, Davis CB, Rioux JA, Brewer KD Improved tracking and quantification of SPIO-labeled cells using bSSFP with compressed sensing TurboSPI. ISMRM 25th Meeting and Scientific Exhibition, Honolulu, HI. 2017; page 3073.
3. Rioux JA, Bowen CV, Kiselev VG. Relaxation with Diffusion near Magnetic Particles and Cells: Analytical Description and Experiment. ISMRM 20th Meeting and Scientific Exhibition, Melbourne, AUS. 2012;page 1712.
4. Patterson SA, Beyea SD, Bowen CV. FMRI using high flip-angle alternating steady state balanced SSFP supported by Monte Carlo studies. ISMRM 19th Meeting and Scientific Exhibition, Montreal, QC. 2011; page 3112.
5. Glover GH. Multipoint Dixon technique for water and fat proton and susceptibility imaging. Journal of Magnetic Resonance Imaging. 1991;1(5):521-530.
Figures