3040
Manganese enhanced MRI in organotypic rat hippocampus slices: A correlative study with synchrotron X-ray nanoprobe analysis and electron microscopy.1National Institute of Neurological Disorders and Stroke, National Institutes of Health, Bethesda, MD, United States, 2Argonne National Laboratory, Advanced Photon Source, Argonne, IL, United States, 3National Institute of Biomedical Imaging and Bioengineering, National Institutes of Health, Bethesda, MD, United States
Synopsis
Manganese (Mn2+) Enhanced Magnetic Resonance Imaging (MEMRI) can be used for different applications such as tracing neuronal connections or functional imaging. However, Mn2+ uptake and transport mechanisms are still unclear. These mechanisms were studied by imaging sub-cellular Mn2+ in an organotypic hippocampal slice culture by coupling MEMRI, TEM and X-ray methodologies. The data indicates that Mn2+ is located at synapses but not in mitochondria.
PURPOSE
MEMRI can be used for several applications such as tracing neuronal connections or functional imaging1-3. There are known to be multiple pathways of Mn2+ cell entry. However, mechanisms of Mn2+ cell accumulation and transport are still unclear. Visualization of the Mn2+ subcellular distribution will advance our understanding of these mechanisms. Therefore, the aim of this study is to obtain maps of the subcellular distribution of Mn2+ using TEM and X-ray elemental mapping of specimens obtained from an organotypic hippocampal slice culture (OHSC).METHODS
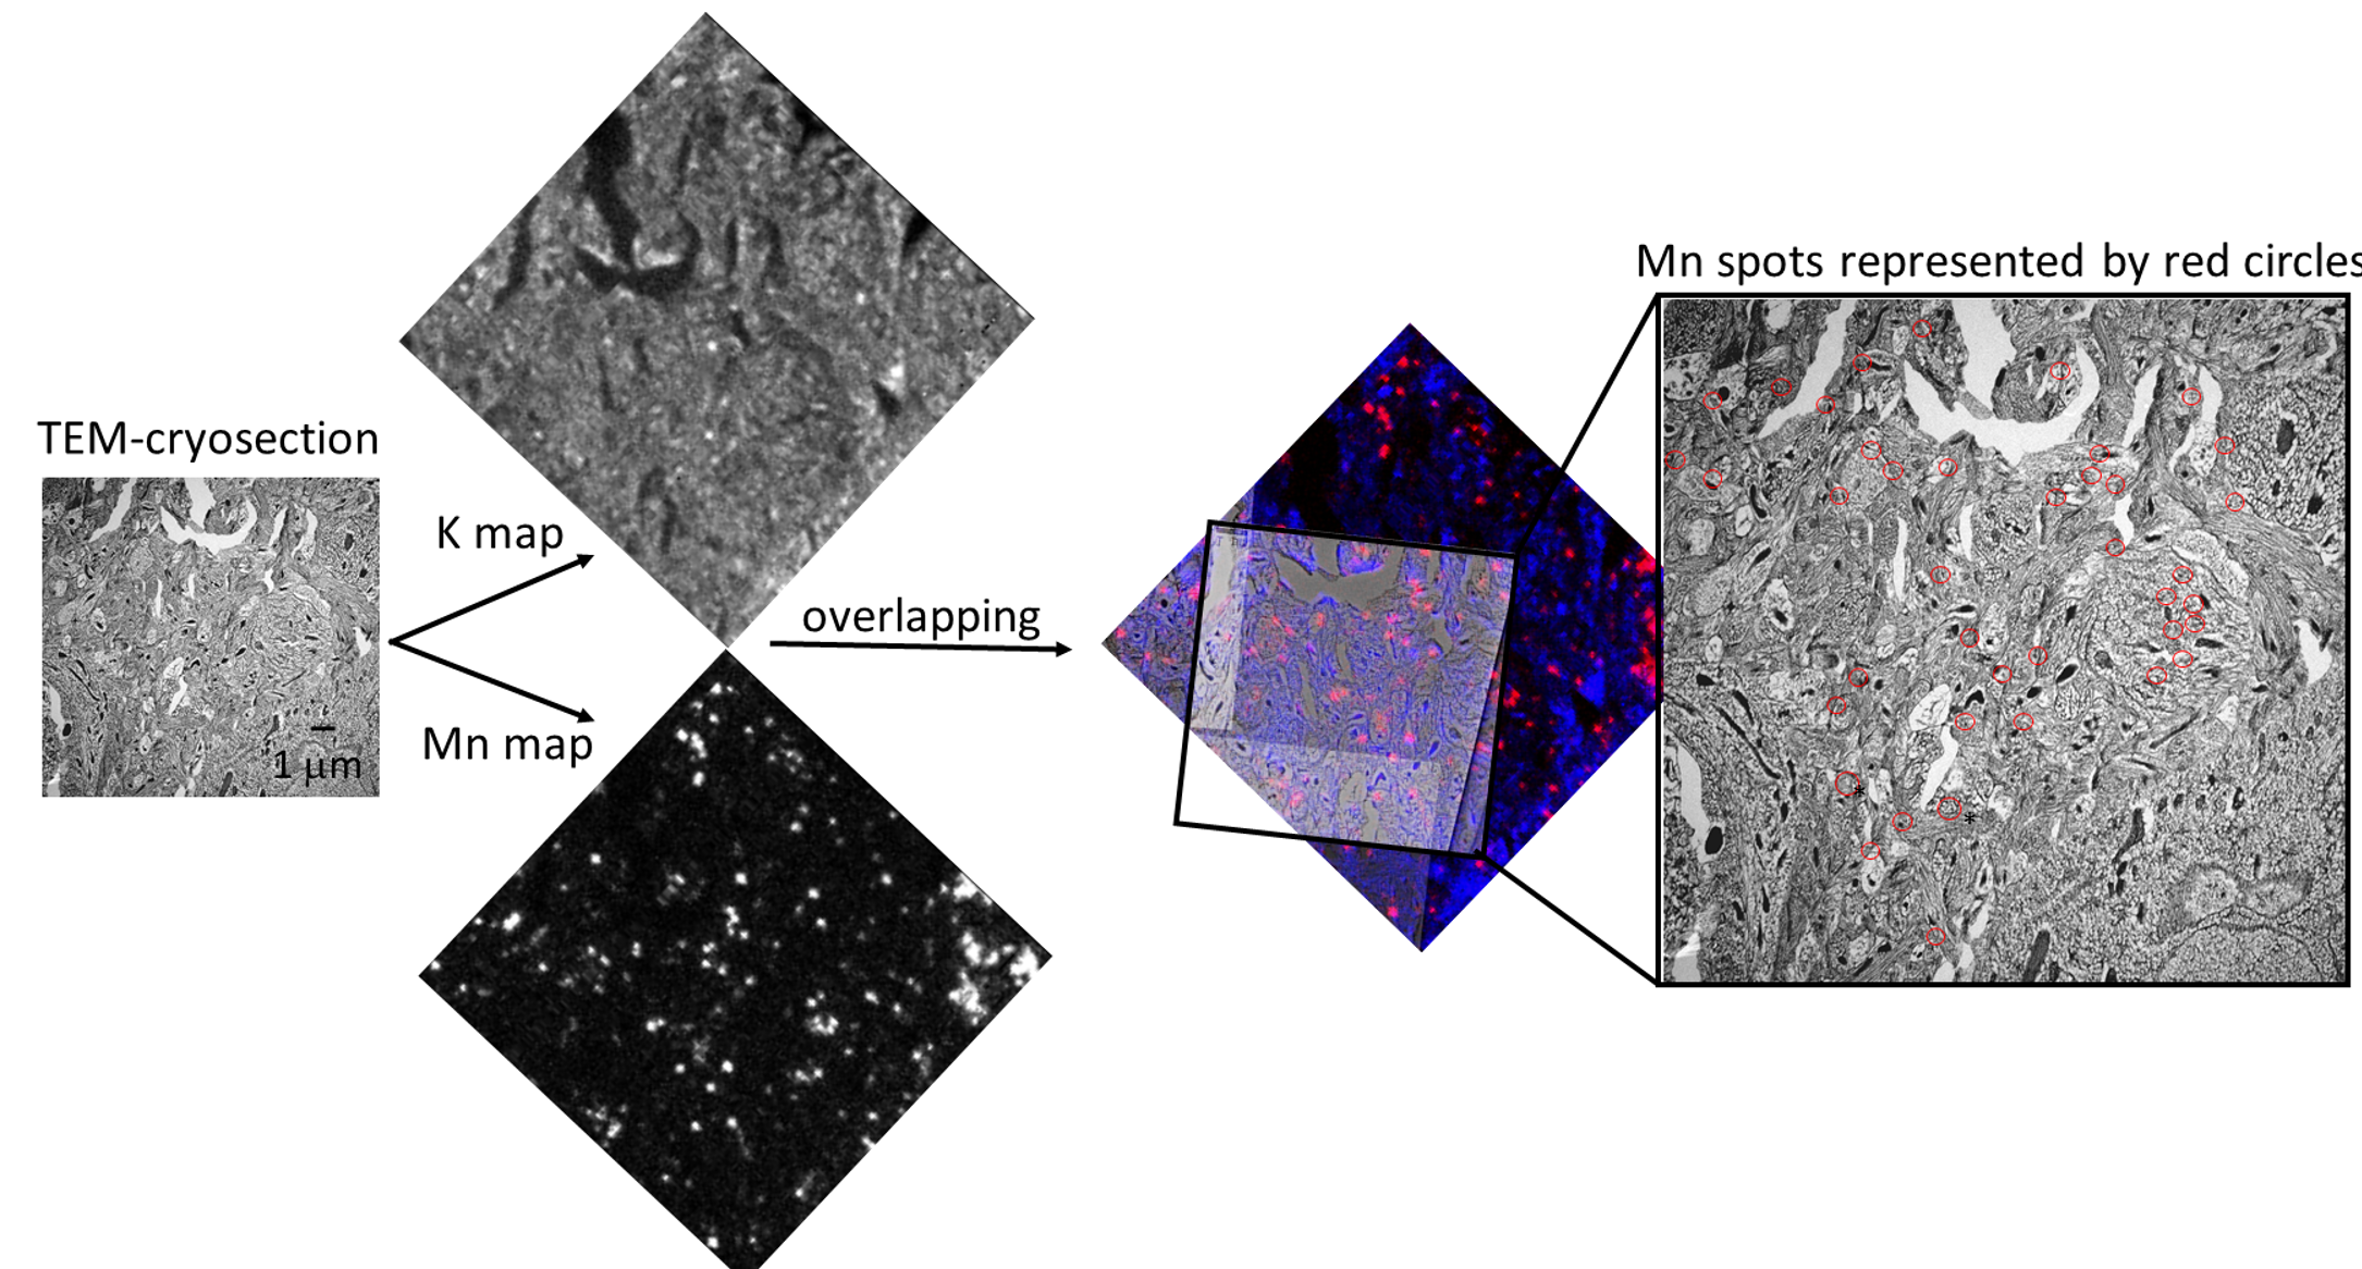
Animals: Postnatal day six Sprague Dawley rats were used for this study. Slice preparation and culture: Hippocampi were dissected and coronal sections (300 μm) were sliced in an artificial CSF (aCSF) at 4ºC 4. Slices were cultured at the interface medium/air on a membrane insert (incubation at 37 ºC, 5% CO2) for 7 or 8 days (D7, D8). Mn incubation: On D7 or D8, MnCl2 was added at 0, 10, 25, 50, 100 or 150 μM to the culture medium for 24h before the experiment (Fig.1). MEMRI and electrophysiology: the membrane insert was cut around the slice, rinsed, and placed in a perfusion chamber. Slices were continuously perfused with bubbled aCSF. For the MRI, T1 weighted images (FLASH, TR=25 ms, TE=4.65 ms, voxel size: 50 μm3) were acquired on an 11.7T MRI system (Bruker) using a surface/volume cross coil configuration. The highest Mn2+ concentration giving good contrast was 100 μM and was chosen for the rest of the experiments. Cell viability after MnCl2 incubation was evaluated by electrophysiology. The intrinsic excitability and membrane properties were measured by whole cell recording of the principal neurons of CA3. The slice viability was measured by input-output curves from field recordings along the Schaffer collaterals (Field Excitatory Post-Synaptic Potentials, fEPSP; Fig.2). TEM and X-ray Nanoprobe: OHSC were rapidly frozen, cryo-sectioned, freeze-dried and imaged5. Sections with abundant neuropil were selected. X-ray maps with 80-nm pixel size of Mn and K were obtained in the bionanoprobe at beamline 2-ID-D of the Advanced Photon Source at Argonne National Laboratory (Fig.3)RESULTS
Figure 2 shows that the membrane properties of OHSC after incubation for 24h with 100 μM MnCl2 are similar to those of the control. Similar membrane potentials (control -64.4 ± 1.0 mV, MnCl2 -64.7 ± 1.0 mV, tTEST p = 0.6) and input resistances (control 204.4 ± 22.0 MΩ, MnCl2 159.7 ± 30.6 MΩ, tTEST p = 0.26) were recorded in both groups. Intrinsic excitability of the neurons was also unchanged, with control cells’ rheobase at 101.6 ± 17.6 pA and incubated OHSC at 94.7 ± 16.8 pA, tTEST p = 0.78. Synchrotron x-ray maps (Fig.3) show that Mn2+ accumulation is confined to structures with diameters of 330 ± 200 nm and an average concentration of 70 ± 30 mM. Mn2+ structures are mainly intracellular with some clusters apparently at synapses. Focal regions containing Mn2+ atoms are distributed in the neuropil at an areal density of 0.5 / µm2 and at a concentration of 2 mM. No significant accumulation of Mn2+ was detected in mitochondria.DISCUSSION
After incubation with 100 μM MnCl2 for 24h, the OHSC exhibits normal cellular function. This is important for the analysis of the X-ray images. Mn2+ is mainly located in intracellular compartments. Interestingly, our data show frequent Mn2+ accumulations in synapses in agreement with the current Mn2+ transport theory describing Mn2+ synaptic transmission via glutamatergic vesicle6,7. In contrast, our data show a rare presence of Mn2+ in mitochondria, in contrast to the literature8. Some clusters are in cell body cytoplasm but do not appear to be associated with any cellular organelles.Acknowledgements
No acknowledgement found.References
1Lin and Koretsky, 1997, MRM, 38:378-388; 2Aoki et al., 2004, Neuroimage, 22:1046-1059; 3Daoust et al., 2014, Neuroimage, 96:133-42; 4Fuller and Dailey, 2007, CSH protocol; 5Pivovarova et al., 2002, J. Neurosci., 22:10653-61; 6Takeda et al., 2002, Neuroscience, 114:669-74; 7Lin and Koretsky, 1997, Magn. Reson. Med., 38:378-88; 8Morello et al., 2008, Neurotoxicology, 29:60-72.Figures
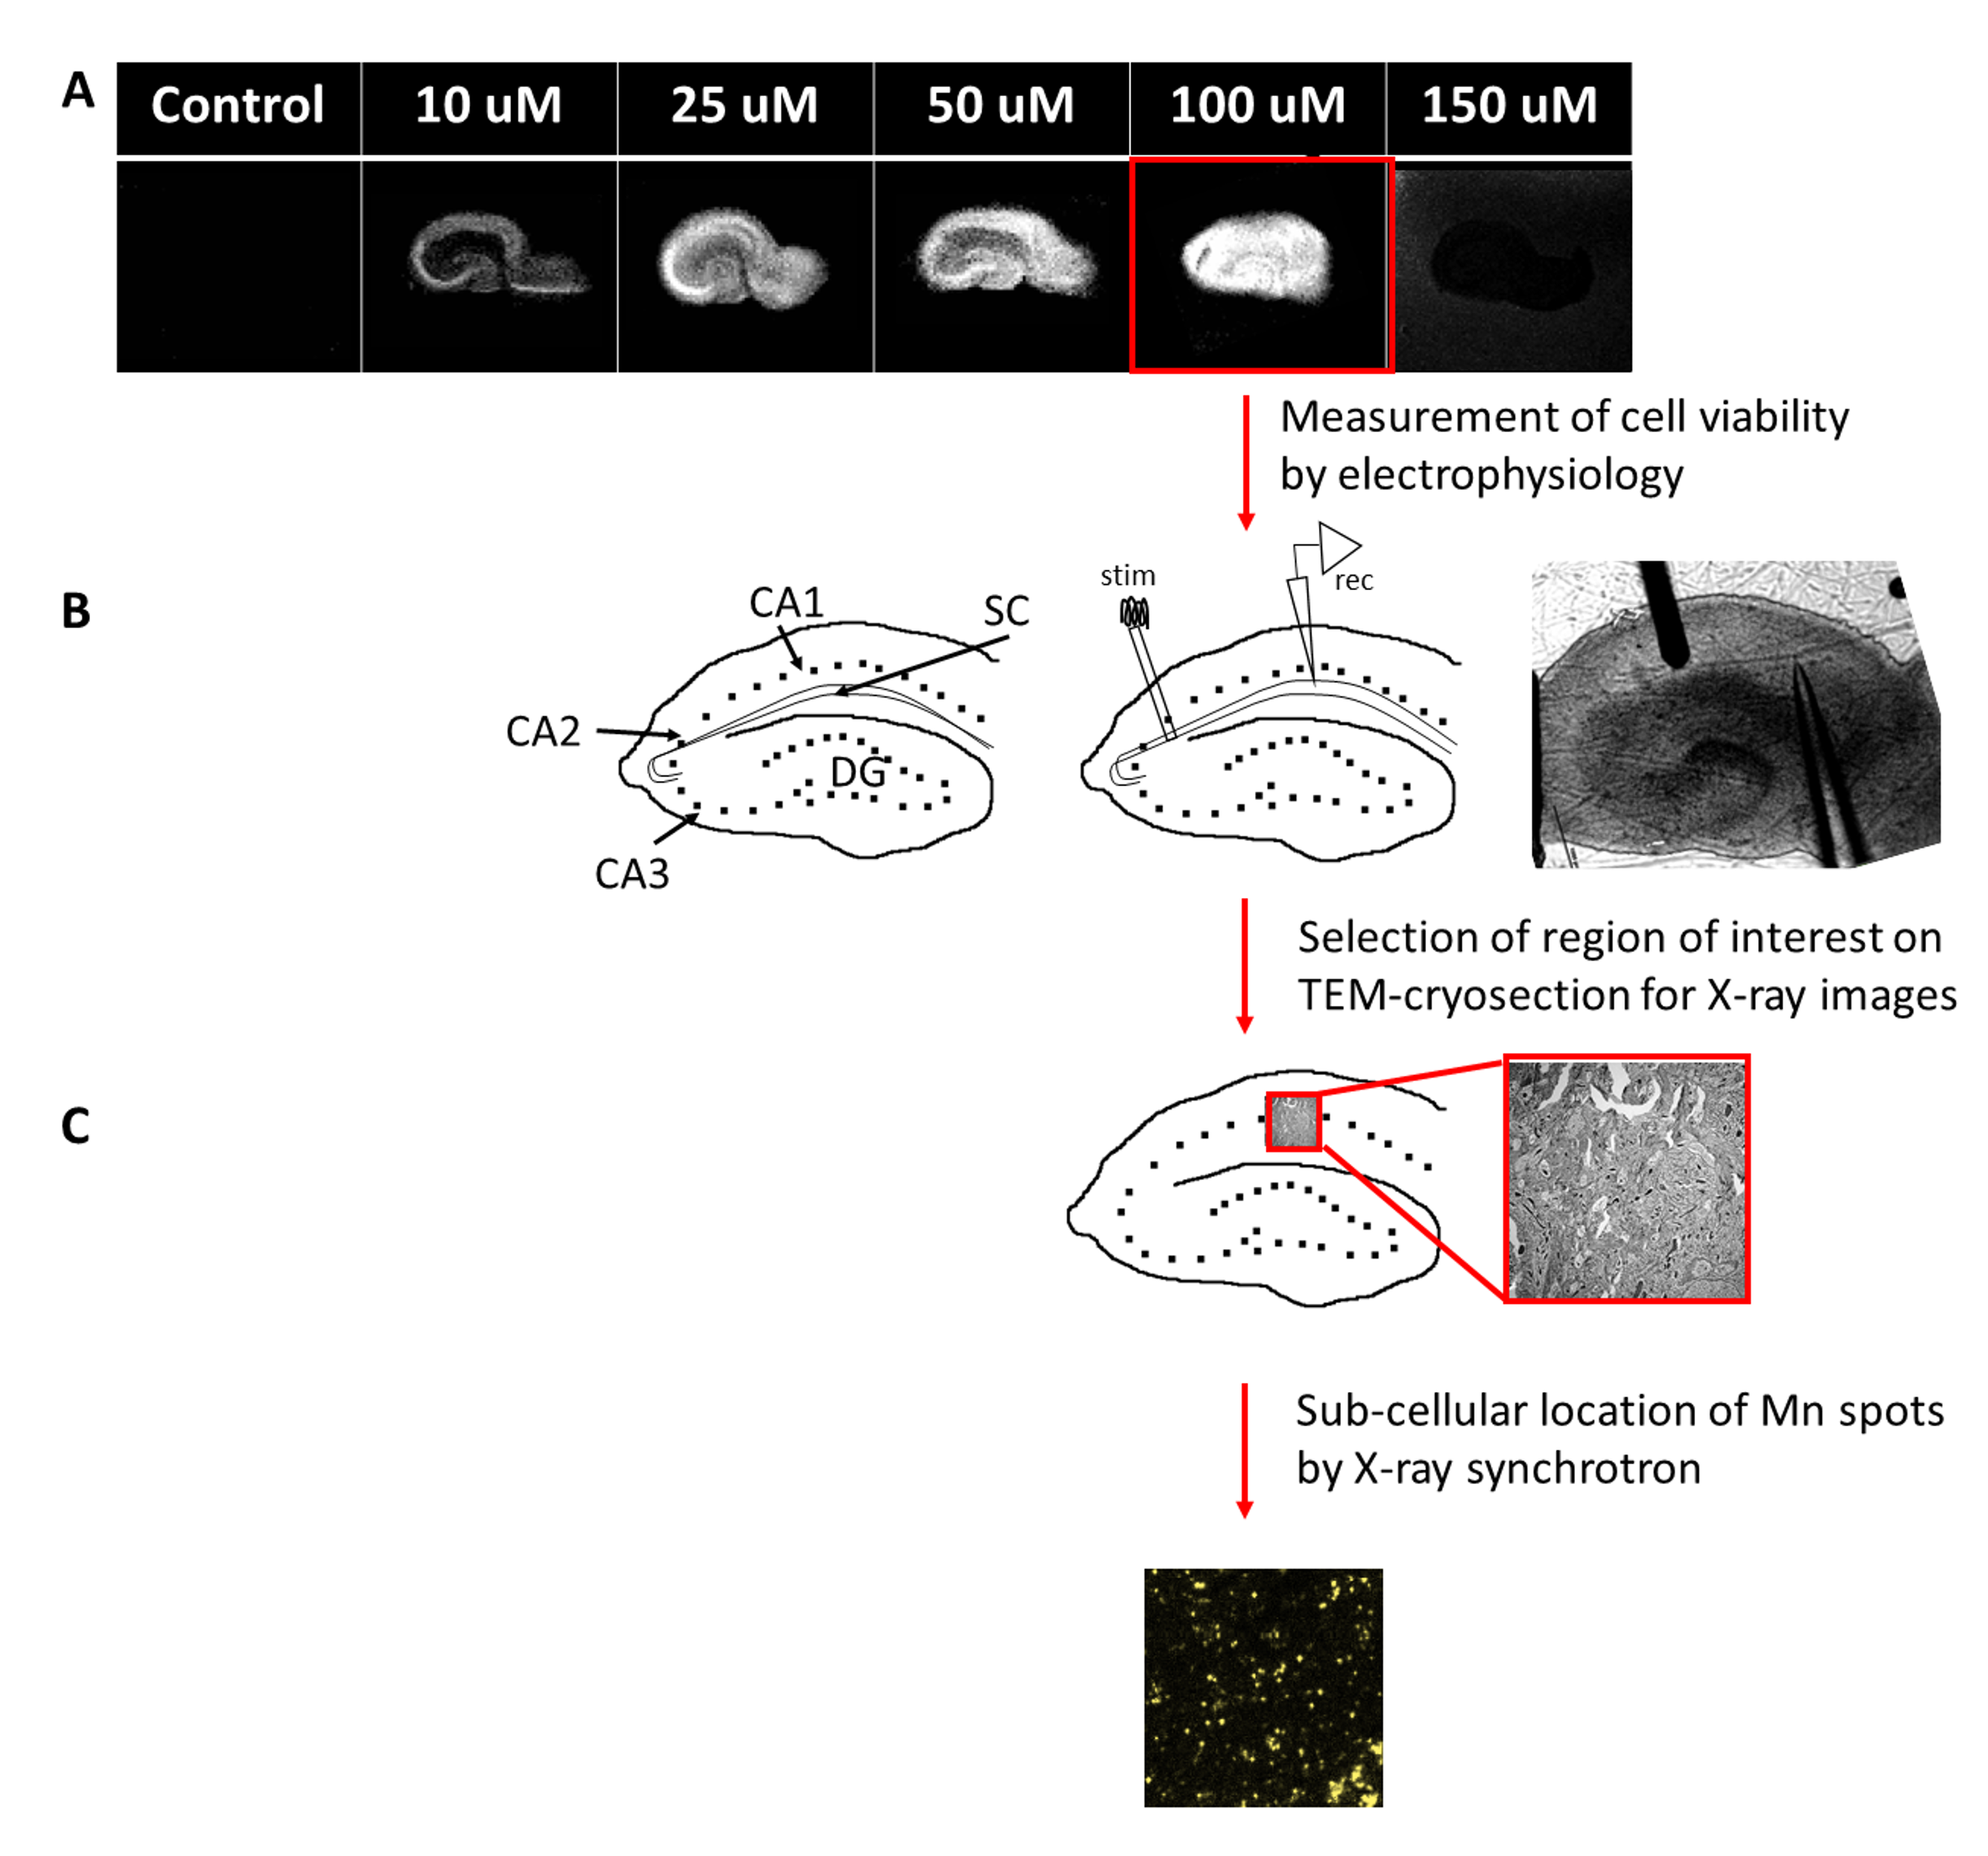
Figure 1: Experience scheme.
A- T1-w MRI of OHSC after Mn2+ incubation at different concentrations for 24h.
B- OHSC membrane properties measurement via field recording of CA1 and single cell recording of CA3. These measurements permit evaluation of cell viability after Mn2+ incubation.
C- TEM of cryosectioned OHSC facilitates identification of regions of interest in X-ray maps (neuropil and mitochondria). Samples were then sent to the Advanced Photon Source and imaged to obtain elemental maps.
CA1/2/3: Cornu Ammon; SC: Schaffer collaterals; DG: dentate gyrus; stim: stimulation; rec: records.
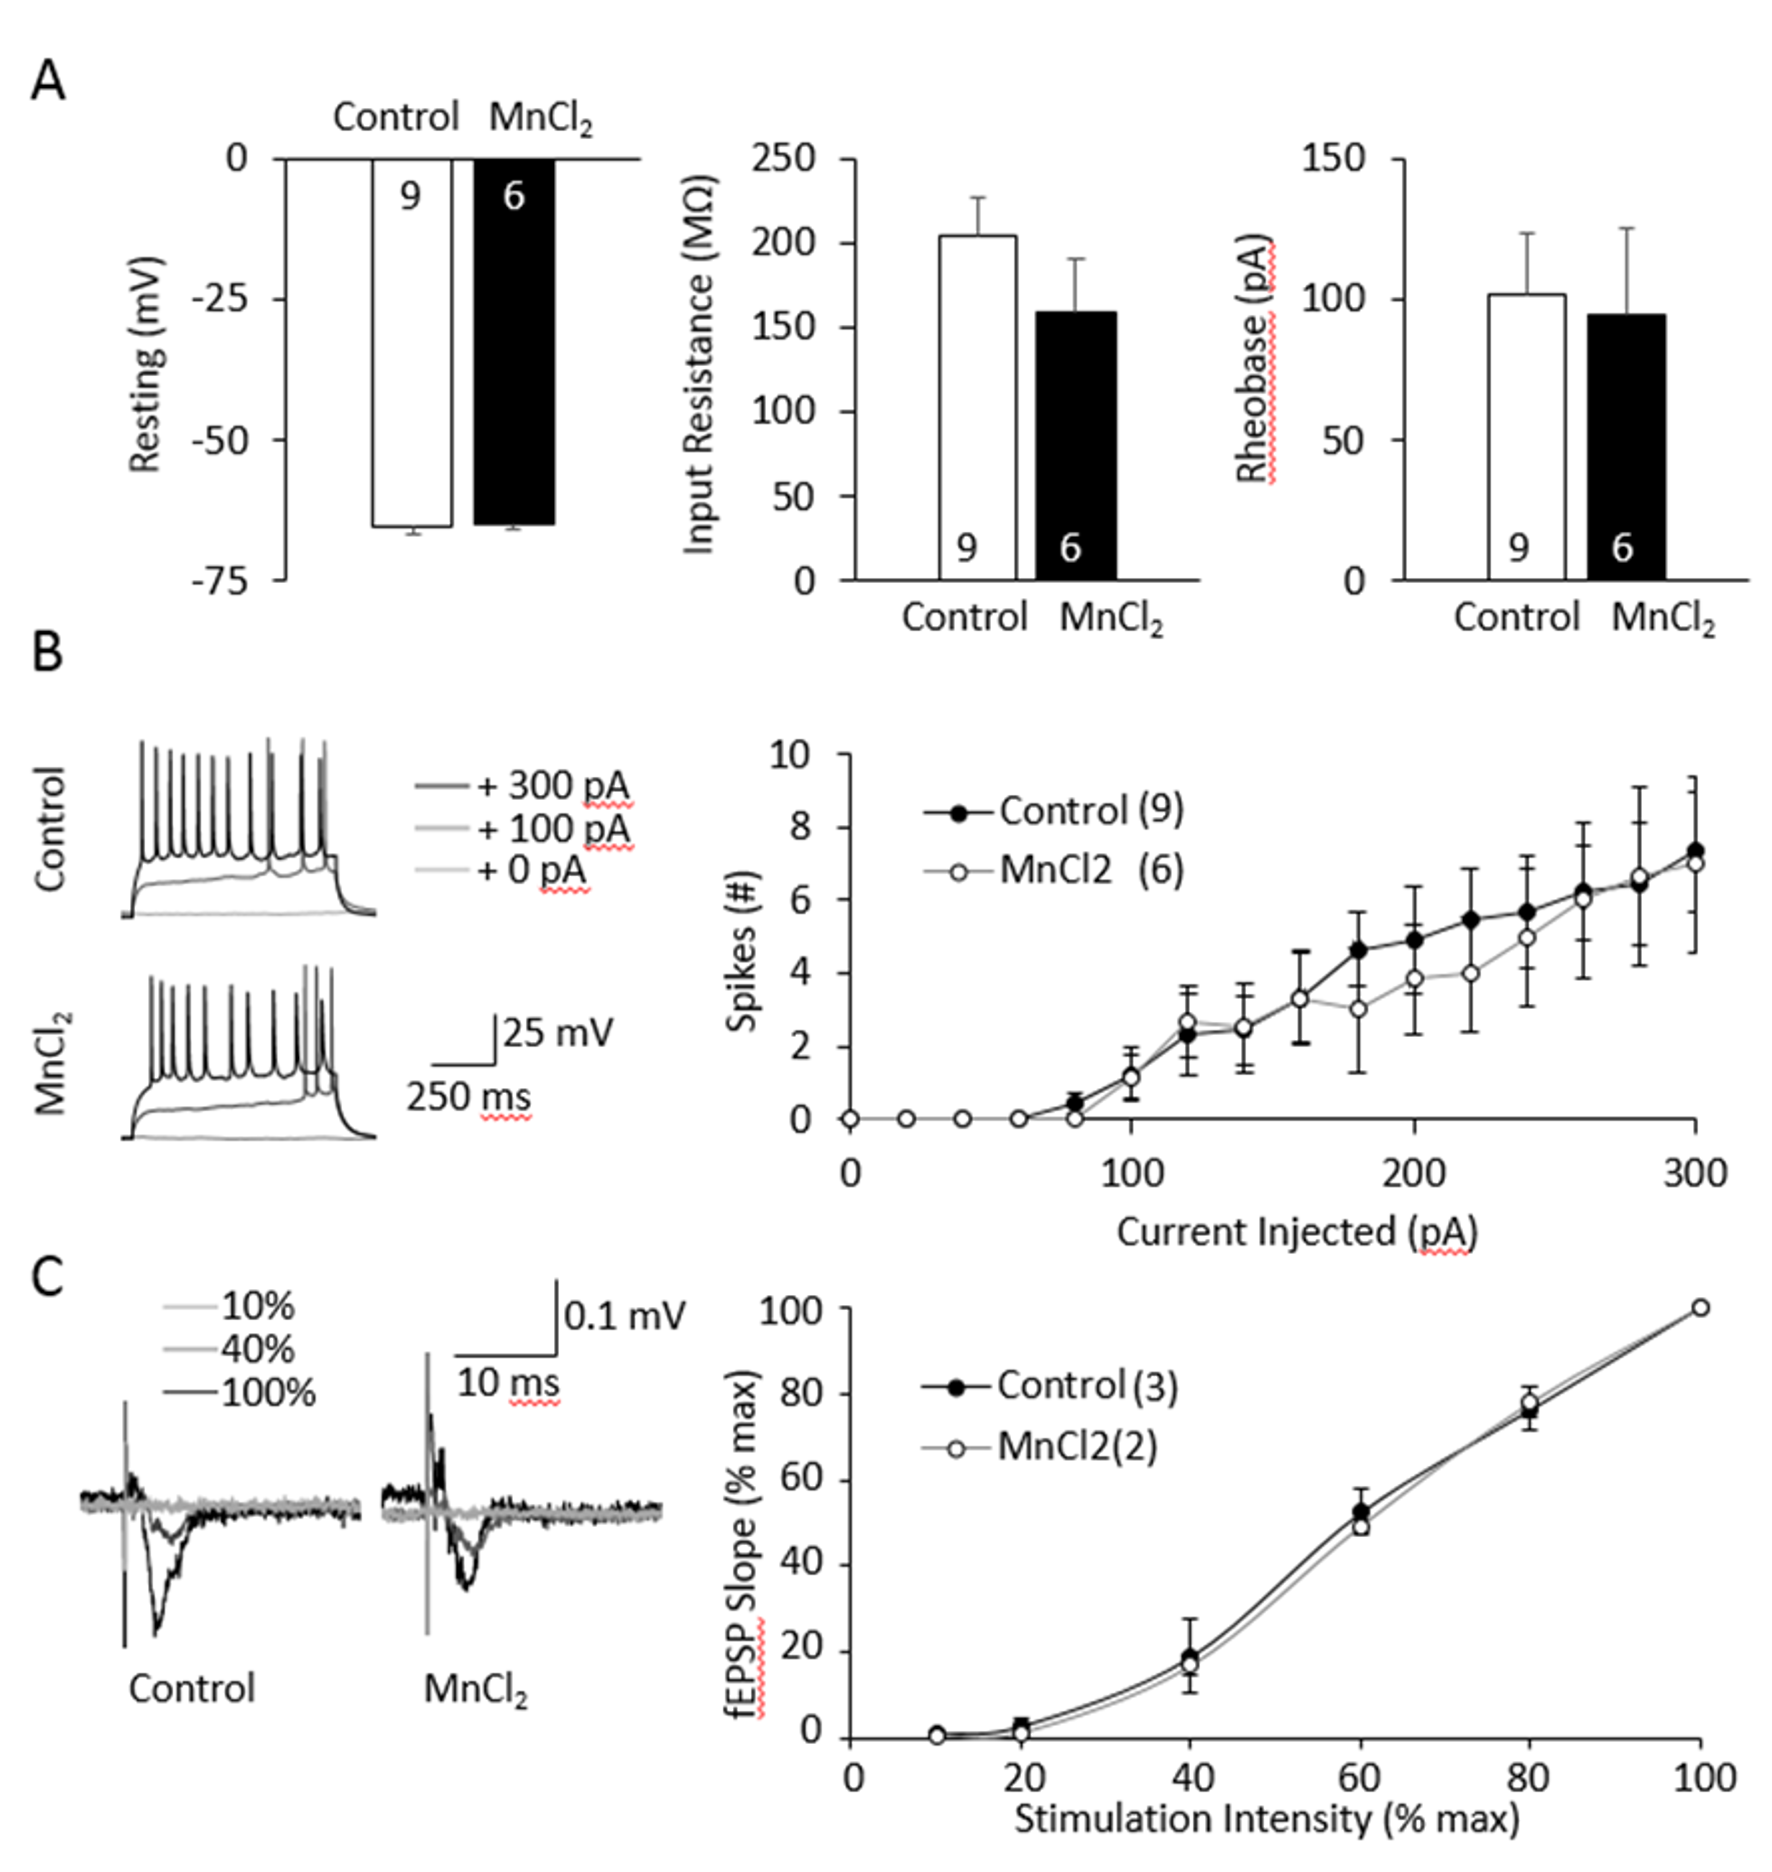
Figure 2: OHSC viability after 24h incubation with 100 µM Mn used for TEM / X-ray analysis.
A-B- Intrinsic excitability measured by single cell recording of the principal neurons of CA3.
A-Measurements of the resting membrane potential, input resistance and the Rheobase are represented.
B- Traces of the Rheobase and number of spikes per injected current for controls and Mn2+-incubated OHSC are represented.
C- Intrinsic membrane properties measured by field recording of the principal neurons of CA1. Traces, as well as the fEPSP slope, for controls and Mn2+ incubated OHSC are shown.
None of the data was significantly different.