3032
Feasibility study of multinuclear MR at 9.4T and PET in a rat brain tumour model1Forschungszentrum Juelich, Juelich, Germany, 2Department of Nuclear Medicine and Neurology, RWTH Aachen University Hospital, Aachen, Germany, 3Faculty of Medicine, Department of Neurology, RWTH Aachen University, JARA, Aachen, Germany
Synopsis
Multinuclear MR provides important information concerning cell integrity or energy metabolism. PET uses radioactive tracers to gain valuable insights into physiological and metabolic processes with both a high level of sensitivity and specificity. Here, we explored the combination of sequential multinuclear MR and PET in a rat brain tumour model. This allows in vivo multinuclear MR-PET experiments to be carried out without compromising the performance of either multinuclear MR or PET. In
Introduction
X-nuclei play a pivotal role in biochemistry and physiology and offer complementary information relating to cell membrane integrity and energy metabolism1,2. PET using various radioactive tracers, e.g. O-(2-[18F]-fluoroethyl)-L-tyrosine (18F-FET) provides important insights into metabolic processes. 18F-FET shows low uptake in healthy brain tissues but high uptake in gliomas3, promising high specificity in the detection and differentiation of tumour tissue. In this work, we explored the combination of a multinuclear ultra high-field MR system with 18F-FET-PET, using sequential measurements in rats with and without brain tumours.Material and methods
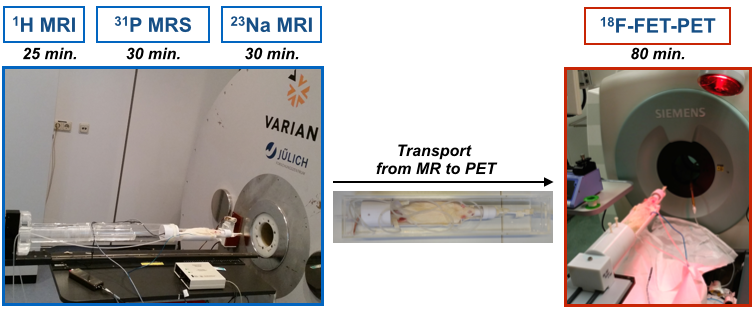
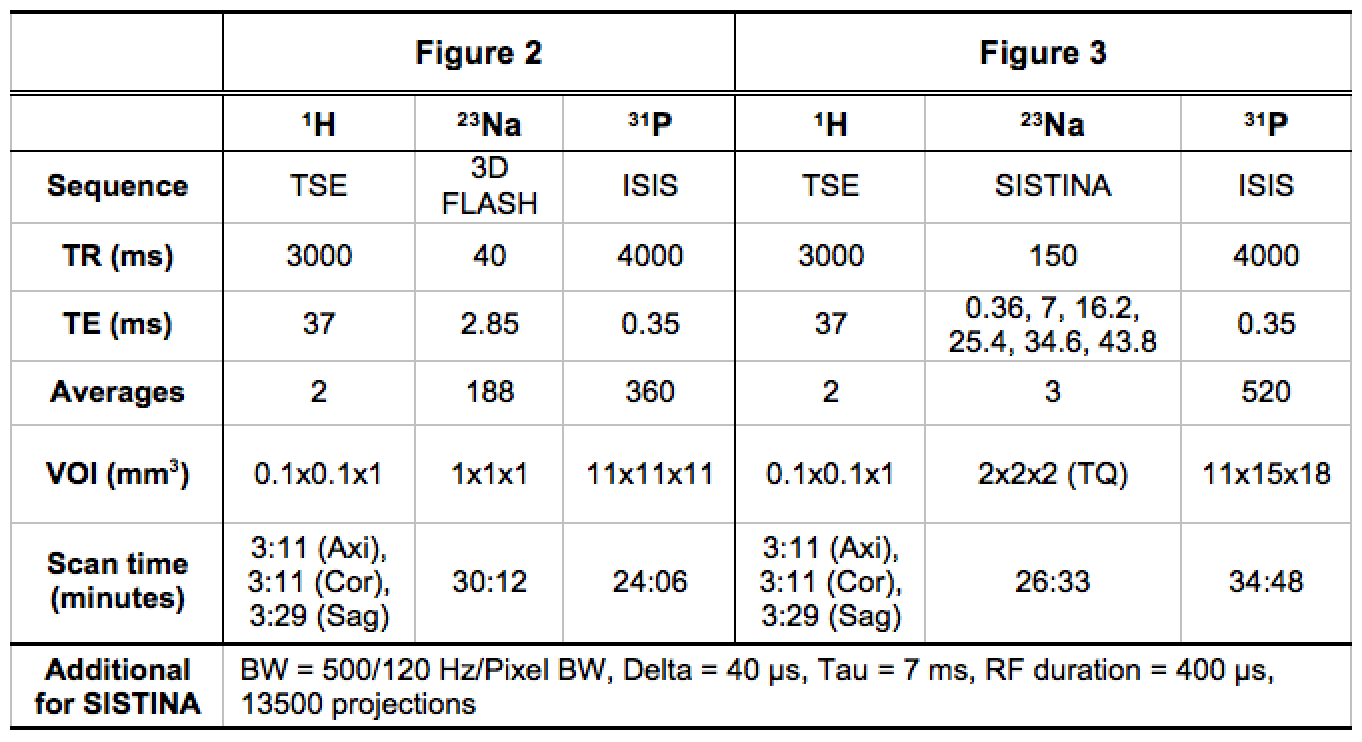
All animal measurements were approved by the animal protection committee. Rodent 9L gliosarcoma cells were implanted into the right striatum of two rats and two healthy rats were used as a control. MR experiments were carried out on a home-integrated preclinical 9.4T scanner and multinuclear MR (1H, 23Na and 31P) measurements were obtained using exchangeable multinuclear coil sets4. The detailed MR scan parameters are listed in Table 1. A dedicated, common bed and a transport carrier for both modalities were carefully designed and constructed. As shown in Fig. 1, a Perspex box pre-filled with isoflurane was used to maintain anaesthesia of the rat for transportation from MR to the PET site (<3 minutes). All PET measurements were performed on a small animal Siemens INVEON PET imager. The 18F-FET tracer was synthesised in-house and injected via a venous catheter inserted into the rat’s tail vein. A transmission scan (~10 minutes) for attenuation/scatter corrections was initially carried out and PET data were acquired in the 3D list mode (~65 minutes) starting with injection of 18F-FET (bolus injection 35 MBq in 0.5 ml in 1 minute). Filtered back-projection was employed for the reconstruction with a voxel size of 0.8×0.8×0.8 mm3. All images were corrected for random coincidences, scatter and attenuation, and summed PET images were used for co-registration with MR.Results
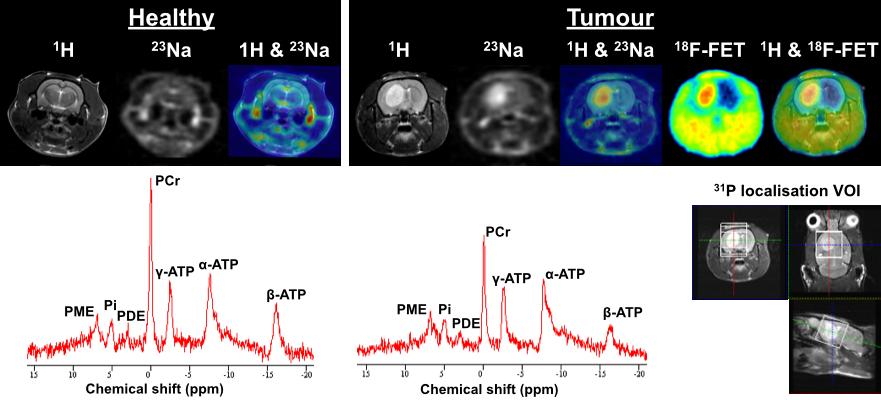
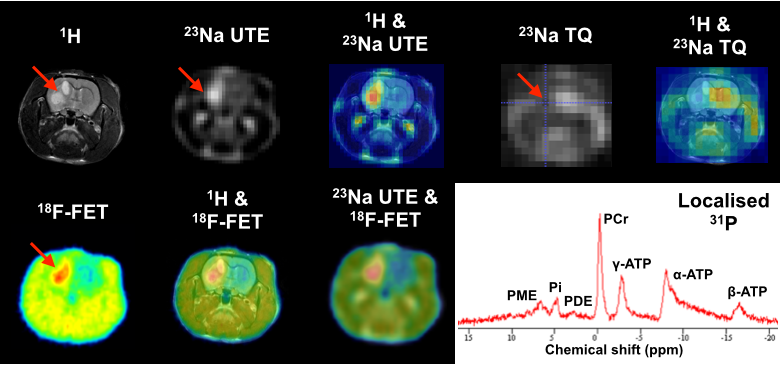
Figure 2 shows one exemplary axial slice of in vivo multinuclear MR and 18F-FET-PET of the brains of healthy (left) and tumour bearing (right) rats. The 1H image presents structural details of the rat head, which was also used as reference for co-registration with either 23Na or 18F-FET-PET images. The 23Na image weighted for total tissue sodium concentration shows a relatively homogenous signal in the healthy brain while the signal intensity of 23Na in the tumour was significantly increased providing a high contrast to the healthy tissue. As expected, 18F-FET uptake was high and restricted to the site of the tumour, thus delineating the tumour from healthy brain tissue. In the 31P spectrum, a considerably lower level of PCr and ATP metabolites can be observed in the tumour compared with the normal brain. The voxel-of-interest (VOI) of 31P was localised in the tumour region, as shown at the bottom right in Fig. 2. Figure 3 shows 23Na images with different weightings acquired using a SISTINA sequence5. The UTE 23Na image shows the tissue sodium concentration contrast in the brain with detailed structural information. It was also found that the region of the tumour tissue possesses a higher sodium concentration, appearing bright, while healthy tissues show a homogeneous signal. In contrast, the triple-quantum (TQ) weighted image shows a significant signal reduction in the tumour site. This may be resulted due to decrease of 23Na restriction in the affected tissue. A localised single voxel 31P spectrum shown in Fig. 3, depicts excellent SNR to clearly differentiate individual 31P metabolites. Again, increased uptake of 18F-FET was found in the tumour region.Discussion and conclusions
The feasibility and the diagnostic potential use of different X-nuclei with 18F-FET were exploited in a rat glioma model, using multinuclear MR and standalone PET scanners. All 1H, 23Na and 18F-FET-PET images provided abnormal contrast in the tumour area, i.e. hyperintense signal in the T2w 1H, concentration-weighted UTE 23Na and 18F-FET-PET, but hypointense signal in TQ-weighted 23Na. 31P metabolites appeared to be different in healthy and brain tumour rats. Different X-nuclei and PET tracers of choice could be combined in the acquisition scheme, for example, to validate cerebral oxygen consumption6 or to investigate the cellular regulatory activity based on the sodium/potassium pump7. Since determination of tumour grade, identification of tumour recurrence and detection of treatment response is difficult with conventional MRI, X-nuclei MR, in combination with PET, may provide more specific information to fulfil this purpose. The unique technical integration presented here allows in vivo multinuclear MR-PET experiments to be conducted without compromising any aspects of multinuclear MR or PET qualities.Acknowledgements
No acknowledgement found.References
1. Kemp, G. Non-invasive methods for studying brain energy metabolism: what they show and what it means. Dev. Neurosci. 22, 418-428 (2000).
2. Madelin, G., Lee, J.-S., Regatte, R.R., Jerschow, A. Sodium MRI: Methods and applications. Prog. Nucl. Magn. Reson. Spectrosc. 79, 14-47 (2014).
3. Langen, .K.-J. et al. O-(2-[18F]fluoroethyl)-l-tyrosine: uptake mechanisms and clinical applications. Nucl. Med. Biol. 33, 287-294 (2006).
4. Choi, C.-H. et al. Development of a simple multinuclear MRI system for ultra high-field imaging of animals, J. Magn. Reson. 273, 28-32 (2016).
5. Fiege, D.P. et al. Simultaneous single-quantum and triple-quantum-filtered MRI of 23Na (SISTINA). Magn. Reson. Med. 69, 1691-1696 (2013).
6. Atkinson, I.C., Thulborn, K.R. Feasibility of mapping the tissue mass corrected bioscale of cerebral metabolic rate of oxygen consumption using 17-oxygen and 23-sodium MR imaging in a human brain at 9.4 T. Neuroimage 51, 723-733 (2010).
7. Kirsch, S. et al. In vivo chlorine-35, sodium-23 and proton magnetic resonance imaging of the rat, NMR Biomed. 23,1099-1492 (2010).
Figures