3029
Assessment of Metastatic Lymph Node in Head and Neck Cancer Using Simultaneous 18F-FDG-PET and DCE-MRI1Center for Advanced Imaging Innovation and Research (CAI2R), Radiology, NYU School of Medicine, New York, NY, United States, 2Center for Biomedical Imaging, Radiology, NYU, NYU School of Medicine, New York, NY, United States, 3New York Medical College, Valhalla, NY, United States, 4Department of Radiology, NYU School of Medicine, New York, NY, United States, 5Otolaryngology-Head and Neck Surgery, NYU School of Medicine, New York, NY, United States, 6Pathology, NYU School of Medicine, New York, NY, United States
Synopsis
Regional lymph node metastasis is one of the important predictors of poor prognosis in head and neck cancer. Detecting small nodes with micro-metastases remains challenging for currently available diagnostic imaging methods, including positron emission tomography with 18F-fluorodeoxyglucose (18F-FDG PET) and dynamic
Introduction
Dynamic contrast enhanced magnetic resonance imaging (DCE-MRI) has been widely used to assess tissue microenvironment of cancer by measuring blood flow-related parameters such as perfusion, permeability or vascular volume. FDG PET is the modality of choice to assess abnormally high rates of glucose metabolism in cancer cells. However, the use of simultaneous MRI and PET to probe microenvironment changes has not been fully investigated. The purpose of this study is to demonstrate the synergistic role of FDG PET and DCE-MRI for assessing the metastatic status of regional lymph nodes in head and neck cancer.Methods
Patients (n=20) with head and neck cancer who were scheduled for node dissection surgery were recruited in this study. All patients underwent one research PET/MR scan within one week prior to the planned surgery. The imaging study was conducted using a whole body 3T PET/MR scanner (Biograph mMR, Siemens Healthcare) at the Center for Biomedical Imaging, NYU School of Medicine. During the dissection surgery, the locations of removed lymph nodes were marked according to the conventional neck lymph node levels, in order to perform level-to-level comparison between PET/MR parameters and pathology. The PET acquisition started 1 min before injection of the PET tracer (10 mCi of 18F-FDG) and conducted in a dynamic fashion for 60 min. The attenuation correction map was estimated using the water and fat images generated from a T1-weighted Dixon gradient-echo sequence. PET images were reconstructed on the vendor platform incorporating the attenuation map which provides 127 axial slices with 344x344 matrix at 2x2x2 mm3 voxel size. A two compartmental model (1) was used to estimate the forward rate constant between blood and tissue compartment (K1) is the reverse rate constant between blood and tissue compartments (k2), and the rate constant representing trapping of FDG intracellularly after phosphorylation by hexokinase (k3). While acquiring dynamic PET data, DCE-MRI data were acquired simultaneously using a golden-angle radial 3D gradient echo sequence with TR/TE=3.6/1.7ms, FA=10deg, Res=1x1x2mm. After acquisition of baseline images for 1 min, a single dose of Gd-DTPA (0.1 mM/kg body weight) was injected at 1 mL/s into an antecubital vein followed by saline flush, during which scanning was continued for another 9 min. The dynamic images were reconstructed using the GRASP method (2). MR contrast kinetic model parametric maps were computed using the modified Tofts model (3) with the arterial input function (AIF) estimated from a manually selected region of interest (ROI) in the cervical segment of the internal carotid artery. Estimated contrast kinetic parameters were the volume transfer constant between blood plasma and the interstitium (Ktrans), the transfer constant from the interstitium to the blood plasma (Kep), and the plasma volume fraction (Vp). Both PET and MRI data analyses, including co-registration between them, were performed using FireVoxel (https://wp.nyu.edu/firevoxel). ROIs were drawn on lymph nodes at the levels matched with the surgical pathology reports by a board certified head and neck radiologist. MRI and PET pharmacokinetic parameters were compared between pathologically proven metastatic nodes and negative ones. Statistical data analyses were performed using Graphpad Prism version 7.03 (GraphPad Software, La Jolla, CA, USA).Results
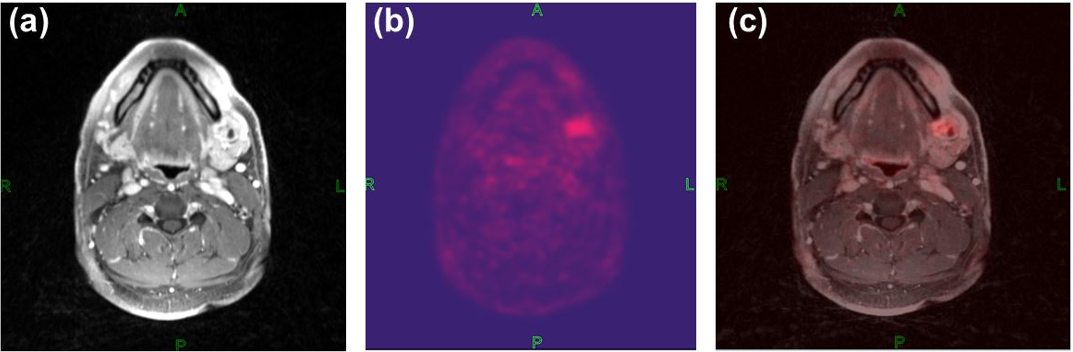
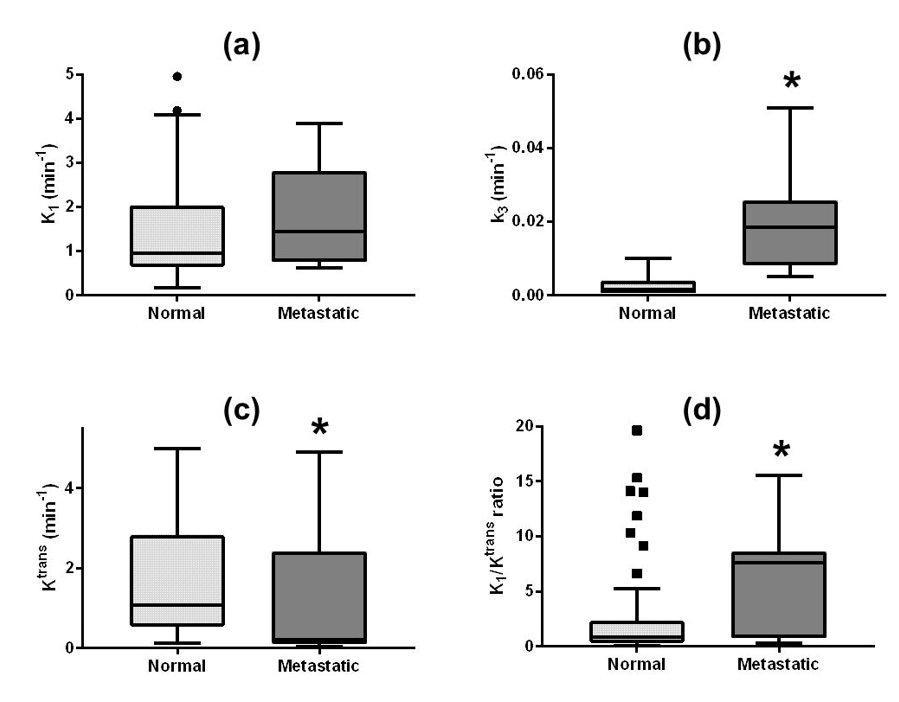
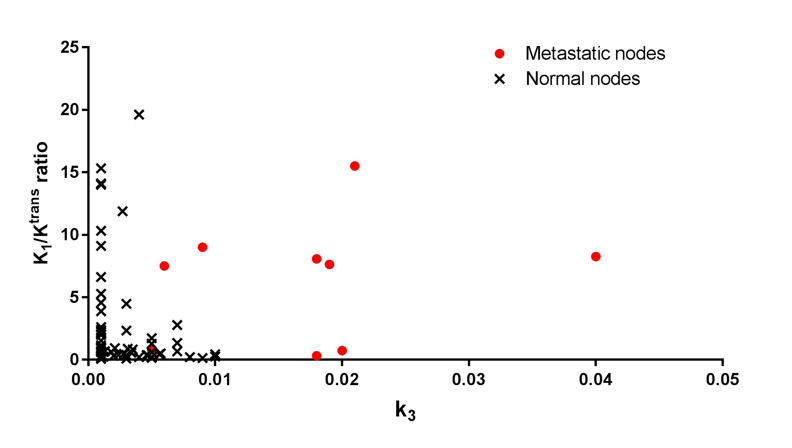
Figure 1 shows a representative example of MRI and PET images with good alignment of two images from the simultaneous acquisition. The pharmacokinetic model analysis of dynamic PET data showed that metastatic nodes have significantly (p<0.001) higher rate of FDG phosphorylation (k3) than normal nodes (Fig.2b). The vascular delivery of FDG, measured as K1, was higher in the metastatic nodes than in the normal nodes with no statistical significance (Fig.2a). The median Ktrans of MRI contrast agent was significantly (p=0.0192) lower in the metastatic nodes than in the normal nodes (Fig.2c). Assuming that the tumor vascular leakiness is high for both FDG and Gd-based contrast agent, the ratio of K1 to Ktrans was calculated as a surrogate marker for FDG cellular uptake including the expression of glucose transporters. As shown in Fig.2d, the median K1/Ktrans of the metastatic nodes was significantly (p=0.0222) higher than that of the normal nodes. The scatter plot of k3 and K1/Ktrans (Fig.3) shows that the normal nodes are clustered in the region with low k3 and low K1/Ktrans values, whereas the metastatic nodes tend to have high k3 and high K1/Ktrans ratios.Discussion
The combined DCE-MRI and FDG PET study has been successfully demonstrated in this study and can be used to assess the metastatic status of lymph nodes of head and neck cancer patients. Future studies will include the application of these kinetic parameters for detection of micro-metastasis in lymph nodes as well as extracapsular invasion.Acknowledgements
NIH grant R21CA188217References
1. Sokoloff, Louis, et al. "The [14C] deoxyglucose method for the measurement of local cerebral glucose utilization: theory, procedure, and normal values in the conscious and anesthetized albino rat." Journal of neurochemistry 28.5 (1977): 897-916.
2. Feng L, Grimm R, Block KT, Chandarana H, Kim S, Xu J, Axel L, Sodickson DK, Otazo R. Golden-angle radial sparse parallel MRI: combination of compressed sensing, parallel imaging, and golden-angle radial sampling for fast and flexible dynamic volumetric MRI. Magn Reson Med 2014;72(3):707-717.
3. Tofts PS, Brix G, Buckley DL, et al. Estimating kinetic parameters from dynamic contrast-enhanced T(1)-weighted MRI of a diffusable tracer: standardized quantities and symbols. J Magn Reson Imaging 1999;10(3):223-232.4.
Figures